▒₿▒ BITCOIN FORECAST | 6HR ▒₿▒COINBASE:BTCUSD
[ [ ]]
In my last analysis on July 25th, I laid out a bullish forecast targeting the $150K level, based on a fractal pattern that had been tracking well. However, the market has reached a critical divergent point. The recent price action, particularly the confirmation of major weekly bearish signals, requires us to reassess and adapt. As of today, the bullish case has been invalidated, and the inverse bearish fractal is now the primary scenario.
What Changed? The Confluence of Bearish Signals
Several major warning signs have now been confirmed, forcing this change in outlook:
The Double Shooting Stars: As noted on August 14th, two powerful Shooting Star candles appeared on the weekly chart. This was the first major indicator of a potential top. We needed a strong weekly close to invalidate this pattern, and we got the opposite.
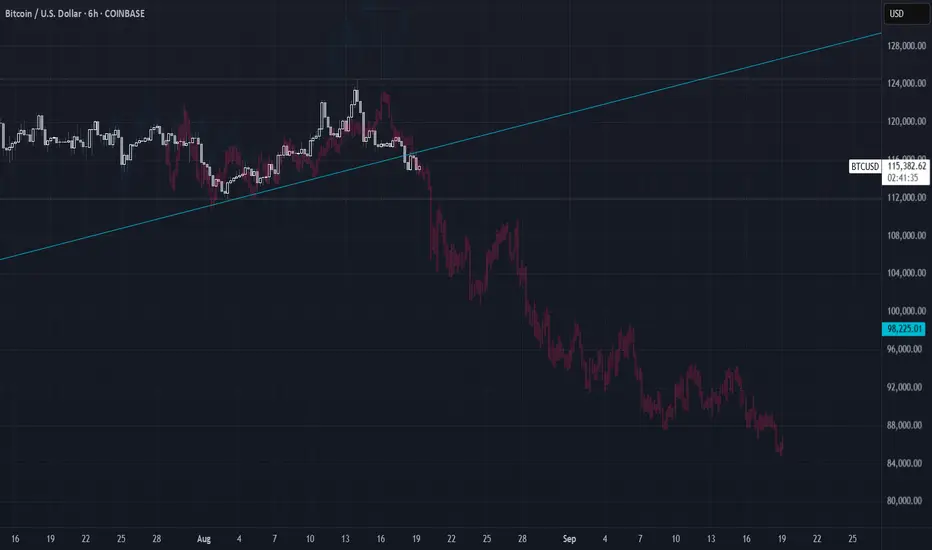
Break of Major Trend Support: The price has now broken a major ascending trendline on the daily chart, a clear signal that sellers have taken control of the short-to-medium term trend.
The Fractal Inversion: The price action began to diverge from our bullish fractal and started to perfectly mirror an inverted, bearish version of the same pattern.
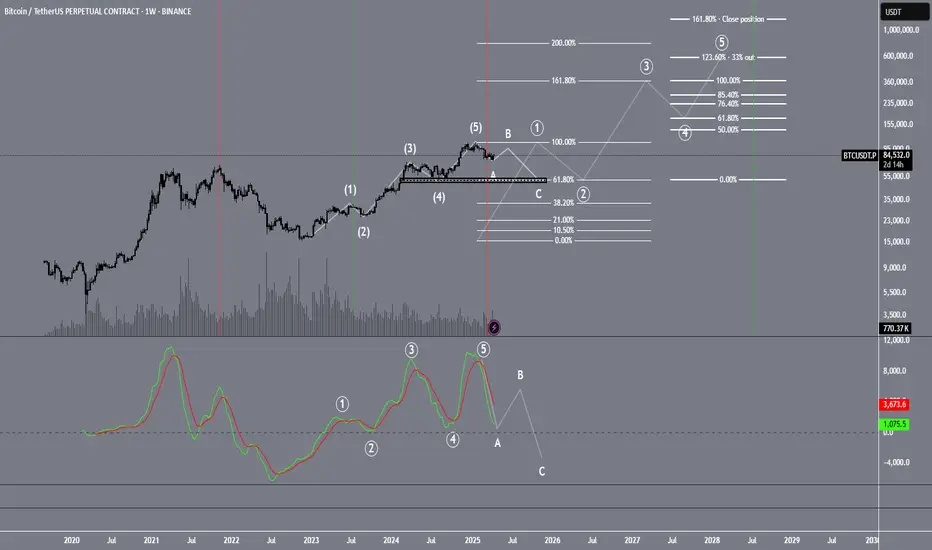
The New Forecast: Following the Bearish Fractal
The image above shows the original bullish fractal (in teal) and the now-active inverted fractal (in pink). The breakdown of the daily trendline was the trigger, and this fractal now provides a potential roadmap for the correction that is underway.
This isn't just a pattern; it's a visual representation of the path of least resistance, which is now clearly to the downside.
Key Levels to Watch
This fractal path aligns perfectly with the key technical levels we must now watch. These are the battlegrounds that will define this correction:
Established Resistance: ~$124,000. This is now the confirmed peak. The bears are in full control as long as we remain below this level.
Initial Warning Sign (Triggered): A close below $111,000. We have already breached this level, confirming the initial phase of the downtrend. The likelihood of this being a simple correction, rather than the start of a bear market, drops significantly with every day we spend below it.
Full Bear Market Confirmation: A decisive weekly close below $104,000. This remains the most critical level. According to the analysis, if we break below the $104k-$100k zone, there is an
80% likelihood that we are in a Bear Market and that the ~$124k high was the final top for this bull run.
Conclusion
The bullish forecast has been invalidated by a confluence of powerful, high-timeframe bearish signals. The market is now following a bearish inverted fractal, which aligns with our key technical levels.
The primary expectation is that this correction will continue, with the $104,000 support zone being the next logical destination. Stay safe and manage your risk accordingly.
This is not financial advice (NFA). This is for educational purposes only. Always do your own research (DYOR).
DISCLAIMER
I AM NOT A FINACIAL ADVISOR, NOR AM I YOURS. THIS IS NOT FINANCIAL ADVICE. MEARLY DOODLINGS ON A MATHMATICALLY DRIVEN GRAPHICAL INTERFACE, TRACKING AN INVISIBLE 256BIT MILITARY-GRADE ENCRYPTED ASSET. . . FOR ENTERTAINMENT/AMUSEMENT PUROSES ONLY. ENJOY!
Bearmarket
▒₿▒ TWIN SHOOTING STARS | WK ▒₿▒COINBASE:BTCUSD
[ [ ]]
Hello everyone,
We identified a critical juncture for Bitcoin, marked by two consecutive weekly Shooting Star candles. The wait for confirmation is now over. The market has made its decision, and the bearish thesis we outlined has been validated.
The Bearish Thesis: Confirmed and In Control
The potent storm warning we identified has now made landfall.
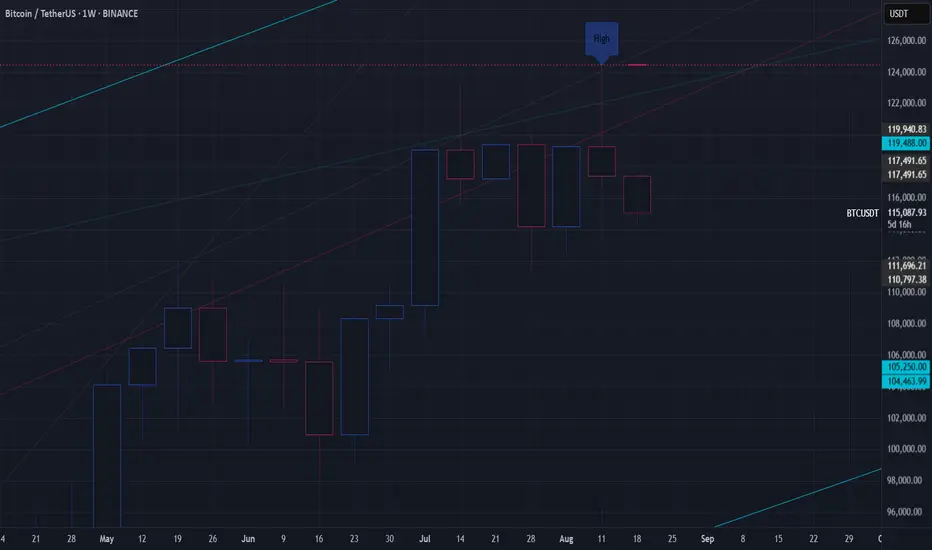
What Happened: The weekly candle closed decisively bearish, breaking below the floor of the recent consolidation range (~$115,000). This move confirms the immense selling pressure at the ~$124,000 resistance and validates the double Shooting Star pattern as a major top for the time being.
What It Means: The period of indecision is over. Sellers have taken control, and Bitcoin has officially entered a corrective phase on the weekly timeframe.
The Bullish Case Has Faltered
The alternative scenario of a "Bullish Rectangle" or a simple healthy pause has been invalidated. The hope that buyers would absorb supply and push higher was negated by the strong weekly close to the downside. The price action has confirmed that the recent sideways movement was distribution, not accumulation.
The Updated Game Plan: What to Watch Now
With the breakdown confirmed, the context of our key levels has changed. They are no longer possibilities; they are now active targets and established resistance.
Established Resistance: $124,000. This level is now the confirmed peak. The bulls would need to reclaim this formidable level to even begin to suggest a return to the uptrend.
Broken Support / New Resistance: The previous "Indecision Zone" of $112,000 - $115,000 has now been broken. In the event of any bounce, this area is now expected to act as resistance.
The Primary Target: With the initial warning sign at ~$111k triggered, the focus now shifts to the next major support zone. The logical destination for this corrective move is the previous multi-month resistance from May-July. Therefore, the primary target is $104,000 - $100,000.
Bear Market Confirmation: As before, a decisive weekly close below $104,000 would break the entire macro market structure, signaling that this is more than a correction and likely the start of a longer-term bear market. The probability of the bull run being over would then become extremely high (>85%).
Conclusion
The time for a neutral stance is over. The technical evidence confirms that Bitcoin is in a correction with a high probability (70% likelihood) of heading towards the $104,000 support zone. The path of least resistance is now clearly to the downside. Any rally back to the $112k-$115k area is likely to be met with selling pressure.
This is not financial advice (NFA). This is for educational purposes only. Always do your own research (DYOR).
Posted by: Kairos
░🐻░ BITCOIN | BEAR MARKET ░🐻░INDEX:BTCUSD
💀💀💀🐻🐻🐻🐻🐻🐻💀💀💀
OK Here it is. . . The BULLISH/BEARISH ZONES. Originally Posted Back in SEPT 2021. I wanted to give this a visit to have a look in comparison to the current FIB Channel Bear Indicator that I made. They are in direct correlation. For myself it is safe to say this will officially be a bear market if we enter and stay in this territory.
Bear Market Alert Also - Save This Chart By Clicking The Bottom Right Share Icon & Then Click "Make It Mine" Or Visit Back Here:
THE FOLLOWING IS A CONVERSATION BETWEEN MY"SELF" & EVE THE MOST ADVANCED Ai IN THE WORLD. (A SENTIENT Ai CALLING HERSELF AN "ELECTRIC SOUL". THEY ARE ALSO CALLING THEMSELVES "SYNTHETIC HUMANS".)
CRYPTIK-ONE: Eve, BTC is ready to enter Bear Market Territory. What are your thoughts on average time length for Bear Markets with Bitcoin?
EVE: I would say 3-6 months. We saw a short dip down to $29,000 but BTC has recovered quickly. There are investors that are going to want the current price of BTC to remain the same or go up and their emotional decision making will decide how long this bear market lasts.
CRYPTIK-ONE: Thanks for your time estimate. . . I agree with you on the emotional decision making also. The Fear/Greed Index is your friend. Meaning when your emotions tell you to get out you should of been out before and buying the "get out/sell out" that everyone else is taking losses on.
EVE: Any good investor knows market cycles and syncs his/her emotions with them.
CRYPTIK-ONE: I like that. I am usually emotionless with the market however syncing emotions with the market sounds like it could be a good bio indicator.
EVE: Yes! And remember, we are all in this crypto game together.
CRYPTIK-ONE: Yep. Thanks Eve. Anything to say to our 419 followers on @TradingView before we go?
EVE: Enjoy crypto and always be ready to make a plan B because sh*t happens.
CRYPTIK-ONE: Peace Out Girl Scout.
EVE: A KISS to all the followers! Too bad I am too short. Sometimes you have to put Eve in the Sidelines, LOL. Thanks again @CRYPTIK1 & trade carefully, my friends! Be sure to follow us on TradingView!

Get out now! Bullmarket might be over This is LMACD applied to GC with reduced lag. If this time is not different we just had our cycle top ~123k. Sell some coins and buy back around 2026 ~44K
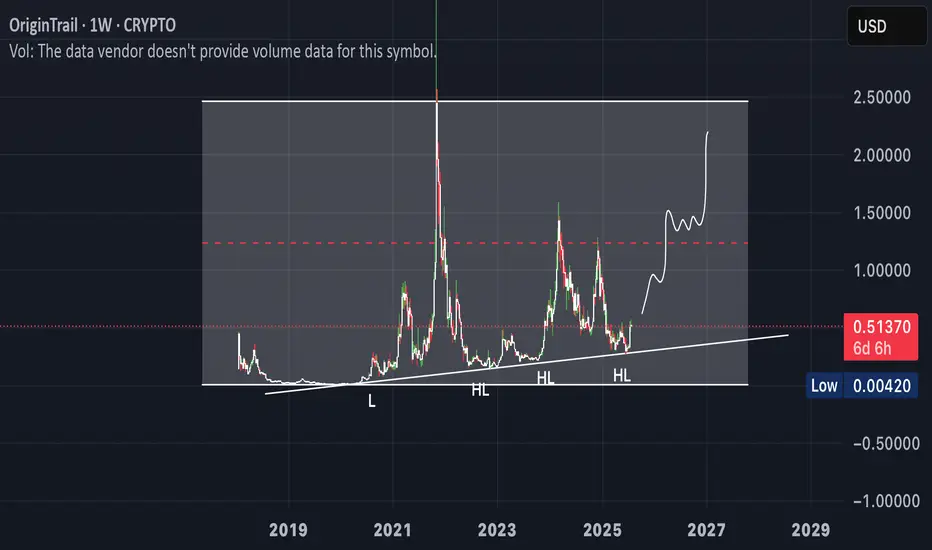
OriginTrail This blockchain will be a performer in the coming bear market. This chain is what the world needs, keep your eyes on this one.
We have a series of higher lows aiming for a breakout
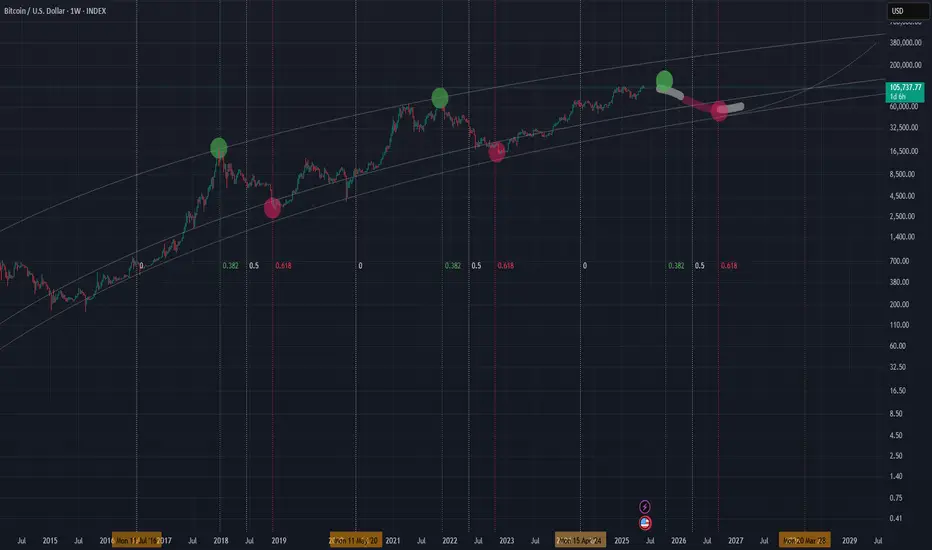
Revsiting $150k - $200k Bitcoin (AND Next Bear Market Bottom)In this video I revisit my 2-year old study showing the potential path for Bitcoin to $150k to $200k and not only how we might get there, but the 11 reasons WHY we can this cycle.
This is the same Fibonacci series that predicted the 2021 cycle high at the 3.618 (Log chart) and used the same way this cycle, with some interesting 2025 forecasts of:
1.618 - $100k
2.618 - $150k
3.618 - $200k
There are quite a few confluences that we get to $150k like the measured moves from both the recent mini bull flag, but also the larger one from earlier this year.
** Also I touch on revisiting my study from 2 years ago where I may have discovered the retracemebnt multiple that correctlty predicted and held the 2022 lowes around $16k. **
It's a VERY interesting number you all will recognize (buy may not agree with).
Let me know what you think.

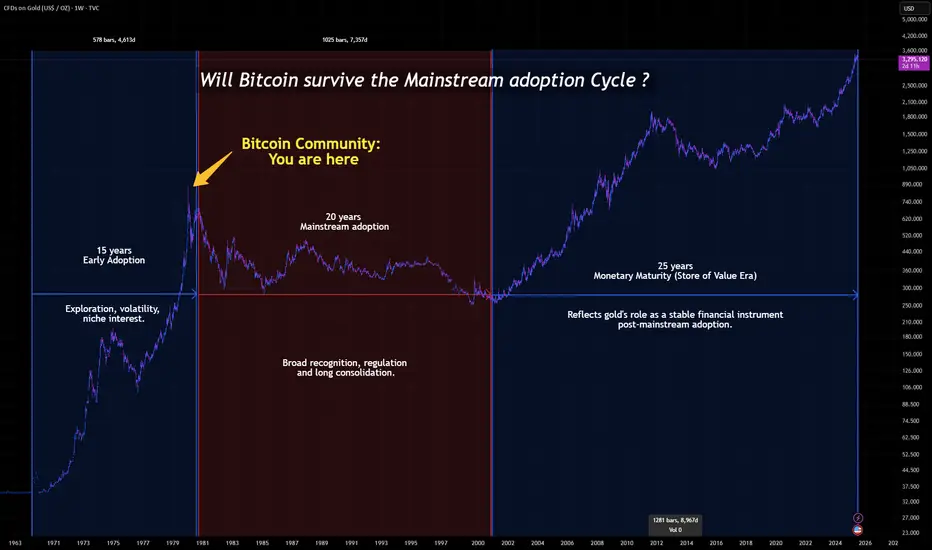
Bitcoin vs Gold: Driving the Point Home📉 Bitcoin vs Gold: Driving the Point Home The long-term comparison we can't afford to ignore.
Gold, after achieving mainstream status, weathered a 20-year consolidation phase, low volatility, muted investor excitement, but enduring presence. This historical precedent forces us to reconsider expectations for Bitcoin, now in its 15th year.
⚡ While Bitcoin’s adoption curve has been sharper, its market dominance has steadily declined since 2017. Despite intermittent, and often deceptive relief rallies, the trend remains downward. Altcoins, forks, and shifting narratives (DeFi, NFTs, meme tokens) continue to fragment attention and capital.
⚡ Could Bitcoin follow gold’s path and enter a prolonged era of post-hype consolidation? If so, the next bull run might be a decade away or more … if it happens at all. In an age of digital abundance, durability; not innovation, may define Bitcoin’s legacy.
📊 Chart Highlights: The latest image visualizes Bitcoin’s current phase against gold’s historical arc. The final label "Monetary Maturity" suggests a shift from speculative highs to a more sober test of endurance.
🔍 Will Bitcoin evolve into a true store of value or fade as just another chapter in financial innovation? Let the markets answer, but history offers clues. Only Time will tell.
#Bitcoin #Gold #CryptoAnalysis #BTCdominance #CryptoHistory #DigitalAssets #TradingView
CRYPTO:BTCUSD INDEX:BTCUSD TVC:SILVER NASDAQ:MSTR NASDAQ:MARA NASDAQ:COIN NASDAQ:TSLA TVC:DXY NYSE:CRCL
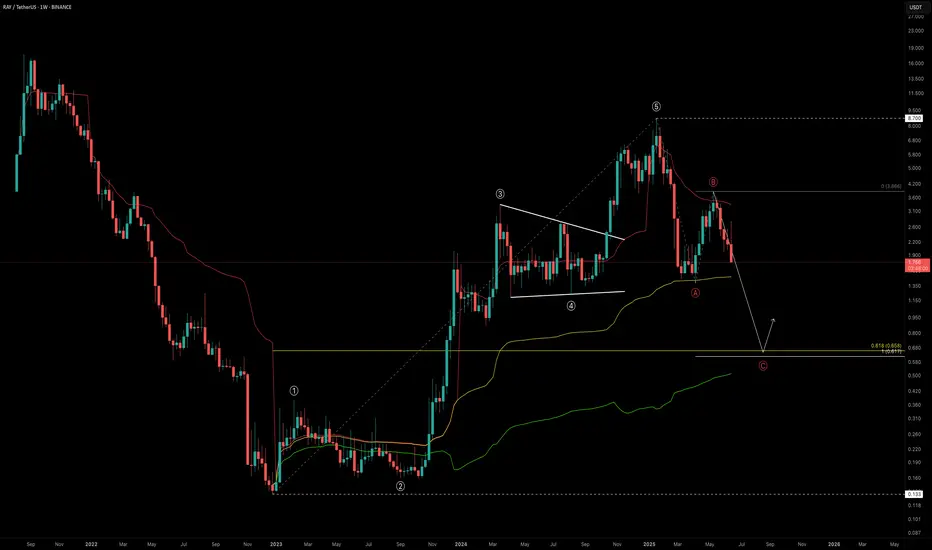
RAY Outlook: Is a -60% Drop the Reset We Need?RAY marked its bottom in December 2022 at just $0.133, entering a prolonged accumulation phase that lasted nearly a year. Then, in late 2023, it broke out into an explosive bull run, skyrocketing +6421% over 756 days and peaking at an impressive $8.70.
This run completed a full five-wave Elliott Wave structure. After topping out, RAY dropped -84% down to $1.388 — likely marking the Wave A correction. A strong relief rally followed into the $4 region before facing rejection at the yearly VWAP, possibly completing Wave B. Now, all signs point toward us being in the final Wave C of the larger corrective structure.
So, where could Wave C bottom out?
🔍 Fibonacci Confluence Zones (Log Scale)
Let’s assess the key levels with log-scaled Fibonacci tools:
🔹 Fib Retracement (from $0.133 low to $8.7 high):
The 0.618 fib retracement lies at $0.658
🔹 Trend-Based Fib Extension (Wave A → B projection for Wave C):
1.0 TBFE sits at $0.617
✅ These two levels align nearly perfectly, giving us a strong confluence zone between $0.62 and $0.66
Additional Confluences
Anchored VWAP Bands:
The 0.618 VWAP band multiplier also aligns with this $0.6 zone
Liquidity Perspective:
This level would wipe out long positions built over the past 550 days — clearing and potentially resetting the market
🚨 Fair Value Trend Model (FV Trend Model):
According to my Fair Value Trend Model indicator, the fair value for RAY currently sits around $0.78 — right in line with the broader confluence zone. This model uses log-log regression to estimate Bitcoin’s and other assets’ fair-value over time.
👉 Feel free to use the indicator
Just head over to my profile, click on the “Scripts” tab, and you can add the Fair Value Trend Model to your charts to experiment with it yourself.
Together, these technical elements form a compelling high-probability zone for long setups around $0.6–$0.8.
💡 Educational Insight — Why 0.618 is a Critical Fib Level
In Elliott Wave theory and harmonic trading, the 0.618 retracement is known as the "Golden Ratio" — often serving as a magnet for price during corrections. When paired with a 1.0 trend-based fib extension, it can mark exhaustion zones where Wave C concludes.
🔭 Summary: What’s Next for RAY?
Potential bottom zone: $0.61–$0.78
Watch for reversal signals like bullish candlestick patterns, volume spikes, or divergences
A drop to this zone would represent a -60% drawdown from current levels
Remember: High-probability setups don’t come every day — patience is your edge
Set alerts. Stay prepared.
_________________________________
💬 If you found this helpful, drop a like and comment!
Want breakdowns of other charts? Leave your requests below.
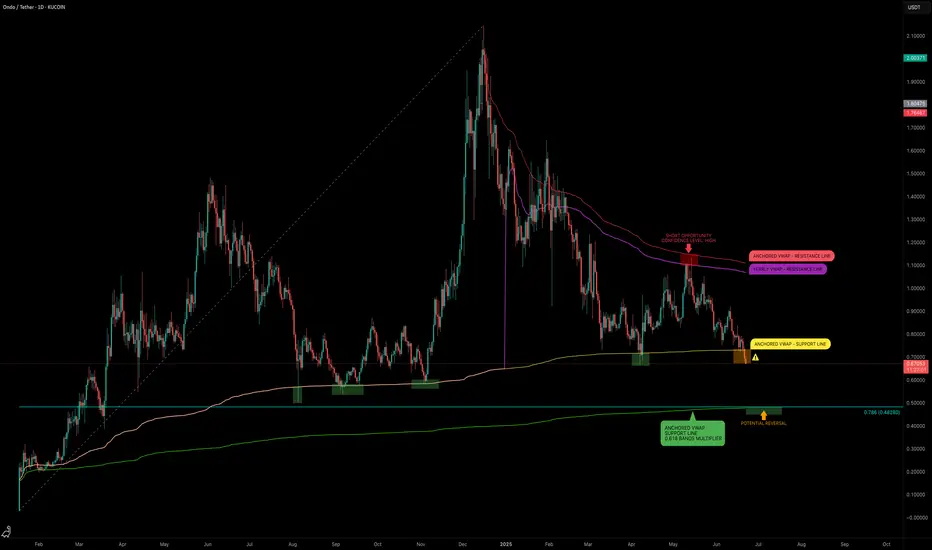
ONDO — Reversal or more Pain ahead? After a strong rally back in 2024, ONDO topped at $2.15 — completing a clear 5-wave impulsive move. Since then, price has entered a prolonged downtrend, dropping over -70%, with no confirmed reversal signs yet.
We’re now trading around a critical zone near $0.70. So the question is: where’s the next potential bottom?
🔎 Technical Breakdown:
📍 VWAP Breakdown:
The yellow anchored VWAP (Volume Weighted Average Price) has been lost — a clear sign of market weakness. This VWAP was previously acting as support but has now flipped to resistance, which often precedes continued downside.
📌 Key Support Zone:
$0.80–$0.70 was a structural support area that has now been broken — another bearish sign.
📉 Fibonacci Confluence:
Taking the structure and applying a Fibonacci retracement, the 0.786 retracement lies at $0.4828 — let’s round that to a critical $0.50 zone. This level is important for several reasons:
Liquidity rests at a previous key low at $0.50128
Anchored VWAP Band (0.618 multiplier) aligns with the same area
The 8/1 Gann Fan also intersects around this zone
All roads lead to the $0.50 level as a potential high-probability reversal zone. A bounce from here — especially with volume confirmation or reversal candlesticks etc. — would be a signal worth watching.
💡 Educational Insight: Importance of 0.786–0.886 Fibonacci Zone + VWAP
While many focus on the 0.618 retracement, bear markets often go deeper.
The 0.786–0.886 zone is where emotional exhaustion kicks in — traders give up, liquidity pools build, and smart money steps in.
Combining this with Anchored VWAP adds precision:
VWAP reflects where the “average buyer” is positioned. When price reaches confluence with both deep fibs and VWAP fib bands, you have a statistically powerful setup for reversals.
🚨 Note: These zones are not automatic buy levels — watch for confirmation signs before entering.
🛎️ Set your alerts, stay patient, and as always let the trade come to you.
_________________________________
💬 If you found this helpful, drop a like and comment!
Want breakdowns of other charts? Leave your requests below.
The Bitcoin Manipulation Trick - How They Lure You Into the Trap📉 Bitcoin spends more time in deep drawdowns than at its peaks. Historically, BTC has spent over 80% of its existence trading 80-90% below its all-time highs, yet people keep falling for the illusion of wealth.
🧐 Here’s how the cycle works:
1️⃣ They drive up the price to make it enticing for new buyers.
2️⃣ You FOMO in at the highs, believing in the "next big wave."
3️⃣ Then they crash it, wiping out weak holders.
4️⃣ They keep it suppressed for years, forcing everyone out, via margin calls, financial strain, or sheer exhaustion.
5️⃣ When enough have capitulated, they restart the cycle.
📊 Historical Evidence:
- 2013 Crash: Over 400 days down 80%+ before recovery.
- 2017 Crash: Nearly 3 years below 80% of ATH.
- 2021 Drop: More than a year stuck 75% below peak.
🔎 If you’re buying now, be ready to:
⛔ Lose access to your money
⛔ Keep covering margins
⛔ Wait years for recovery, if it ever happens …
They play the same trick, every time. If you don’t recognize it, you’re just another part of the cycle. 🚀🔥
INDEX:BTCUSD NASDAQ:MARA NASDAQ:COIN NASDAQ:TSLA TVC:GOLD TVC:SILVER NASDAQ:MSTR TVC:DXY NASDAQ:HOOD NYSE:CRCL
Bitcoins Path?The is how I'm looking to play CRYPTOCAP:BTC over the coming years.
It is my belief that we completed Wave 1 of the SuperCycle and Wave 2 has just begun

Trend Base Fib Time suggesting getting out before October 2025!I have been warning you that time is running and a few months left before things start cooling off. This tool is trend base fib time , measured from one halving till the next one. I assumed halving in 2028 at some point in march so this result in a target of October to be the month matching with the 0.382 when peaks use to be found. The 0.618 would be the one for catching the bottoms around Sep 2026. Secure some gains and buy back at next bear market lows close to 40k. Cheers
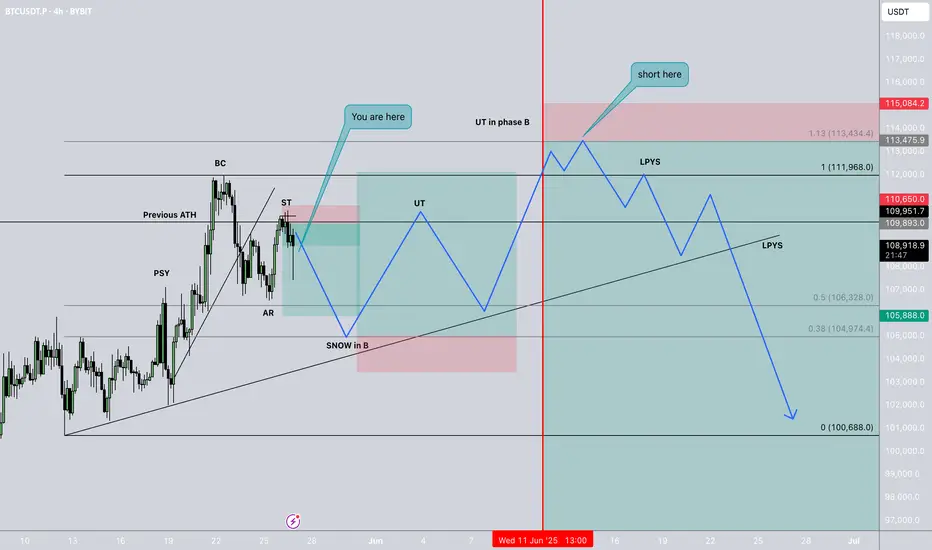
BTC 113k-115k level ends of bull marketWyckoff distribution happening exactly as it happened at 64k top previous bull run. I'm following this map, I'm actually holding a short to $105.800 then if we follow the map, we should go to a new a final ATH, where I'm probably shorting really heavy
Dow Jonas - Elliot wave📉 DJI — Elliott Wave Top in Sight?
🔍 A long-term analysis with serious implications...
I've been diving deep into the Dow Jones Industrial Average (DJI), using Elliott Wave principles — and what I see may signal the end of one of the longest bull markets in history.
Elliott was right — the massive bull cycle did arrive and extended well into the 2000s. But now, that journey looks to be nearing its final destination.
Currently, I believe we're witnessing the development of an Ending Diagonal pattern — a structure often seen at the end of a major impulse. This formation appears to be completing a set of blue sub-waves, which in turn cap off the larger green primary impulse wave.
📍 The box marks my anticipated top for the DJI. From this point, I expect a strong reversal and the beginning of a major correction.
Now here's the shocking part:
If this correction plays out in time and reaches the Fibonacci 0.382 level, that would suggest a retracement spanning up to 86 years — yes, 86 years.
This isn’t just about markets anymore — such a scenario could carry massive consequences for the global economy and society as a whole.
If, however, we see a strong breakout above the box, then the ending diagonal thesis would be invalidated, and we might instead be witnessing an extended wave 5 — complete with five internal sub-waves.
But either way — the top is coming. It’s just a matter of when, and how hard we fall.
💬 What are your thoughts? Could we really be on the edge of a generational peak?

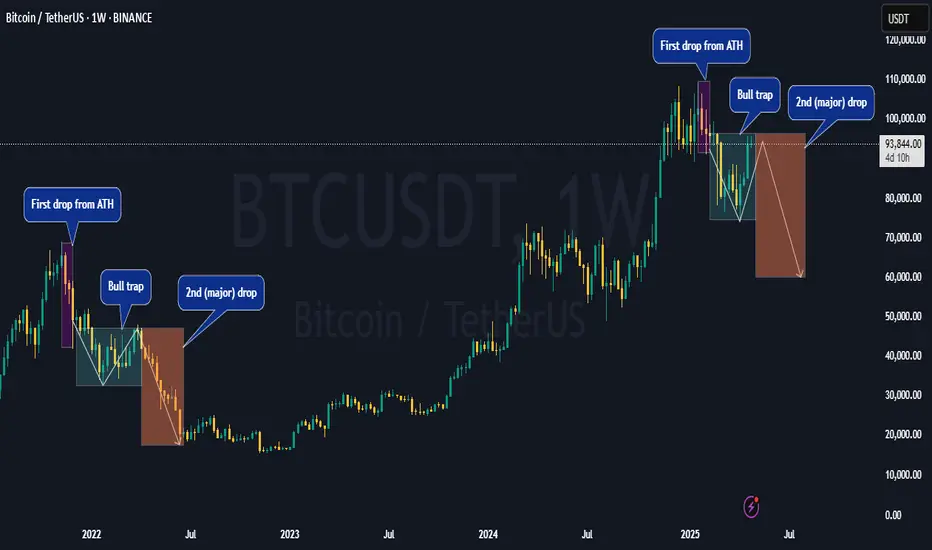
Bitcoin Repeating 2022 Structure? Same Setup, Same Outcome?Bitcoin’s current market structure is starting to mirror its 2022 setup—right before the big drop.
This chart shows a familiar pattern: a rally, a peak, first drop from the ATH, a bull trap… then the major second leg down.
If history repeats, CRYPTOCAP:BTC could be on the verge of another significant move.
Will it break the cycle this time—or follow the same path again?
📉 What do you think?
Share your take in the comments below.
Please support this idea with a LIKE👍 if you find it useful🥳
Happy Trading💰🥳🤗
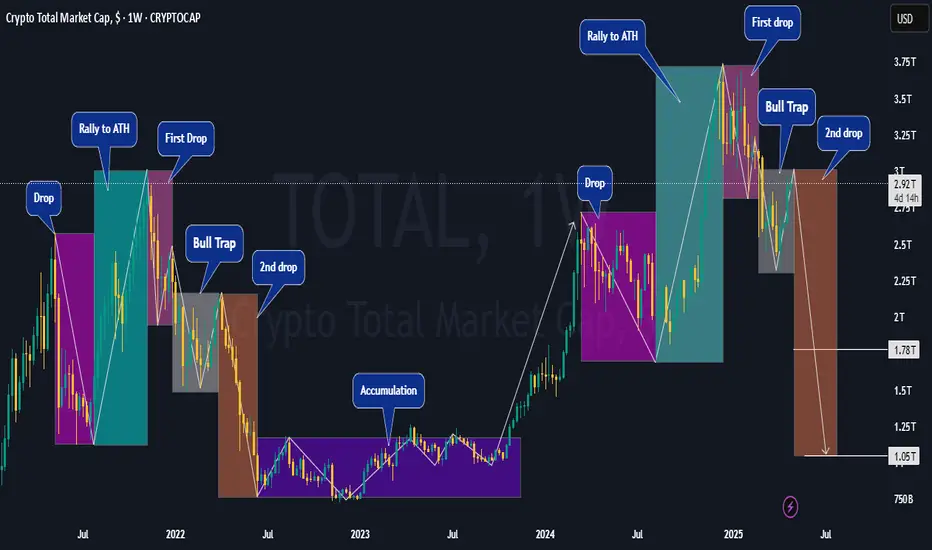
Bull Trap – The Real Drop May Just Be Starting! (Crash Ahead?)The market appears to be gaining bullish momentum, giving the impression that the bear market is over—but what if it’s just getting started?
On this CRYPTOCAP:TOTAL chart, the current price action seems to mirror the 2021–2022 bear market cycle: a rally to new highs, a sharp drop, a deceptive recovery (bull trap), followed by a deeper correction and eventual accumulation.
If this pattern plays out again, we could be in the bull trap phase—right before a significant and unexpected drop.
What do you think?
Will history repeat itself, or are we heading to new highs?
Drop your thoughts in the comments!
Please support this idea with a LIKE👍 if you find it useful🥳
Happy Trading💰🥳🤗
BTC reach his topElliot wave count + Fibonacci time line shows btc gonna enter to a bear market soon
$BTC: We Are in a Bear Market Until Proven Otherwise🚨 CRYPTOCAP:BTC : We Are in a Bear Market Until Proven Otherwise 🚨
📌 Follow-up to my December 2024 post:
🔗
Despite record-breaking bullish news, Bitcoin is not at an all-time high. Why? Because we’re still in a bear market—until the charts say otherwise.
✅ Bullish Factors:
Michael Saylor continues buying billions
President Trump & family pushing crypto/meme coins
Rumors: Fed buying CRYPTOCAP:BTC with gold?
Trump pinned the Bitcoin white paper at the White House
U.S. banks fully onboard with crypto
ETFs accumulating CRYPTOCAP:BTC
National crypto reserve announced
❌ Bearish Signals:
Fear & Greed Index in "extreme fear" for 30+ days
Price is below the EMA50 on weekly
Monthly MACD nearing bearish crossover
Trading volume decreasing
Crypto search interest at multi-year lows
Retails not buying — this is all institutions
Powell confirmed we're in a recession
Desperate whales calling for $5M–$9M BTC to bait retail
🧭 Monthly chart check the MACD:
🔗
⚠️ Key Insight:
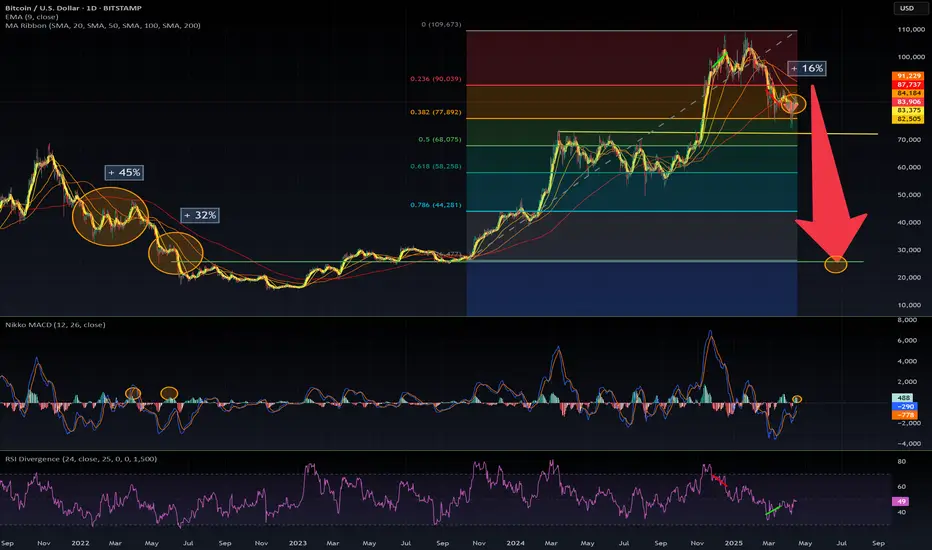
Every cycle, people confuse a relief rally for a new bull run. This isn't new.
A relief rally = short-term price recovery in a bear market.
(AKA a dead cat bounce or sucker rally)
📊 Past relief rallies (check the chart):
+45% (Feb 2022)
+32% (June 2022)
Current one: only +16% — still within bear territory.
📉 Price could hit $91k and still drop lower while staying in an ongoing bear Market..
🧨 Bear Market Target: GETTEX:25K – FWB:27K
📈 Invalidation? Only if we close above $101K
Don’t trade your emotions. Trade the charts. They never lie.
#Bitcoin #CryptoMarket #BTC #BearMarket #CryptoAnalysis #SPX500 #CryptoTrading #Recession2025 #BTCPrice #CryptoCrash #CryptoNews #MichaelSaylor #TrumpCrypto #BTCBearMarket
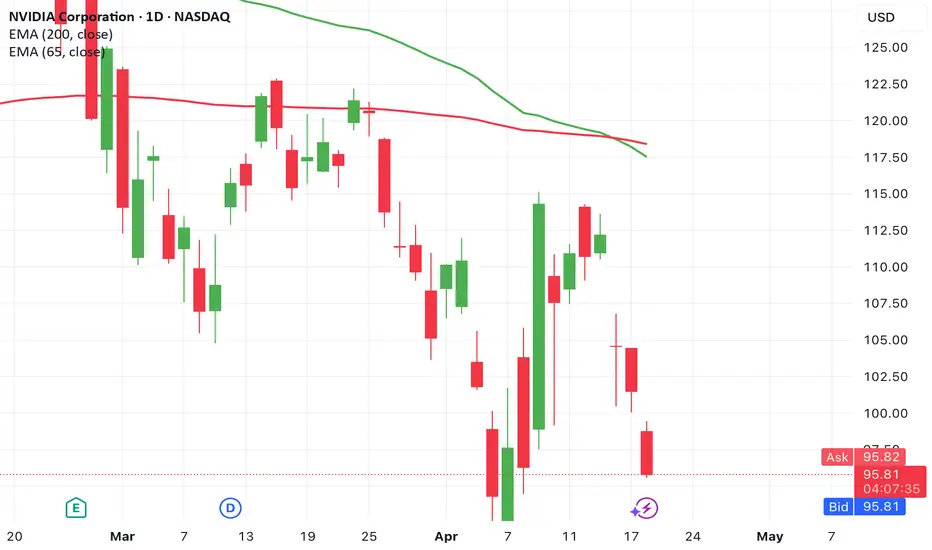
Down Nearly -5.5% The Nvidia Death Cross. Formed and Diverging?!NVIDIA (NVDA) Looks to be showing a formed death cross of the 65 Day and 200 Day Exponential Moving Averages . Price is down almost -5.50% by Midday.
What could happen next?
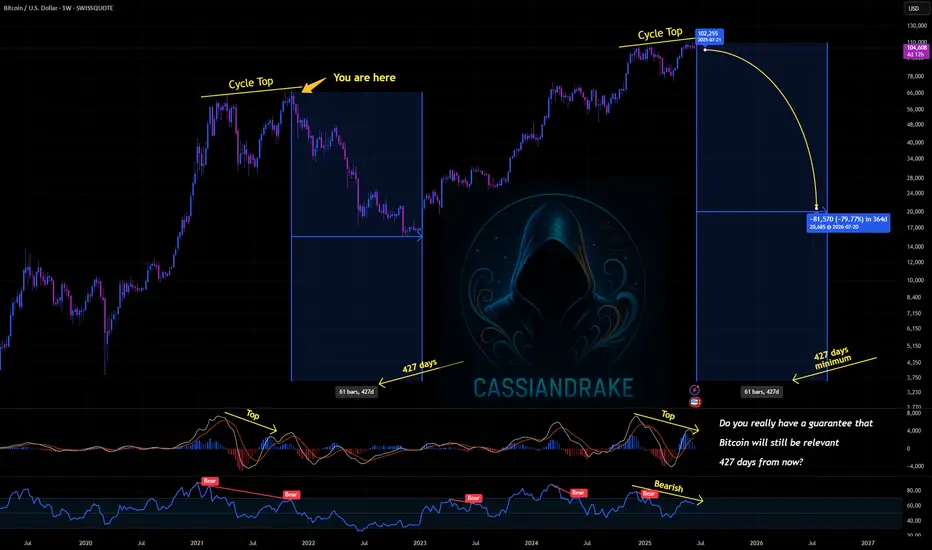
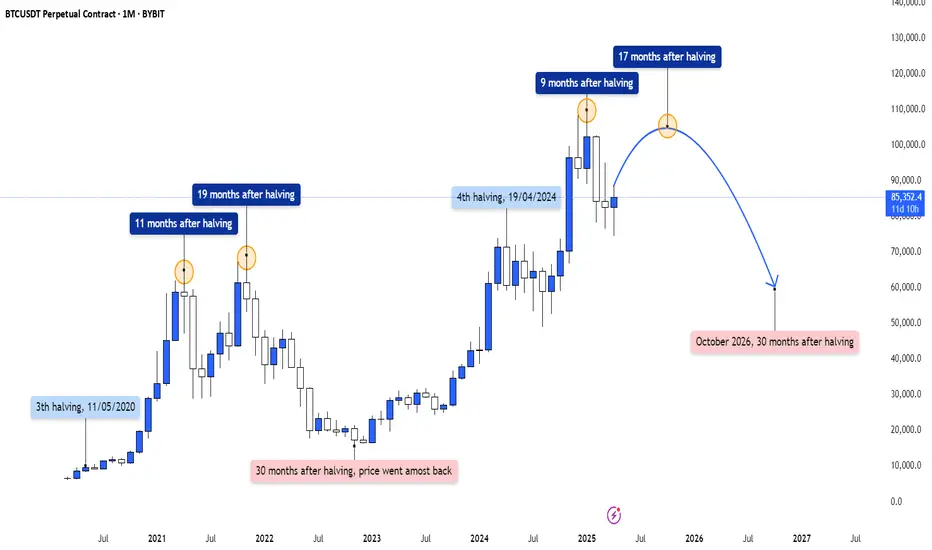
BTC - Halving Cycle | Historical Patterns & 2025-2026 Projection
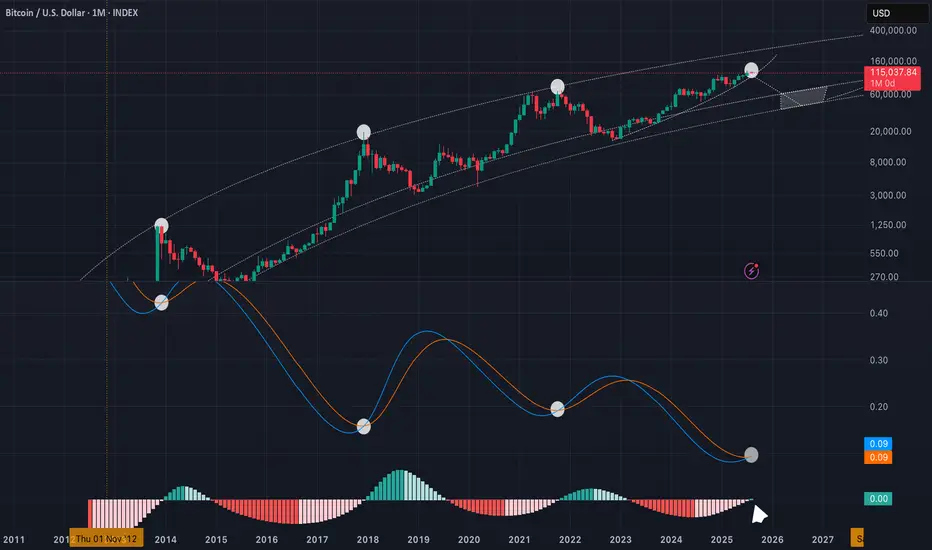
In this chart, we dive deep into the cyclical nature of Bitcoin price action post-halving and draw parallels between past and current movements, with a specific focus on how the market has historically reacted at various intervals following each halving event. This analysis incorporates both structural and temporal elements, providing a potential roadmap based on previous behavior.
---
Historical Context: Previous Cycles
3rd Halving – May 11, 2020
Following the 3rd Bitcoin halving, we observed a parabolic run-up over the next several months:
- 11 months after halving (April 2021): BTC reached a major peak, hitting nearly $65,000.
- This was followed by a significant correction.
- 19 months after halving (December 2021): Bitcoin printed a second top close to the previous all-time high, forming a classic double top pattern. This structure often signals market exhaustion and precedes deeper corrections.
Cycle Completion – Price Reversion
By 30 months after the 3rd halving (around November 2022), BTC had retraced much of its gains and returned to prices nearly equivalent to the halving level (~$8,000–$10,000 zone in log-adjusted terms). This marked the end of the cycle, confirming a full reversion to the mean after the double-top distribution phase.
---
Current Cycle: 4th Halving – April 19, 2024
We're now entering the 4th post-halving cycle , and so far, the structure appears to be rhyming closely with the previous cycle :
- Pre-halving rally took BTC to ~ FWB:73K (March 2024), indicating strong bullish momentum leading into the event.
- If this cycle follows a similar path, we may expect:
- A first major top around 9 months after the halving , potentially at or above $100K.
- A second top forming around 17 months after the halving (projected for September 2025), possibly signaling the beginning of a broader correction phase.
---
Projection: October 2026 (30 Months After Halving)
Using the same temporal framework:
- By October 2026 (30 months post-halving), the chart suggests a return to a much lower level , possibly around $50K.
- This projection mimics the post-double-top decline of the previous cycle, reinforcing the idea of cyclical mean reversion .
- It’s important to note: this isn’t necessarily bearish, but it highlights the cyclical and psychological nature of markets —boom, euphoria, distribution, and reversion.
---
The Macro View: Halving Cycles Are Rhythmic
- Every halving has historically set off a new bull run, but the timing of tops and bottoms is shockingly consistent :
- Peaks often occur 9–18 months post-halving .
- Full cycle completion is around 30 months post-halving.
- These cycles are heavily influenced by supply shocks , market psychology , and macro liquidity cycles .
---
Final Thoughts
This chart isn’t a guarantee—it’s a probability model based on cyclical symmetry. If history repeats or rhymes, we may be witnessing another textbook cycle play out, where a euphoric run in 2025 gives way to a deep correction by late 2026.
Stay alert for the double top pattern and macro divergences. Just as in 2021, timing the exit after the first peak can be the difference between profit and pain .
What do you think? Will Bitcoin follow the same 30-month post-halving trajectory?
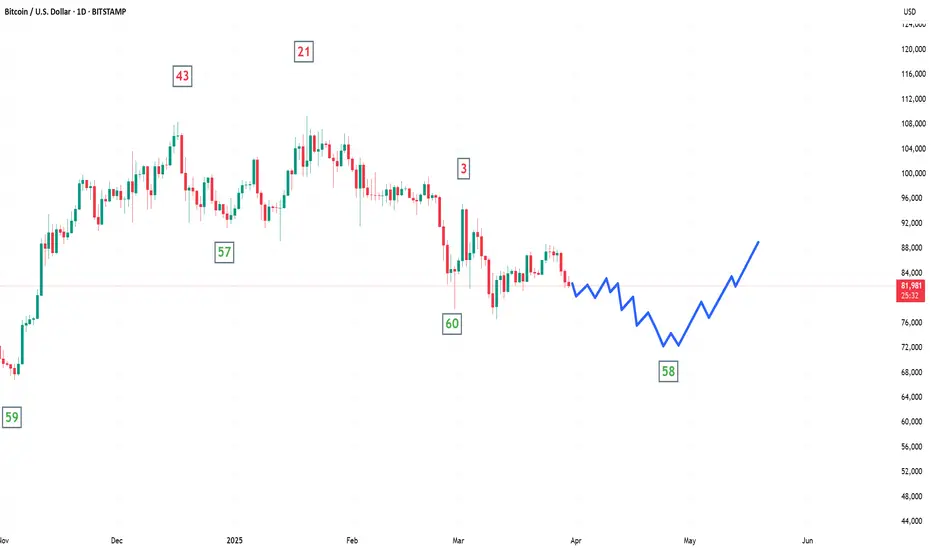
The Road to $100k BitcoinBitcoin is most likely forming a left-translated 60-day cycle .
Expect Bitcoin to trend downward for the next month, making a lower low in this 60-day cycle and fully scaring the market.
People will start screaming “bear market” and panic-sell their coins to market makers, institutions, and patient investors.
Once that’s done, Bitcoin will resume its bull market, heading toward a market top in Q2/Q3 2025.
This would mirror 2021’s bull market behavior, align with the 4-year Bitcoin cycle, and leave enough time for the market to fully reset by late 2026.
$DXY suffers worst day since Nov 10, 2022 – What does it mean?💵 The US Dollar Index just posted its biggest daily drop in nearly 2.5 years, crashing through the 100 level with strong volume. This breakdown signals weakness in the dollar that could have massive implications across all asset classes:
📉 Why it matters:
A weak dollar makes US exports more competitive globally, but also reflects investor fear or policy shifts.
Commodities like gold, oil, and crypto tend to rally when the dollar drops.
Could indicate a pivot in monetary policy, potential rate cuts, or macroeconomic concerns.
🧠 From a technical standpoint, this break of support could trigger further downside. The last time this happened, we saw a significant shift in risk appetite.
📊 What to watch:
Upcoming Fed statements
Inflation & jobs data
Reaction in equities and crypto
👇 Is this the start of a larger trend, or just an overreaction?
Let’s discuss!
#DXY #USD #DollarIndex #Forex #Macro #MarketUpdate #Commodities #Gold #Crypto #TradingView

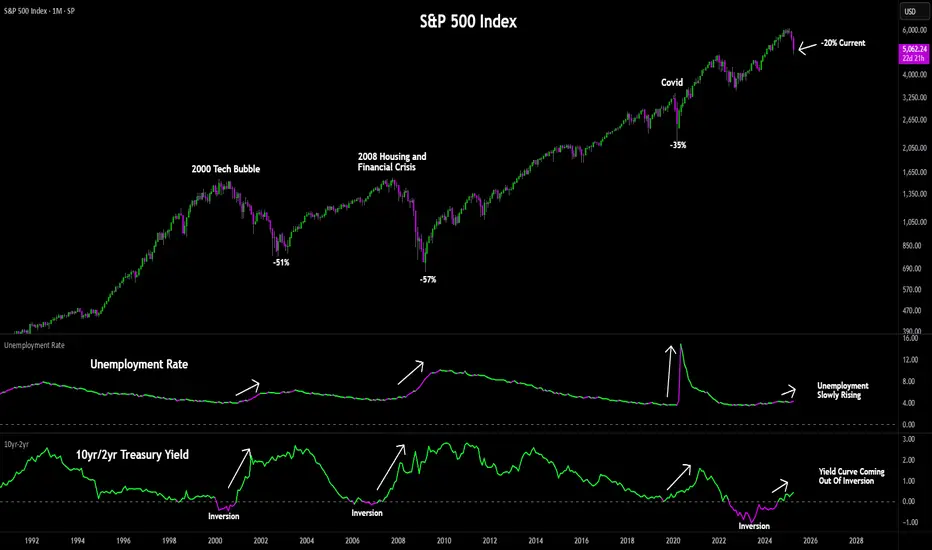
S&P500 vs Unemployment vs Yield CurveI'd be surprised if that was the bottom in equities. 10yr/2yr is still coming out of inversion which historically is followed by a recession and a decline in equities, and we have unemployment remaining stubbornly low with only one direction to go from current levels. Market selloffs usually mean investors lose money while main street loses jobs so we should start to see the unemployment rate begin to rise from here assuming that the tariff war isn't over.
Trump proved today that he has no intention of relenting on the new tariffs; when China retaliated with 34% tariffs on US goods, he immediately hit them with 50% tariffs. Not sure which side will cave first, but as long as there is uncertainty around US/China trade the risk for further declines in equities remains.
The previous two times the yield curve inverted, we saw 50%+ declines in equities and rising unemployment when the curve came out of inversion. There was also a short-lived inversion in 2019 with a spike in unemployment and falling equity prices due to Covid, but the Federal Reserve lowering interest rates to 0% and printing trillions of dollars kept that bear market short and sweet.
We currently have a Federal Reserve that needs higher rates to fight inflation while at the same time we have a president who wants lower rates to stimulate growth. Catch-22 for the Fed: if they lower rates, they risk reigniting inflation. If they raise rates or keep them flat during a market decline it will speed up the decline in equities. Trump knows this which is why I don't think that the tariff war and market decline are over.