XAUUSD: Demand Rejection or Breakdown? All Eyes on 3,300 ZoneChart Analysis Breakdown (30m TF – Gold/USD)
1. Market Structure Overview
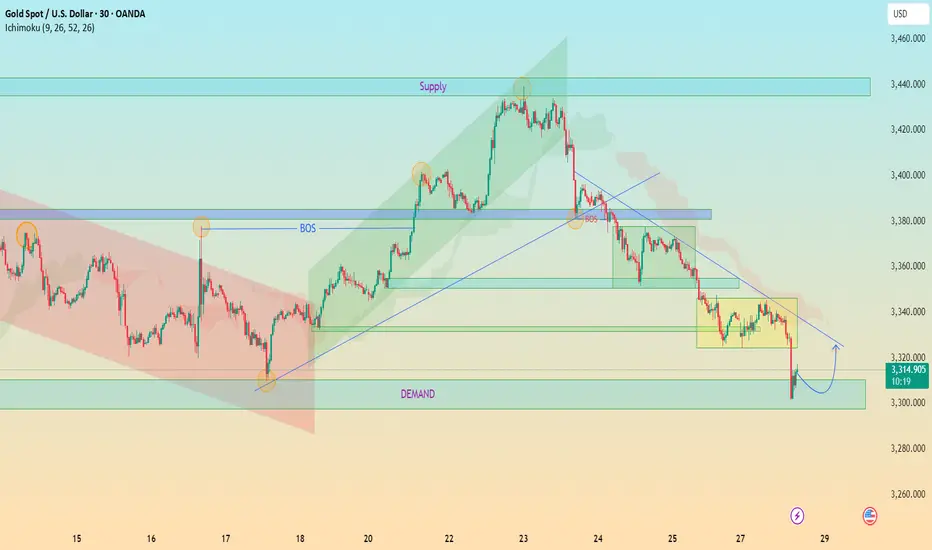
Bearish Trend Dominance:
The price has shifted into a bearish structure after a Break of Structure (BOS) to the downside, indicating bearish control after failing to sustain higher highs.
Lower Highs & Lower Lows:
A consistent formation of LHs and LLs confirms bearish momentum.
2. Key Zones & Reactions
🟩 Demand Zone (~3,300–3,310):
Current price is reacting from a clearly defined demand zone.
Strong buying wick indicates interest and potential short-term bounce.
This zone has historical significance — previous reversal point.
🟥 Supply Zone (~3,420–3,445):
Price reversed sharply from here.
This is a key liquidity zone; expect heavy resistance if price retraces.
🔵 BOS Areas Marked:
Confirmed transitions in structure:
Bullish BOS followed by a bearish BOS — great illustration of shift in control.
🟨 Consolidation Blocks:
Highlighted ranging periods show distribution/accumulation phases before breakouts.
3. Trendlines & Channel Patterns
📉 Descending Trendline:
Acts as dynamic resistance.
If price retraces to this level (around 3,330–3,340), expect potential rejection unless broken cleanly.
📈 Previous Bullish Channel (Broken):
Price moved out of a bullish ascending channel, confirming bearish intent.
4. Ichimoku Cloud Context
Price is below the Kumo cloud, suggesting bearish bias remains intact.
Future cloud is bearish.
However, short-term pullback into cloud possible (especially if demand zone holds).
📊 Forecast & Trade Idea
Scenario 1: Bullish Rejection from Demand
Price may bounce towards 3,340 (previous S/R + trendline retest).
Watch for reaction at this level.
Scenario 2: Clean Break of Demand Zone
Opens path toward deeper downside (e.g., 3,280 or even lower).
Could trigger liquidity grab before reversal.