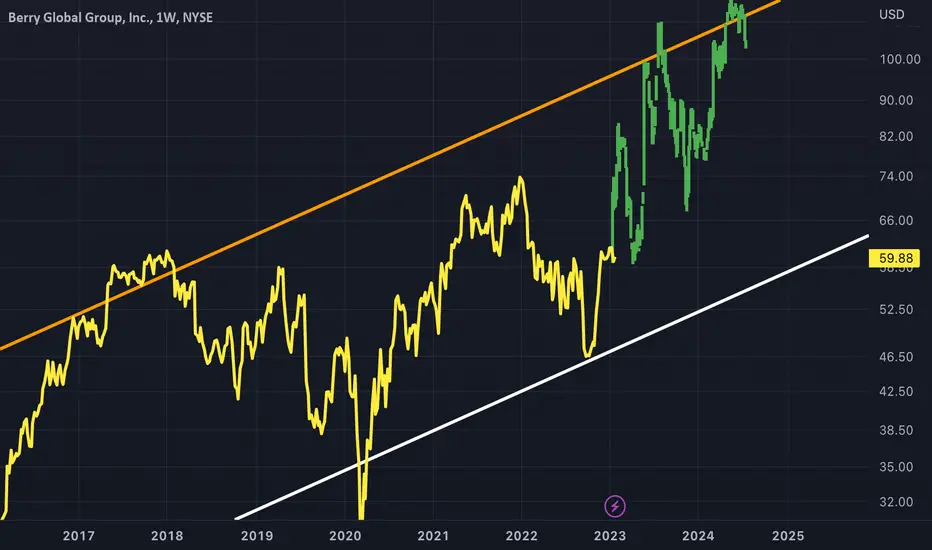
BERY - Right SideBERY is yet to show right side symmetry recovery on price
I have tried to show my thought process with the green bars pattern
This symmetry is assumed due to the double bottom along the dominant white trend line
Bullish on Weekly timeframe
BERY
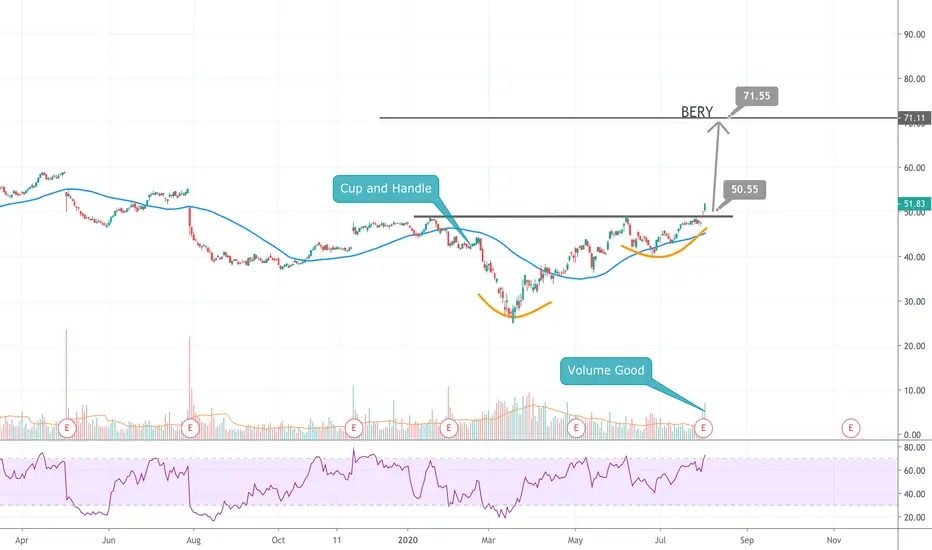
BERY BUY OR LONG , TARGET UP TO $70BERY confirmed the "Cup and Handle" pattern at $50, now the volume is quite good for further growth.
- Price is being supported on the MA200 (uptrend).
BERY buy : $51 +-0.5
BERY target : 70 +-2
Stop loss : 8%
Wish you good deals!
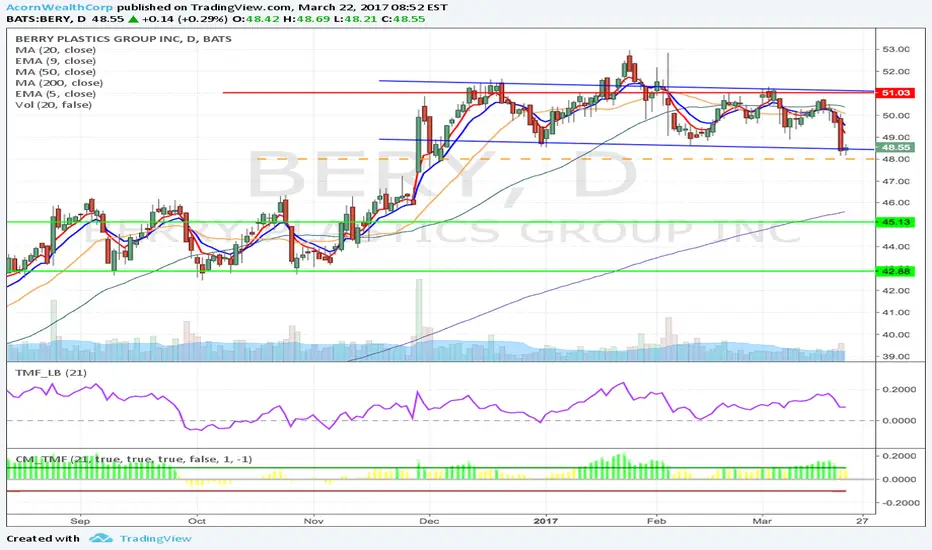
BERY - Possible H&S formation short from $48 to $42.88BERY seems forming a head & shoulder formation. A break of $48 will be the breakout confirmation.
We think it can decline down to $43 area.
* Trade Criteria *
Date first found- March 21, 2017
Pattern/Why- Possible head & shoulder formation
Entry Target Criteria- $48
Exit Target Criteria- Target 1 45.13 Target 2 42.88
Stop Loss Criteria- $51.03
Please check back for Trade updates. (Note: Trade update is little delayed here.)