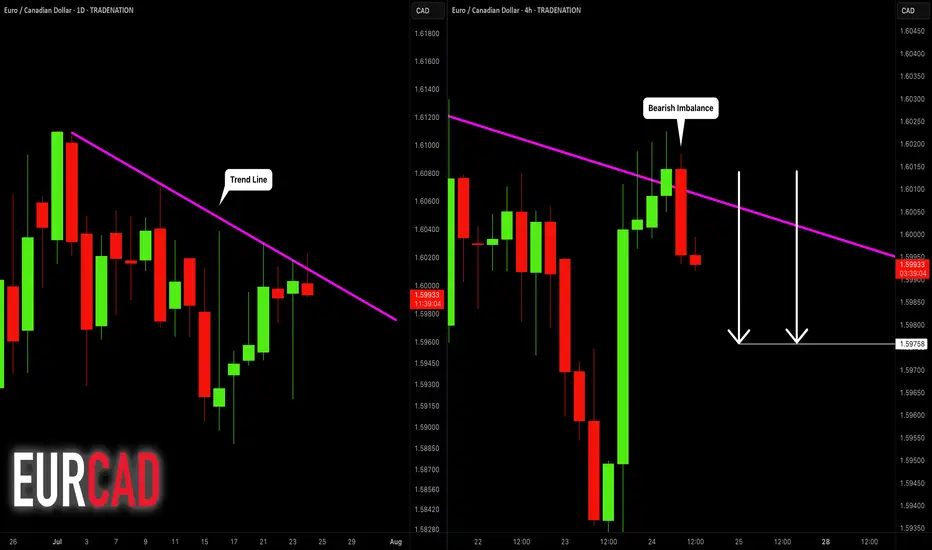
EURCAD: Bearish After the News 🇪🇺🇨🇦
EURCAD may drop from a solid daily resistance.
As a confirmation signal, I spotted a bearish engulfing candle
on a 4H time frame after its test.
The formation of this candle is accompanied by multiple negative
German fundamentals.
Goal - 1.5976
❤️Please, support my work with like, thank you!❤️
I am part of Trade Nation's Influencer program and receive a monthly fee for using their TradingView charts in my analysis.
Bestforexsignalstelegram
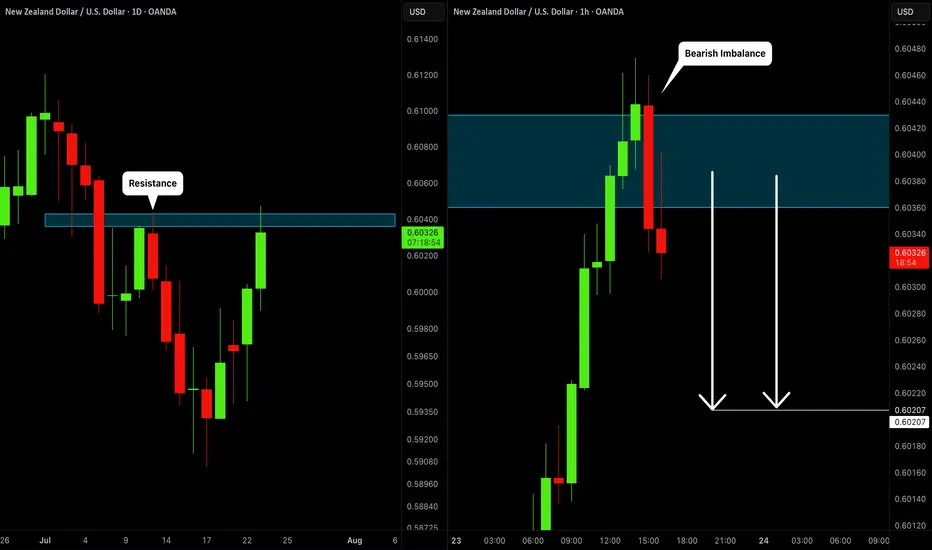
NZDUSD: Time For Pullback 🇳🇿🇺🇸
I think that NZDUSD will retrace from the underlined resistance.
As a confirmation, I spotted a bearish imbalance candle on an hourly time frame
after its test.
There is a high chance to see a retracement.
Goal - 0.602
❤️Please, support my work with like, thank you!❤️
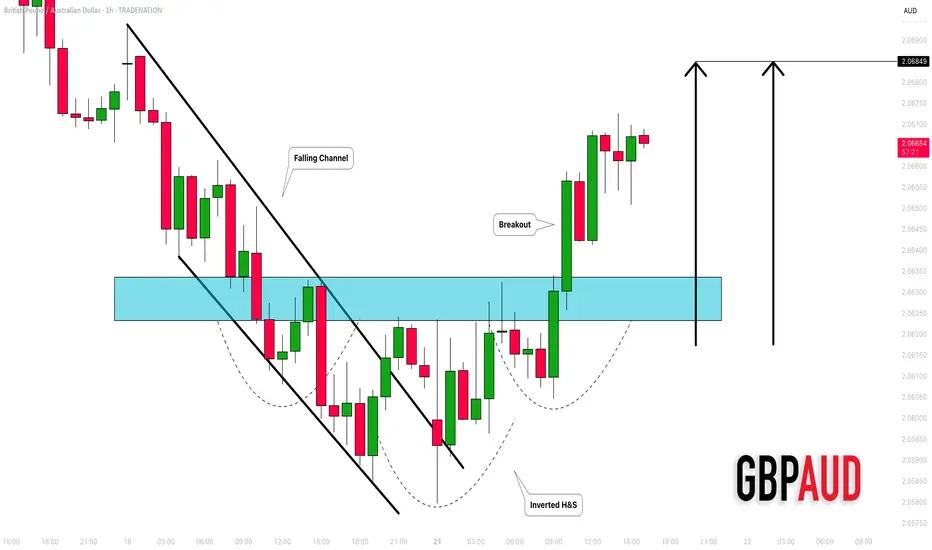
GBPAUD: Bullish Movement Continues 🇬🇧🇦🇺
GBPAUD is going to rise more, following a confirmed intraday bullish reversal:
first, the price violated a resistance line of a falling channel.
It started to consolidate within an inverted head & shoulders pattern then.
Its neckline violation is another strong bullish signal.
Next resistance - 2.0685
❤️Please, support my work with like, thank you!❤️
I am part of Trade Nation's Influencer program and receive a monthly fee for using their TradingView charts in my analysis.
EURUSD: Support & Resistance Analysis For Next Week 🇪🇺🇺🇸
Here is my latest structure analysis and important supports/resistances
for EURUSD for next week.
Consider these structures for pullback/breakout trading.
❤️Please, support my work with like, thank you!❤️
I am part of Trade Nation's Influencer program and receive a monthly fee for using their TradingView charts in my analysis.
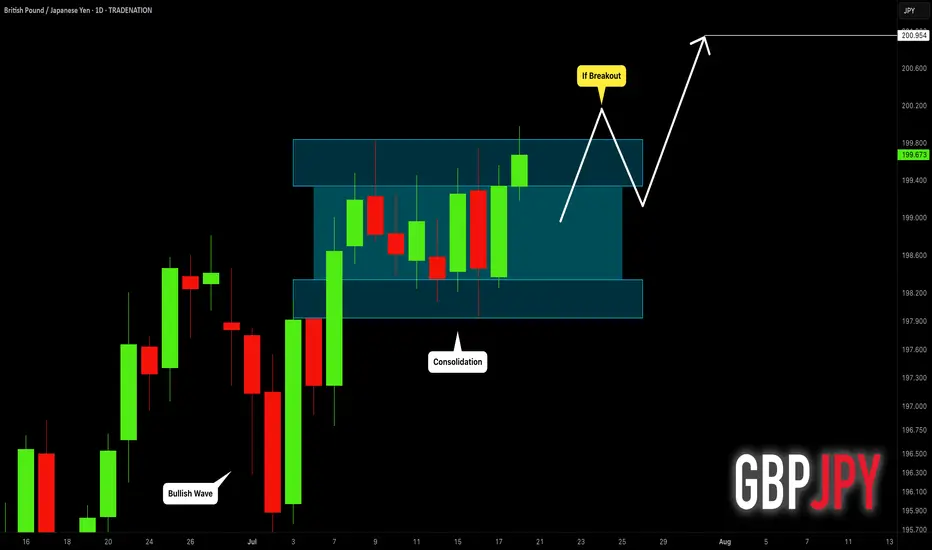
GBPJPY: Get Ready to Buy 🇬🇧🇯🇵
GBPJPY is consolidating within a narrow horizontal range
on a daily time frame.
I am waiting for its bullish breakout and a daily candle close above
199.85 to confirm the next bullish wave.
A rise will be expected to 201 level then.
❤️Please, support my work with like, thank you!❤️
I am part of Trade Nation's Influencer program and receive a monthly fee for using their TradingView charts in my analysis.
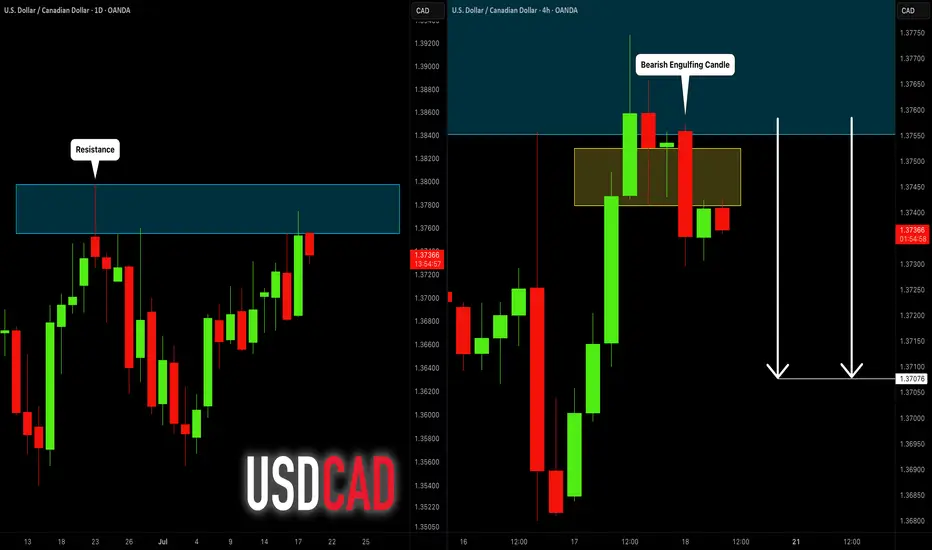
USDCAD: Bearish Move From Resistance 🇺🇸🇨🇦
USDCAD is going to retrace from a key daily resistance.
A bearish imbalance candle that the price formed after its test
during the Asian session provides a strong intraday bearish confirmation.
Goal - 1.3707
❤️Please, support my work with like, thank you!❤️
I am part of Trade Nation's Influencer program and receive a monthly fee for using their TradingView charts in my analysis.
GBPAUD: Pullback From Resistance 🇬🇧🇦🇺
I think that GBPAUD may pull back from a key intraday resistance.
As a confirmation, I see a bearish engulfing candle after its test
on an hourly time frame.
Goal - 2.0655
❤️Please, support my work with like, thank you!❤️
I am part of Trade Nation's Influencer program and receive a monthly fee for using their TradingView charts in my analysis.

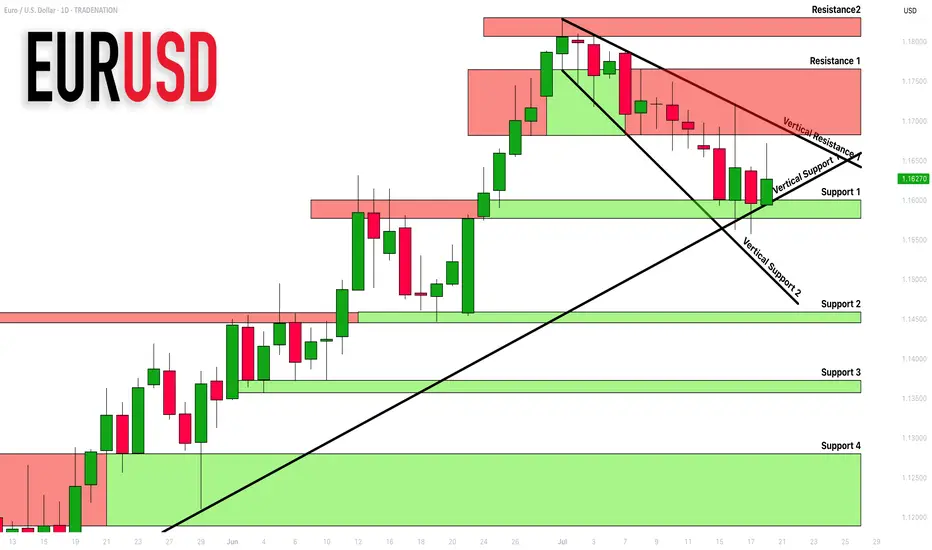
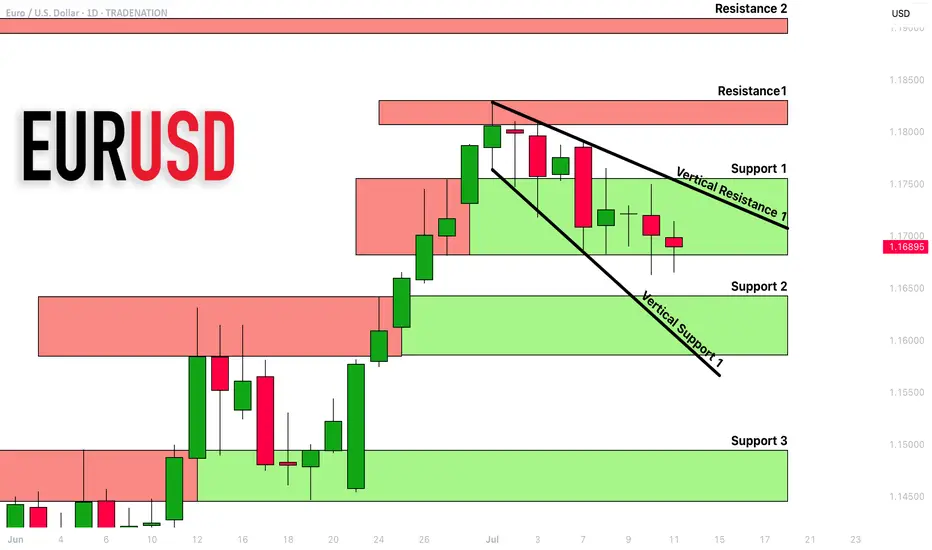
EURUSD: Support & Resistance Analysis 🇪🇺🇺🇸
Here is my fresh support & resistance analysis for EURUSD.
Vertical Structures
Vertical Support 1: Rising trend line
Vertical Support 2: Falling trend line
Vertical Resistance 1: Falling trend line
Horizontal Structures
Support 1: 1.1577 - 1.1600 area
Support 2: 1.1445 - 1.1458 area
Support 3: 1.1356 - 1.1373 area
Support 4: 1.1190 - 1.1280 area
Resistance 1: 1.1682 - 1.1766 area
Resistance 2: 1.1807 - 1.1830 area
Consider these structures for pullback/breakout trading.
❤️Please, support my work with like, thank you!❤️
I am part of Trade Nation's Influencer program and receive a monthly fee for using their TradingView charts in my analysis.

MarketBreakdown | EURAUD, GBPJPY, WTI CRUDE OIL, SILVER
Here are the updates & outlook for multiple instruments in my watch list.
1️⃣ #EURAUD daily time frame 🇪🇺🇦🇺
The market is trading in a bullish trend.
The price is steadily growing within a rising parallel channel.
A recent test of its support triggered a strong bullish reaction.
I think that a rise may continue at least to a current high - 1.8035
2️⃣ #GBPJPY daily time frame 🇬🇧🇯🇵
The market is consolidating within a narrow horizontal
parallel channel.
Consider consolidation, trading within its boundaries.
The next bullish wave will be confirmed with a breakout and a
daily candle close above its resistance.
3️⃣ CRUDE OIL #WTI daily time frame 🛢️
The market remains weak and consolidation continues.
I see a wide horizontal range where the price is now stuck.
I think that we may see a pullback from its support.
4️⃣ #SILVER #XAGUSD daily time frame 🪙
The market is retracing after a formation of a new higher high.
I see a strong demand zone ahead: it is based on a rising trend line
and a recently broken horizontal resistance.
The next trend following movement will most likely initiate from there.
Do you agree with my market breakdown?
❤️Please, support my work with like, thank you!❤️
I am part of Trade Nation's Influencer program and receive a monthly fee for using their TradingView charts in my analysis.

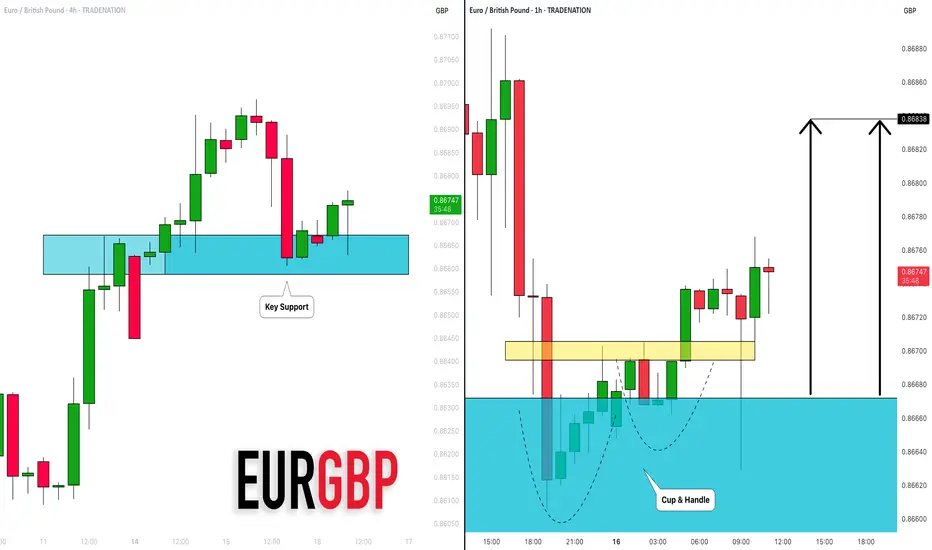
EURGBP: Bullish Move From Support Confirmed?! 🇪🇺🇬🇧
There is a high chance that EURGBP will bounce
from a key intraday horizontal support cluster.
The market looks bullish after UK CPI release this morning.
Goal - 0.8684
❤️Please, support my work with like, thank you!❤️
I am part of Trade Nation's Influencer program and receive a monthly fee for using their TradingView charts in my analysis.
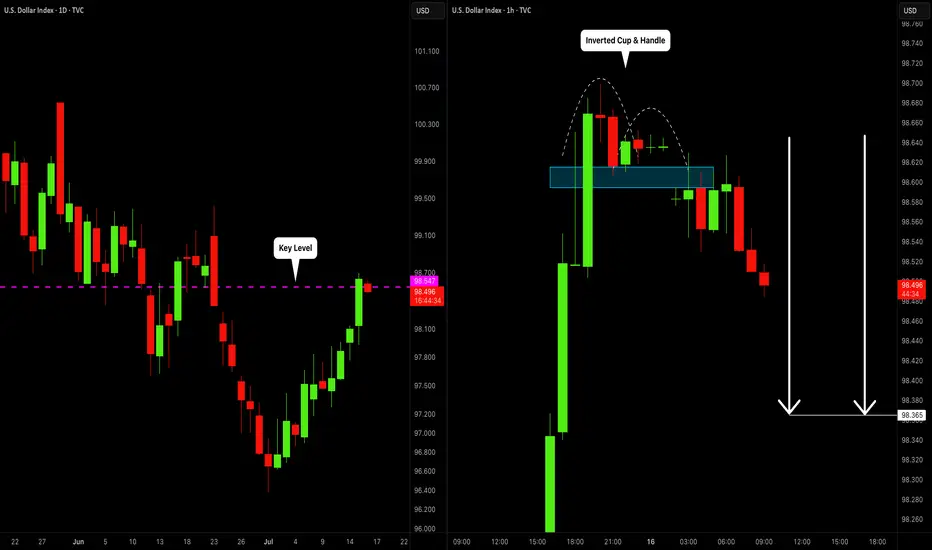
DOLLAR INDEX (DXY): Bearish Move From Key Level
I think that Dollar Index may drop from a key daily horizontal resistance level.
As a confirmation, I spotted an inverted cup & handle pattern on an hourly time frame
and a bearish violation of its neckline.
The market will most likely continue falling at least to 98.36
❤️Please, support my work with like, thank you!❤️
MarketBreakdown | GBPAUD, WTI CRUDE OIL, US30, US100
Here are the updates & outlook for multiple instruments in my watch list.
1️⃣ #GBPAUD daily time frame 🇬🇧🇦🇺
The market is trading within a wide horizontal parallel channel.
The price is stuck on its support.
Probabilities will be high that the market will start growing from that.
Alternatively, its bearish breakout will provide a strong bearish signal.
2️⃣ #WTI CRUDE OIL daily time frame 🛢️
The price is now testing a significant rising trend line.
It is a critical decision moment for the market.
A bearish breakout of that may trigger a strong bearish continuation.
Monitor intraday price action today. If you see a strong bullish pattern,
it will provide a reliable confirmation to buy,
3️⃣ DOW JONES INDEX #US30 daily time frame
The market started a correction movement in
a bullish flag pattern.
Your next signal to buy will be a breakout of its resistance
and a daily candle close above that.
4️⃣ NASDAQ INDEX #US100 daily time frame
The market is now breaking a resistance of a horizontal parallel channel.
IF a today's daily candle closes above that, it will confirm a start of
another bullish wave.
The market will continue growing then.
Do you agree with my market breakdown?
❤️Please, support my work with like, thank you!❤️
I am part of Trade Nation's Influencer program and receive a monthly fee for using their TradingView charts in my analysis.

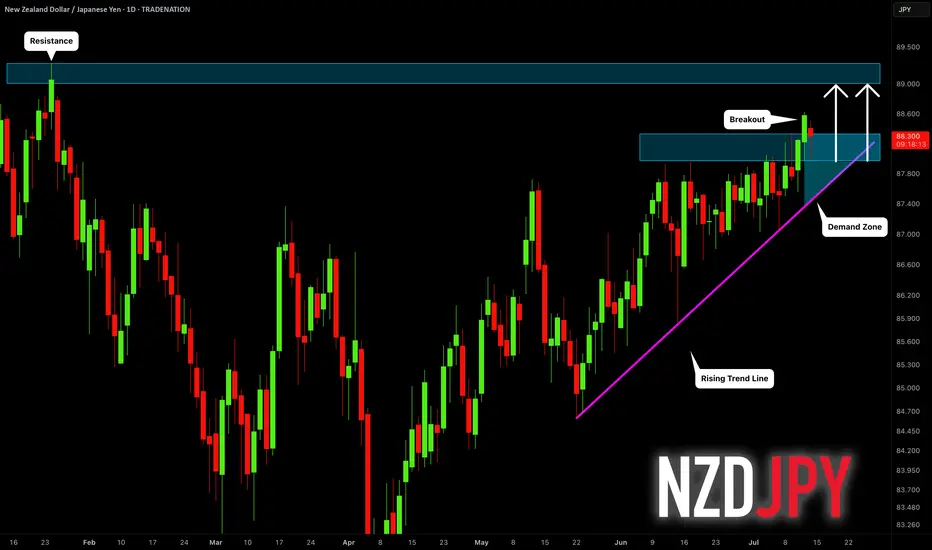
NZDJPY: Another Bullish Wave Ahead?! 🇳🇿🇯🇵
NZDJPY violated a significant daily resistance cluster last week.
The broken structure and a rising trend line compose a
contracting demand zone now.
That will be the area from where I will anticipate a bullish movement.
Next resistance - 89.0
❤️Please, support my work with like, thank you!❤️
I am part of Trade Nation's Influencer program and receive a monthly fee for using their TradingView charts in my analysis.
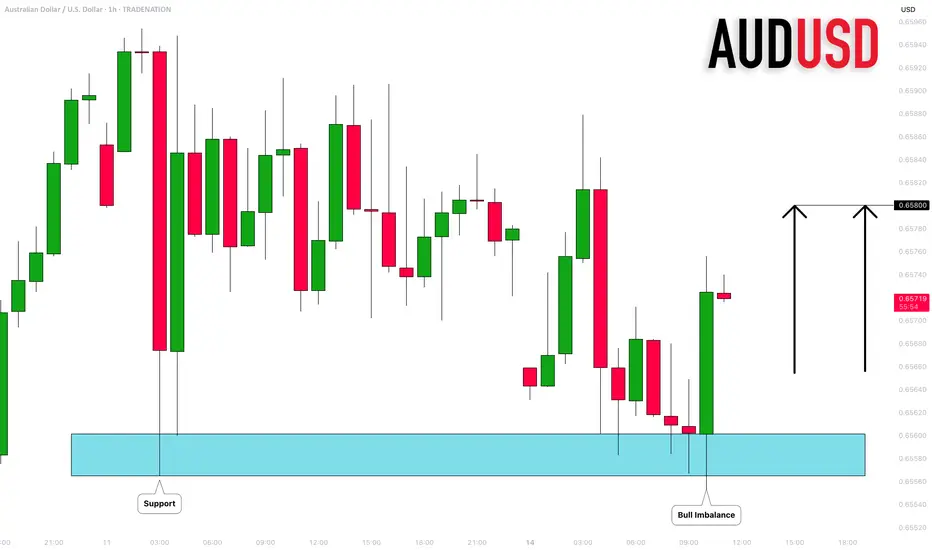
AUDUSD: Pullback From Support 🇦🇺🇺🇸
There is a high chance to see a pullback from the underlined
key horizontal support on AUDUSD.
As a confirmation, I see a bullish imbalance candle on an hourly time frame.
Goal - 0.658
❤️Please, support my work with like, thank you!❤️
I am part of Trade Nation's Influencer program and receive a monthly fee for using their TradingView charts in my analysis.
EURUSD: Detailed Support & Resistance Analysis 🇪🇺🇺🇸
Here is my latest structure analysis and important
supports and resistances for EURUSD for next week.
Consider these structures for pullback/breakout trading.
❤️Please, support my work with like, thank you!❤️
I am part of Trade Nation's Influencer program and receive a monthly fee for using their TradingView charts in my analysis.
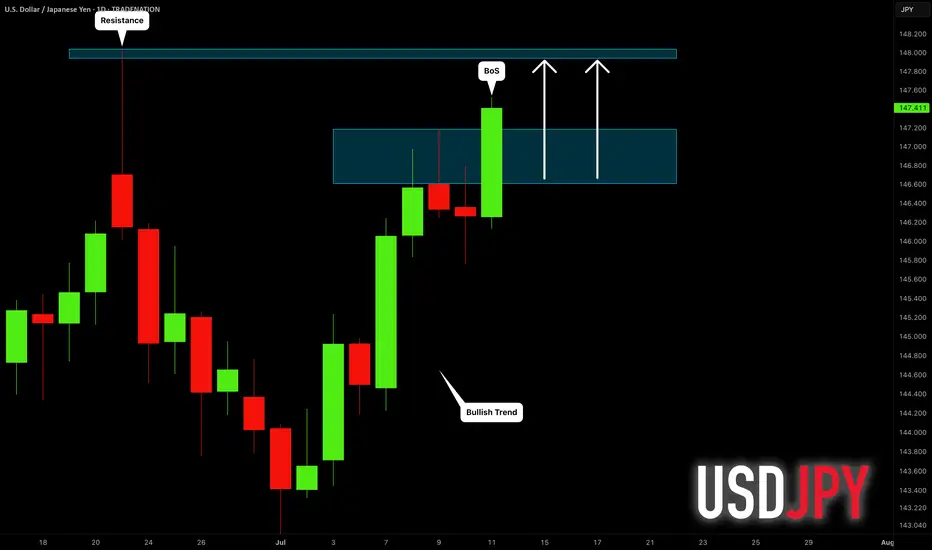
USDJPY: More Growth Ahead! 🇺🇸🇯🇵
USDJPY broke and closed above a minor daily resistance
with a confirmed BoS.
The next strong resistance is 148.0
It is going to be the next goal for bulls.
❤️Please, support my work with like, thank you!❤️
I am part of Trade Nation's Influencer program and receive a monthly fee for using their TradingView charts in my analysis.
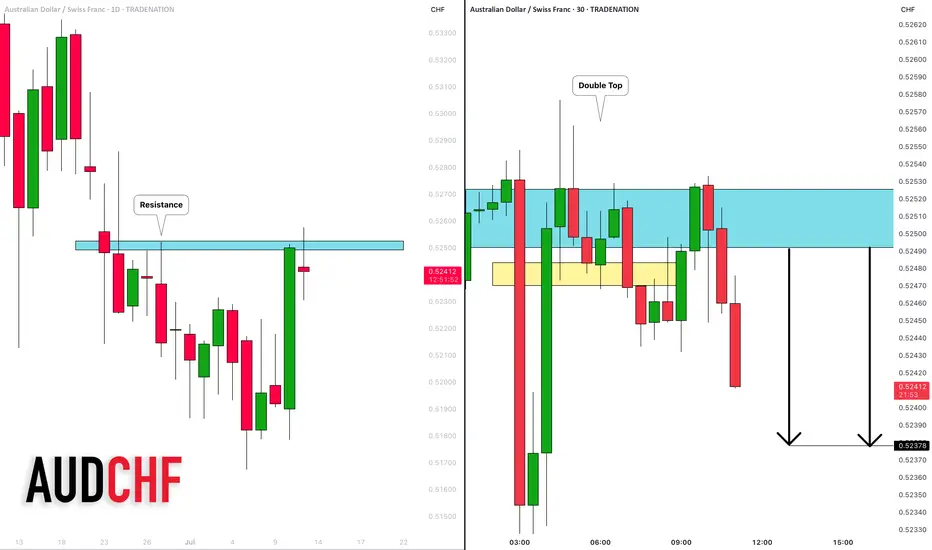
AUDCHF: Pullback From Resistance 🇦🇺🇨🇭
AUDCHF is going to retrace from a key daily resistance.
As a confirmation, I spotted a double top pattern on 30 minutes time frame
and a very bearish reaction after CHF fundamental news releases an hour ago.
Goal - 0.5238
❤️Please, support my work with like, thank you!❤️
I am part of Trade Nation's Influencer program and receive a monthly fee for using their TradingView charts in my analysis.
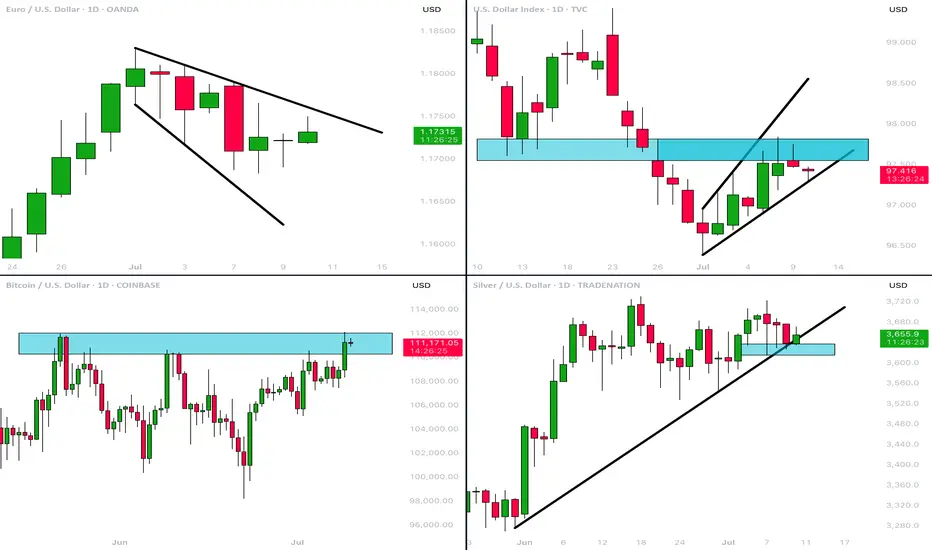
MarketBreakdown | EURUSD, DOLLAR INDEX, BITCOIN, SILVER
Here are the updates & outlook for multiple instruments in my watch list.
1️⃣ #EURUSD daily time frame 🇪🇺🇺🇸
The price started a correctional movement after it updated
a high the first of July.
The market formed a bullish flag pattern.
Your next trend-following bullish signal will be a breakout and a daily
candle close above its resistance.
2️⃣ Dollar Index #DXY daily time frame 💵
The market corrects in a bearish flag pattern.
I see a test of a significant horizontal resistance cluster now.
Your signal to see will be a bearish violation of a support
of the flag and a daily candle close below.
3️⃣ #BITCOIN #BTCUSD daily time frame
Though the price managed to update the All-Time High
yesterday, the market did not manage to close above
a current major resistance.
I believe that we will see another attempt of the market to breakthrough.
Your bullish confirmation will be a daily candle close above the underlined resistance.
4️⃣ #SILVER #XAGUSD daily time frame 🪙
The price reached an important confluence demand zone
based on a rising trend line and a horizontal key structures support.
Probabilities will be high to see a bullish movement from that.
Do you agree with my market breakdown?
❤️Please, support my work with like, thank you!❤️
I am part of Trade Nation's Influencer program and receive a monthly fee for using their TradingView charts in my analysis.
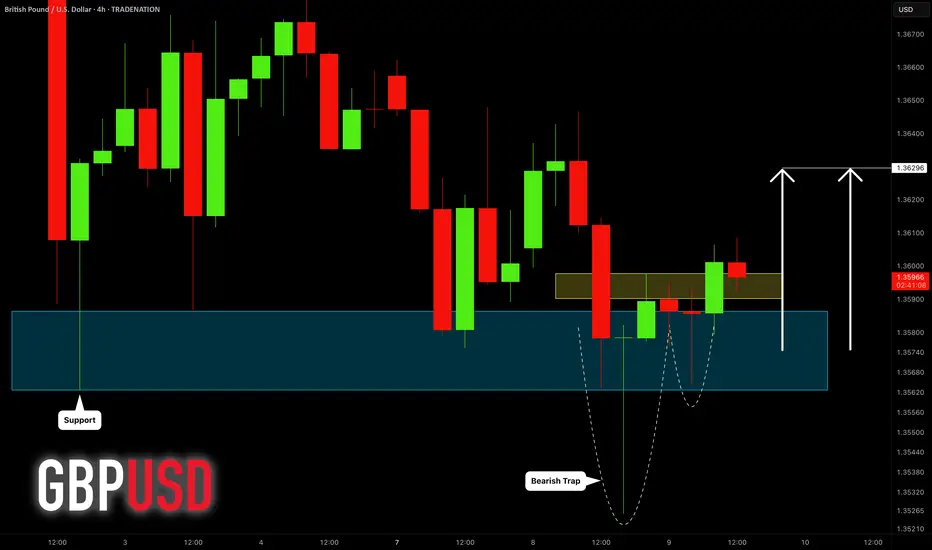
GBPUSD: Bullish Move After Liquidity Grab 🇬🇧🇺🇸
GBPUSD formed a bullish high range candle with a long lower wick going
below a key horizontal demand zone on a 4H.
A consequent recovery and a bullish London session opening suggest
a highly probable rise today.
Goal - 1.363
❤️Please, support my work with like, thank you!❤️
I am part of Trade Nation's Influencer program and receive a monthly fee for using their TradingView charts in my analysis.
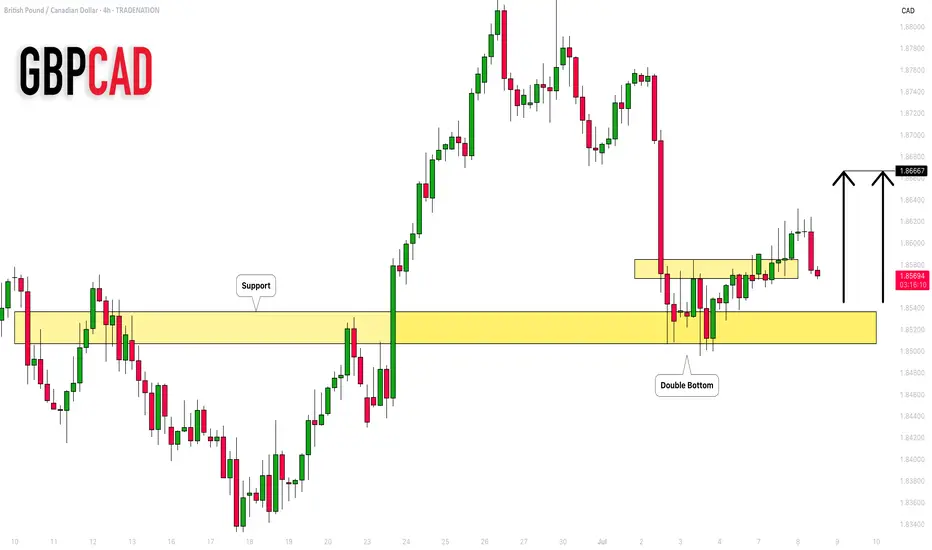
GBPCAD: Bullish Continuation Ahead?! 🇬🇧🇨🇦
One of the pairs that we discussed on the today's live stream
is GBPCAD.
The price nicely respected a key daily/intraday horizontal support.
A double bottom pattern on that and a bullish violation of its neckline
provide strong bullish confirmations.
I expect up move to 1.8666
❤️Please, support my work with like, thank you!❤️
I am part of Trade Nation's Influencer program and receive a monthly fee for using their TradingView charts in my analysis.
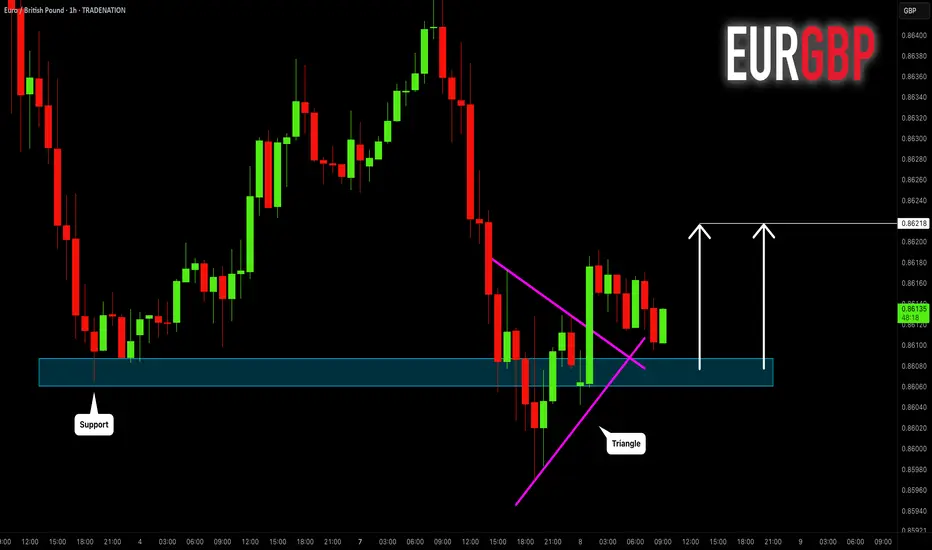
EURGBP: Bullish Move After False Breakout 🇪🇺🇬🇧
EURGBP will likely go up from a key daily/intraday support,
following a bullish breakout of a resistance line
of a bullish triangle on an hourly time frame.
The price may go up to 0.86218 level then.
❤️Please, support my work with like, thank you!❤️
I am part of Trade Nation's Influencer program and receive a monthly fee for using their TradingView charts in my analysis.
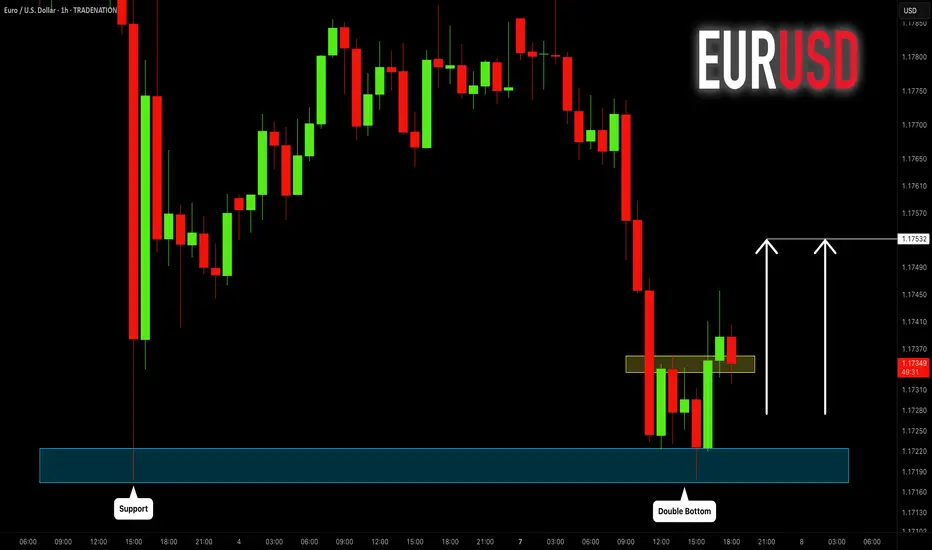
EURUSD: Another Pullback Trade for Today 🇪🇺🇺🇸
EURUSD formed a double bottom pattern on a key daily horizontal support.
Its neckline violation signifies a local strength of the buyers.
I think that the pair may move up and reach 1.1753 level.
❤️Please, support my work with like, thank you!❤️
I am part of Trade Nation's Influencer program and receive a monthly fee for using their TradingView charts in my analysis.
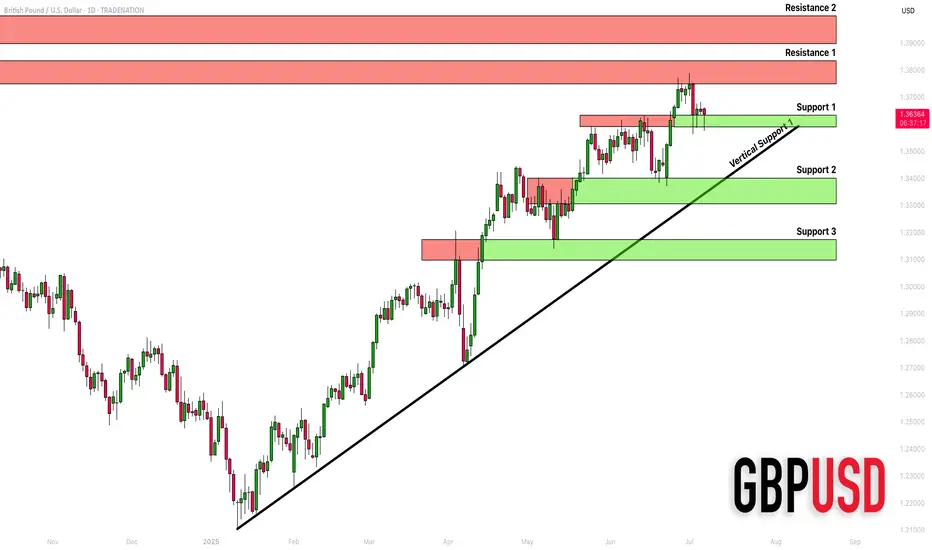
GBPUSD: Detailed Support & Resistance Analysis 🇬🇧🇺🇸
Here is my structure analysis for GBPUSD.
Horizontal Structures
Support 1: 1.3588 - 1.3633 area
Support 2: 1.3305 - 1.3400 area
Support 3: 1.3097 - 1.3175 area
Resistance 1: 1.3748 - 1.3835 area
Resistance 2: 1.3900 - 1.3400 area
Vertical Structures
Vertical Support 1: rising trend line
Consider these structures for pullback/breakout trading.
❤️Please, support my work with like, thank you!❤️
I am part of Trade Nation's Influencer program and receive a monthly fee for using their TradingView charts in my analysis.