104This channel is not providing individualized trading or investment advice, nor is it a banking service, brokerage service, trading service, investment service or money management service
Beyond Technical Analysis

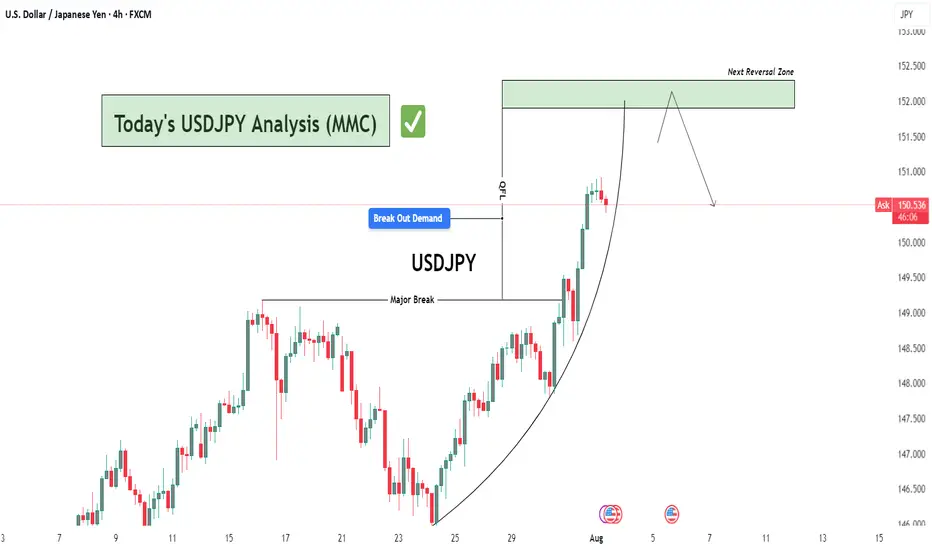
USDJPY Analysis : Key Reversal Zone After Parabolic Rally🧠 Market Psychology & Structure
The USDJPY 4-hour chart reveals a classic parabolic curve pattern signifying an acceleration phase in bullish momentum. This phase typically occurs during the final stages of a bullish move, where price action becomes increasingly steep due to aggressive buyer participation.
The rounded curve drawn on the chart reflects momentum compression—where pullbacks become shallower, and higher highs are formed rapidly. However, this pattern often ends in a blow-off top or a sharp correction, especially when approaching key supply zones.
🧩 Key Technical Highlights
Major Break Zone: The previous resistance around 148.80–149.00 (now flipped to support) was clearly broken with strong bullish candles, confirming trend continuation.
Break Out Demand : Price retested the breakout zone (around 149.80–150.00) before launching higher, validating this level as a new demand zone.
Current Price Action: The pair is currently hovering around 150.50 after a powerful rally, showing early signs of exhaustion with smaller bullish candles and slight upper wicks.
🔍 Target Area – Next Reversal Zone (151.80–152.30)
The green highlighted zone marks a strong supply area / reversal zone, identified from:
Previous price rejections in historical data.
Overbought conditions due to vertical rally.
Completion of the parabolic structure (climax zone).
We can expect price to reach this zone in the coming sessions, where it may:
Face strong selling pressure.
Trigger short positions from institutional sellers.
Lead to distribution or reversal back toward the demand area near 150.00.
🔄 Forecast & Trade Plan
Scenario 1 (High Probability): Price taps into 151.80–152.30, forms bearish engulfing or rejection wick, then pulls back to 150.00 or lower.
Scenario 2 (Invalidation): Strong breakout above 152.30 with momentum—bullish continuation towards 153.00+ possible.
🧠 Trader’s Mindset (MMC Insight)
This chart suggests a matured bullish trend nearing exhaustion. As smart traders, we anticipate rather than react. Wait for the price to reach the supply zone, then observe for confirmation (bearish structure, divergence, candlestick pattern) before shorting.
Avoid chasing longs at these highs—risk-to-reward is no longer favorable. Patience will offer a much cleaner entry if the reversal unfolds as expected.
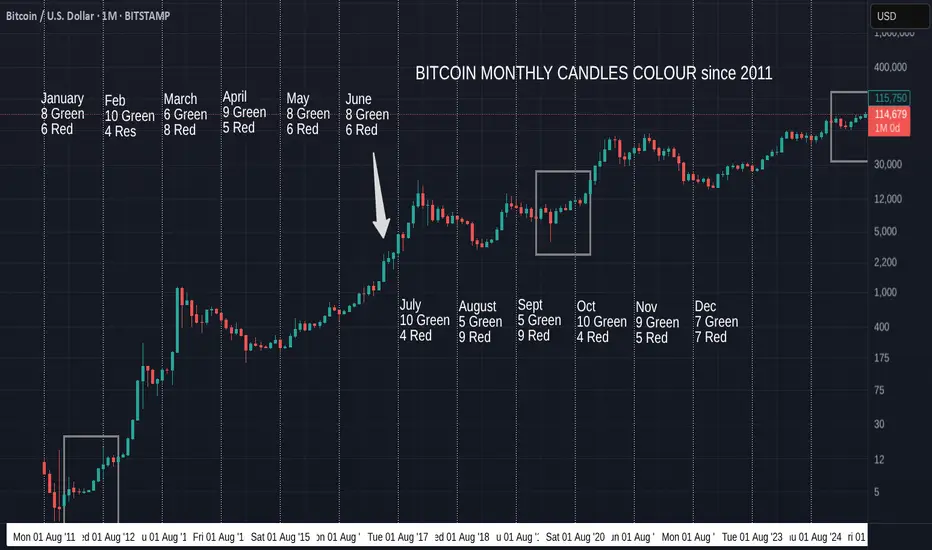
Bitcoin Monthly Candle Colour patterns and Colours since 2011
We got the expected GREEN July and so, amazingly, we continue to repeat the pattern from January to July 2012. ( Left Box )
It is almost the same pattern as 2020, apart from the Red May candle in that Year. (Right box)
The Large Arrow points towards another occasion where we had a series of consecutive Green candles from March to July, though these candles sizes are nothing like the ones we are currently experiencing.
The Boxes show us The only 2 occasions where we have had a Green December, Red January, Red February, Green March, Green April.
Then we had a Green May 2012 and a Red May 2020
Then both repeated a Green June, Green July.
The thing to note here is how all these are en-route to Cycle Highs.
So, August count currently is 5 Green to 9 Red, so the Odds are, while looking at BTC History, that we will get a RED August
HOWEVER, if we continue this run of following previous patterns, we will see a GREEN August.
In fact, 3 of those 5 Green August closes were in these 3 patterns mentioned.
Every single one of the 5 Green previous August followed a Green July, the last time was in 2021.
As mentioned in last months report, the size of the candles currently in this pattern are more like those in 2020 than the other 2 patterns talked about here.
With this in mind, we may expect a smaller Green candle close for August , Followed by a small Red candle in September. This did also happen in 2017 ( Arrow).
This August has opened Red but so far this year, many month opens were red and then changed.
So, My expectation id for a small Green August as markets cool off over the holidays and we wait for the start of Q4 in October.
We will have to wait and see as ever
Stay safe
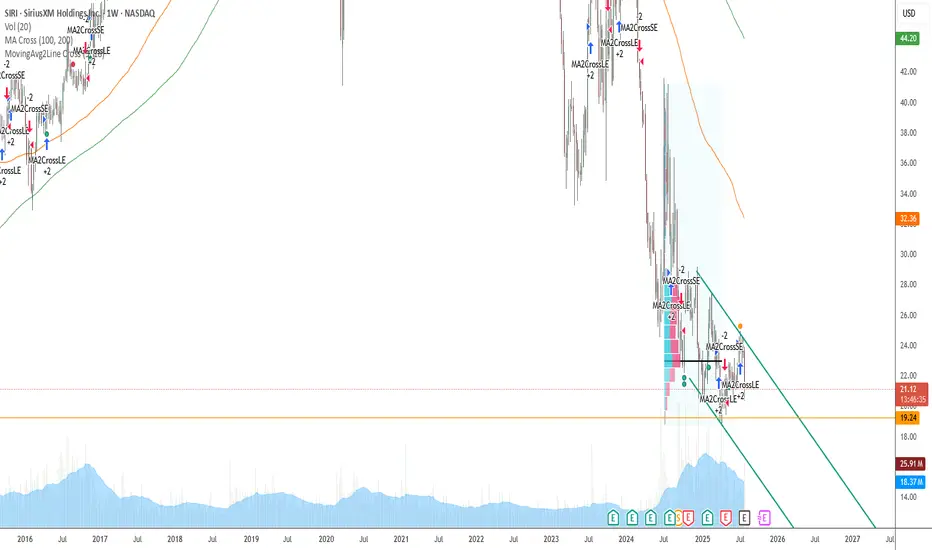
SIRI on the way down , correction begunThis stock is have a consistent Berkshire position and looks good to buy on a dip...
#USDPJPY BUY#USDJPY currently facing this rejection on the Daily.
Our Expectation; we expect price to a lower level after this week’s rally, gather momentum and break this ceiling. From here, we will have a free run 🏃 to 154 and money will be made. Wait for our next sniper to swing signal next @tspsignals

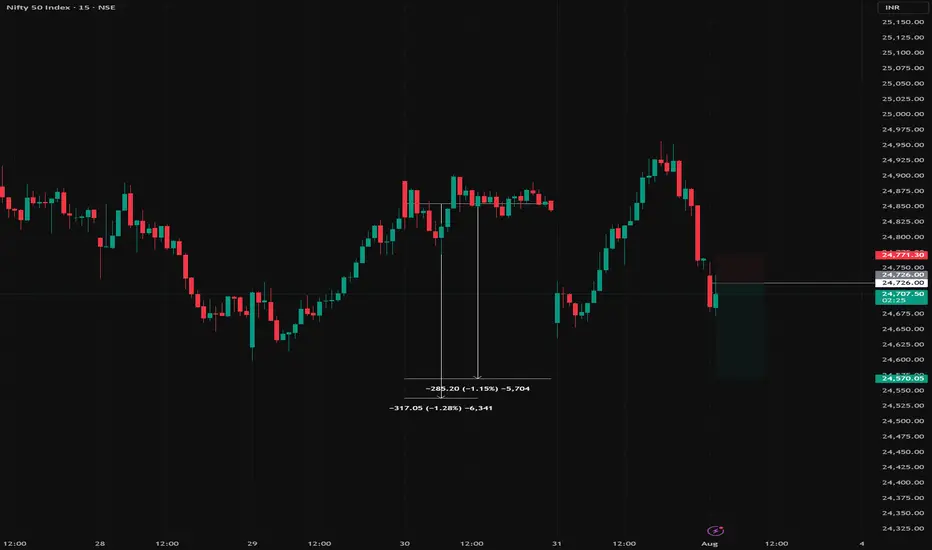
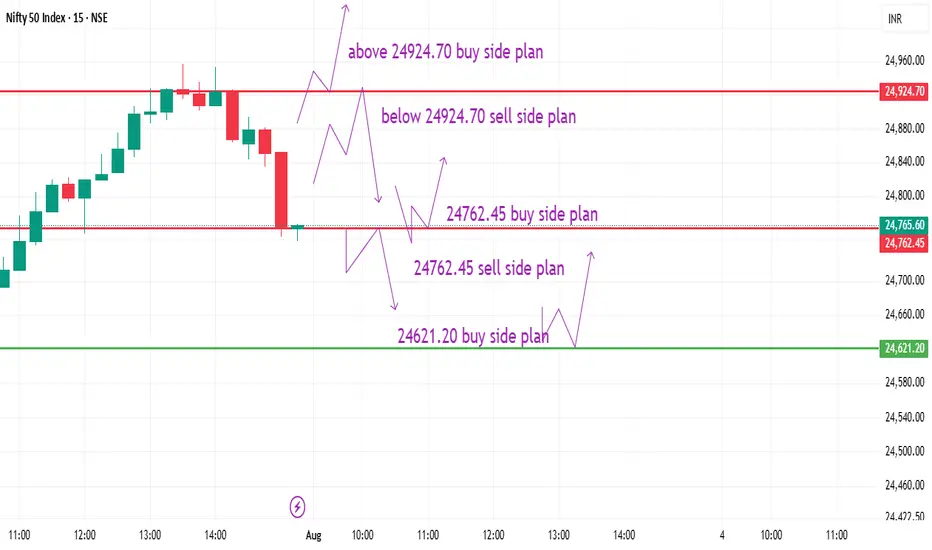
nifty 01/08/2025I am not SEBI Registered analyst. this is for education purpose only. this is only my view. please do own research before innate a trade or making investment plan. technical analysis are probability only.

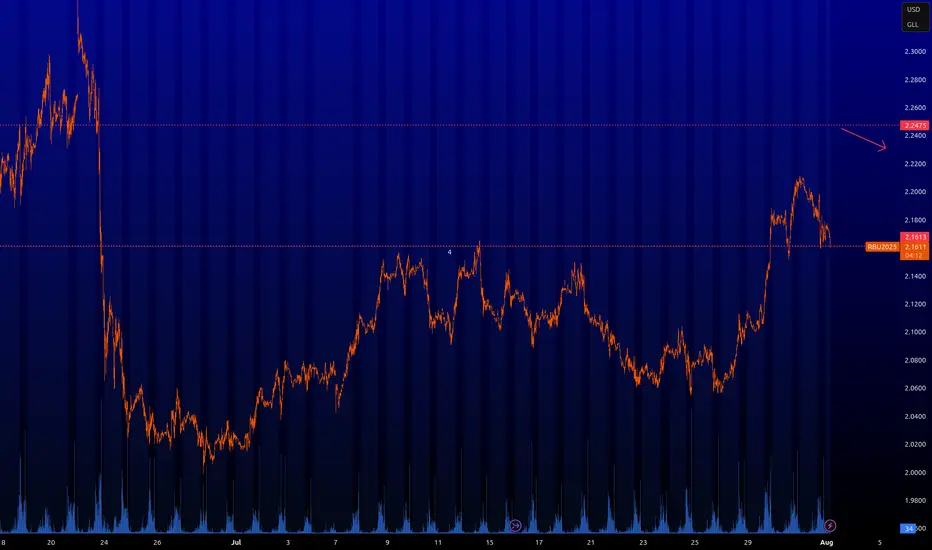
RBOB : Key levelsHere are the key levels that the market will be interested in. We can scalp from 2.2475. I have never traded this instrument, I do not know the specifics, but the level will be interesting. We can expect a bounce from it. I am more interested if it becomes inactive.
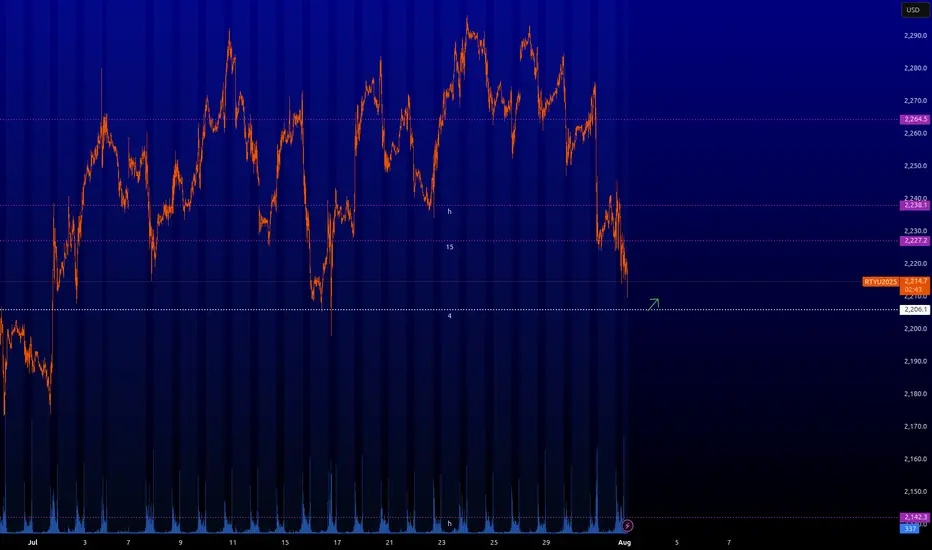
RTY : Key levelsHere are the key levels that the market will be interested in. From ~2.206 you can take scalping longs. Also interesting longing levels are forming now. I will let you know when they are formed and when they will be in play.
⚠️ VOLATILITY WARNING ⚠️
Trading around major news can be extremely unpredictable. Trade responsibly!
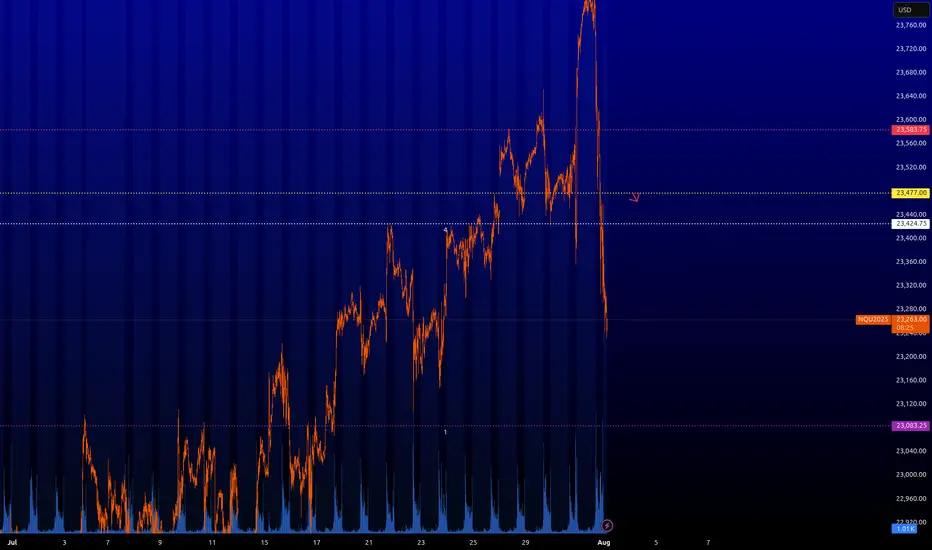
NQ : Key levelsHere are the key levels that the market will be interested in. From the yellow level ~23.477 you can already look for shorting trades. However, I would be careful with shorts on US indices. The other levels are still risky for limit order trading.
⚠️ VOLATILITY WARNING ⚠️
Trading around major news can be extremely unpredictable. Trade responsibly!
XAUUSD: Correction in Progress, Patience is Key for the Success GOLD (XAUUSD) -Monthly Analysis & Trading Plan (Aug 2025)
Title: XAUUSD: Correction in Progress, Patience is Key for the Next Move
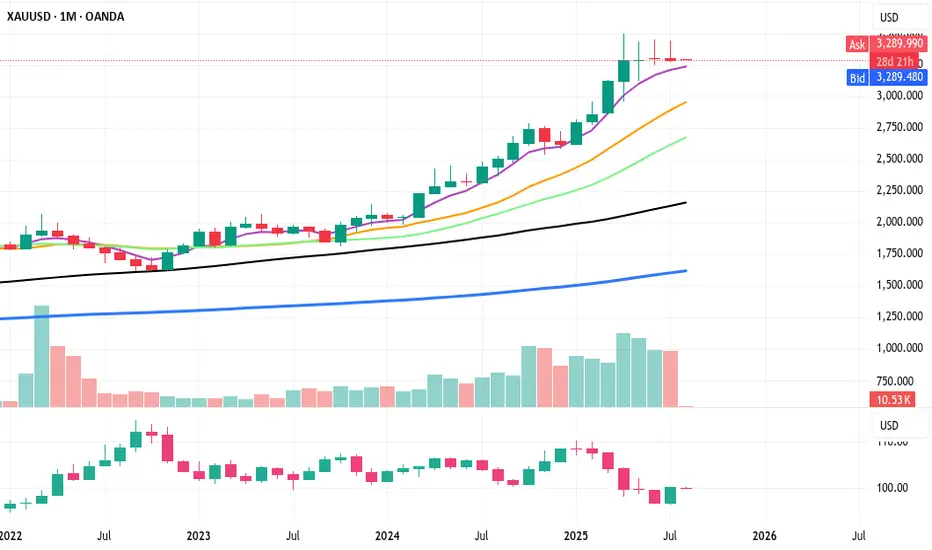
**Chart:** XAUUSD Monthly (1M)
**Analysis Type:** ICT/SMC, Price Action, & Moving Average
Summary:
After a historic and powerful bull run that saw Gold (XAUUSD) breach all-time highs in the first half of 2025, the market has entered a significant corrective phase. The massive red candle in June signaled a strong reversal of momentum, and the current July candle confirms that sellers remain in control, albeit with less intensity. This is a critical juncture for long-term traders, and a strategic approach is required.
**Key Observations & Analysis:**
1. **Price Action & Market Structure:** The move from late 2024 through May 2025 was a textbook "impulsive leg." The sharp reversal in June 2025, with a powerful bearish candle, likely acted as a **liquidity grab** or a **high-volume distribution event**, trapping late buyers. The market is now in a clear **break in market structure (BOS)** to the downside on this long-term timeframe, suggesting the correction is not over.
2. **ICT/SMC Concepts:**
* **Imbalance/Fair Value Gap (FVG):** The rapid bullish move created significant imbalances on the monthly chart. Price often returns to fill these gaps. The current correction is likely heading to fill or test these inefficiencies.
* **Order Block (OB):** The massive bullish move in late 2024/early 2025 likely created a strong bullish order block. The current sell-off is heading toward this potential institutional demand zone.
* **Liquidity:** The lows from late 2024 and early 2025 will be key liquidity pools. Smart money will likely be targeting these areas for a potential reversal or accumulation.
3. **Moving Average Analysis (MMA):**
* The price is currently trading above both the purple and yellow moving averages, which are still pointing upward. This confirms the long-term trend remains bullish, and the current move is a correction within that trend.
* The **purple moving average** is a key support level to watch. A test of this level would be a high-probability event, and its reaction will be crucial for the next major move.
**Suggested Entry & Exit Levels:**
**1. Aggressive Entry (Short):**
* **Rationale:** The bearish momentum, though slowing, is still the dominant force. An aggressive trader could look for a continuation of the short-term bearish trend.
* **Entry:** A short entry could be considered on a pullback to the recent highs around **$3,400 - $3,500** if a strong bearish candlestick pattern forms on a lower timeframe (e.g., weekly or daily).
* **Stop Loss:** A tight stop-loss placed just above the recent high, for example, **$3,600**. This is a high-risk entry, so position sizing should be small.
* **Target:** The first major target would be the **moving average support level**, roughly in the **$3,000 - $3,100** zone. The ultimate target for a full correction would be the order block from late 2024, around **$2,800**.
**2. Conservative Entry (Long):**
* **Rationale:** The long-term trend is still bullish. The current move is a correction. The most prudent approach is to wait for a high-probability long entry at a key support level.
* **Entry:** Wait for price to reach the **purple moving average support zone (around $3,000 - $3,100)**. Look for a clear reversal signal on this level, such as a large bullish "pin bar" or "engulfing candle" on the monthly or weekly chart. This would be a high-probability demand zone for a reversal.
* **Stop Loss:** A stop-loss should be placed below this key support level, perhaps around **$2,850 - $2,900**, giving the trade room to breathe.
* **Target:** The first target for a new bullish leg would be the recent swing high around **$3,800**. The ultimate long-term target would be a new all-time high above **$4,000**.
Conclusion
The Gold market is in a crucial phase. The bullish party from earlier in 2025 is over for now, and a healthy correction is underway. **The most logical and safe approach is to wait for the market to complete its corrective move.** Do not attempt to catch a falling knife. Instead, be patient and wait for price to reach a key institutional demand zone (our moving average support or the late 2024 order block) and show a clear sign of reversal. This will present a high-probability, low-risk long entry for the next impulsive move up.
Disclaimer
This is not financial advice. Please perform your own due diligence and risk management. Trading involves a significant risk of loss.
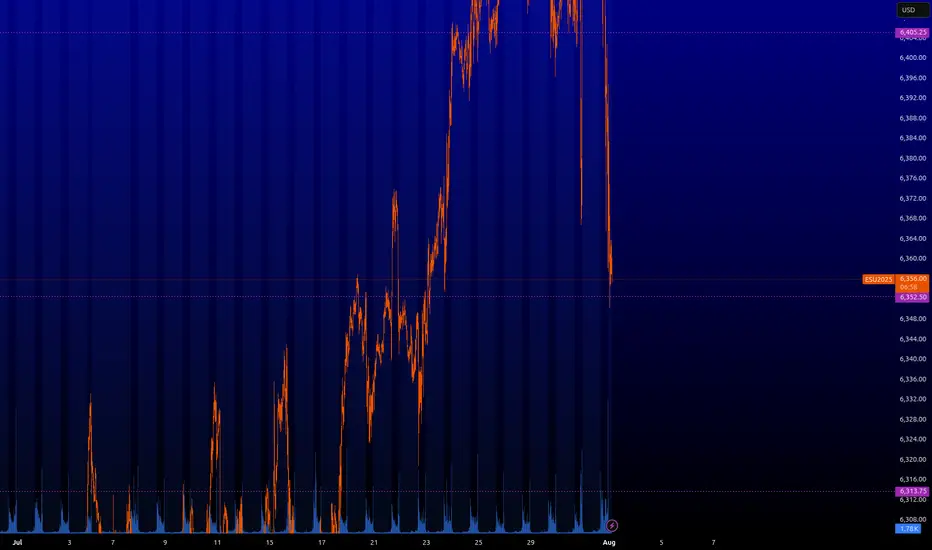
ES : Key levels⚠️ VOLATILITY WARNING ⚠️
Trading around major news can be extremely unpredictable. Trade responsibly!
Here are the key levels that the market will be interested in. So far, the green level of ~6.263 is likely to bounce, but it is old. I'd wait for something fresher.
From the minor timerframe, we can soon go long from ~6.352. If I'm at my computer and everything works out at this level as it should, I'll let you know.

Review a Few of our Trades & Update Overall Market PerspectiveIn this video, I review some of the trades taken over the past 1-2 weeks, and discuss in more detail the current technical and geopolitical/macro thesis on AMEX:SPY NASDAQ:QQQ NASDAQ:SQQQ AMEX:SOXS , and the overall market. Exciting times, and ripe with opportunity to *potentially* BTD (again).

Please comment your opinion Greetings and respect to the analysts
This btcusd chart is on bitstamp I know the general analysis of what exists in the market, but please comment your opinion on this chart and the fractal and ascending channel that the price has always respected.

NQ GC ES, Daily Orderflow and Weekly OutlookCME_MINI:NQ1! COMEX:GC1! CME_MINI:ES1!
Time for the final AMDX

JPY/USD — Long-Term Technical Setup & Market Outlook💱 JPY/USD — Long-Term Technical Setup & Market Outlook
1. 🧭 Market Context & Catalysts
US-Japan monetary divergence: The Fed remains rate-tight while the BoJ maintains ultra-loose policy, putting persistent downside pressure on the yen.
Economic drivers: Strong US economic data (growth, labor, inflation) supports USD strength; Japan’s macro data remains soft.
Sentiment signals: Hawkish Fed tone continues; safe-haven flows may limit further USD gains in geopolitical risk shifts.
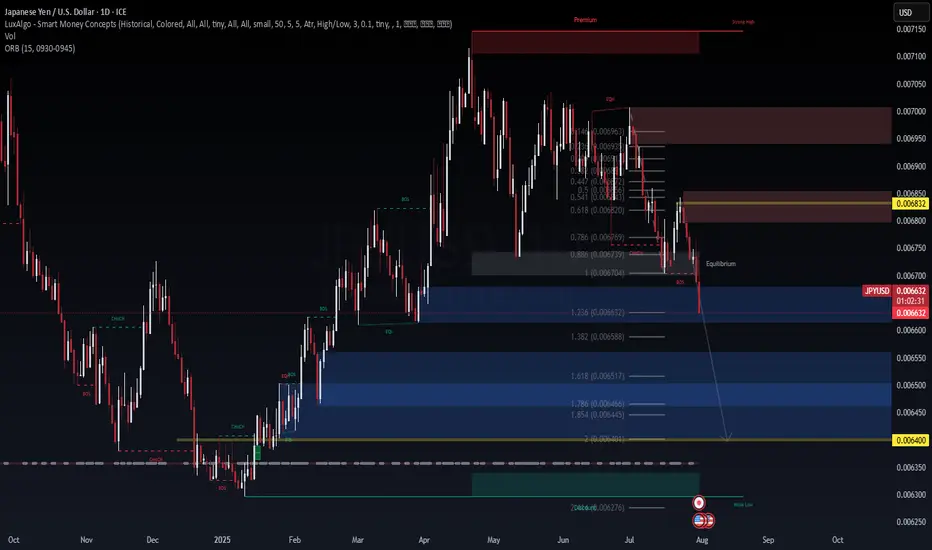
2. 🧱 Technical Structure (Daily Timeframe)
Break of structure (BOS) below 0.00700 signaled the dominant bearish regime.
The price retraced into the 0.786–0.886 Fibonacci zone (~0.00676–0.00679), then resumed selling—textbook re-entry into areas of liquidity (Equilibrium).
Current price sits near 0.006631, just below BOS and equilibrium zone—suggesting continuation of bearish order flow.
Fibonacci extensions show projected targets at 0.006632 (1.236), 0.006588 (1.382), 0.006517 (1.618), and potential support area at ~0.006400.
A stronger support zone exists near 0.006276 (Weak low / domain demand zone).
3. 📝 Trade Plan & Risk Controls
Continuation Setup: Look to enter on a clean bearish candle close near ~0.00665. Target the Fibonacci extensions at 1.236, 1.382, and 1.618—approximately 0.006632, 0.006588, and 0.006517 respectively. A deeper extension into the 0.006400 zone is also possible. Place the stop-loss just above 0.00670, as this level invalidates the recent break of structure and implies rejection of downside continuation.
Pullback Re-entry Setup: If price retraces higher, consider a re-entry short near ~0.00680. Use the same Fibonacci targets as above. Invalidate the setup if price breaks above 0.00680, which would suggest a shift toward bullish structure or absorption of the prior supply zone.
4. ⚠️ Watch Key Risks & Signals
If price breaks above the 0.786 zone or creates a higher high above equilibrium, bearish thesis fails.
Monitor US data releases: FOMC minutes, inflation or jobs data—shifts could accelerate USD momentum.
Geopolitical shocks or risk-off flows could trigger yen strength reversal.
✅ Summary Outlook
JPYUSD remains firmly bearish with technical integrity intact.
Valid corrective levels now become sell zones toward continuation targets.
Extended downside toward 0.00640 area is plausible, with further drop to 0.006276 zone if trend continues strongly.
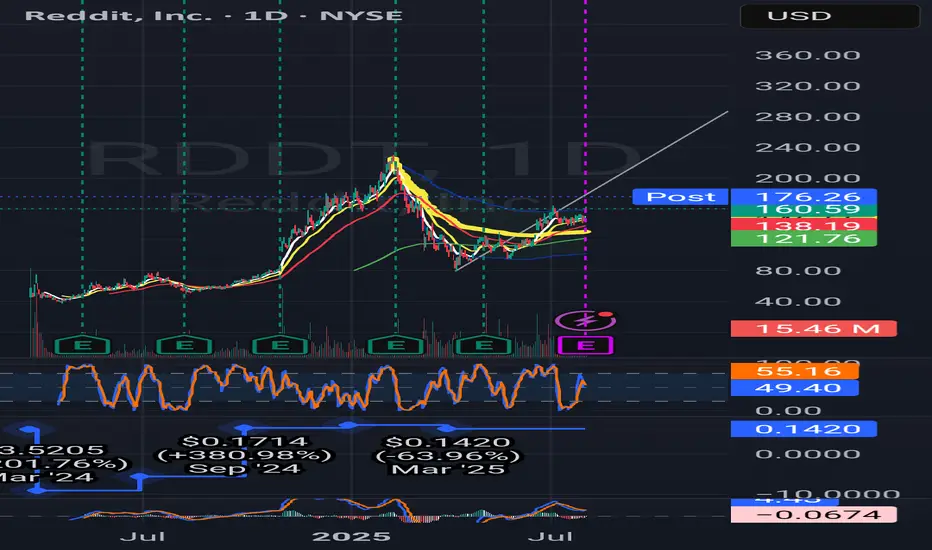
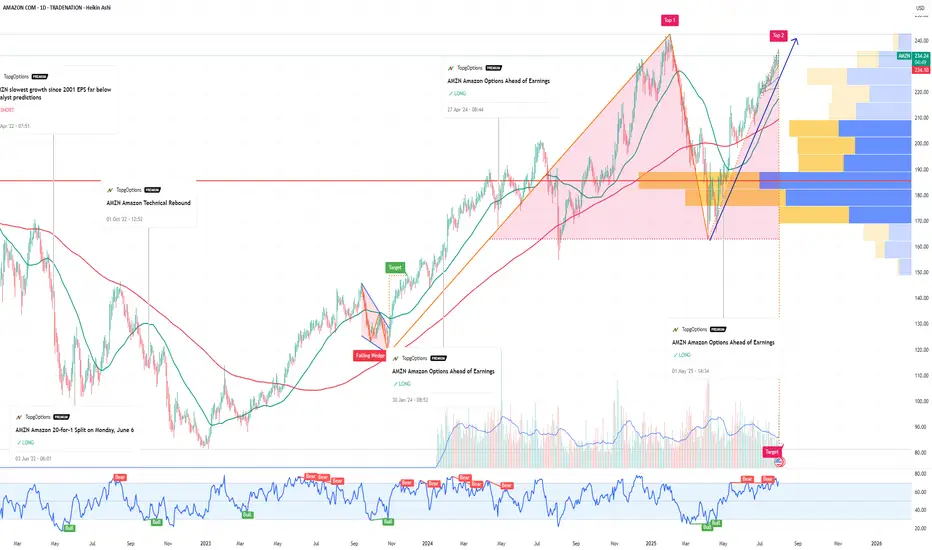
AMZN Amazon Options Ahead of EarningsIf you ahven`t bought the recent dip on AMZN:
Now analyzing the options chain and the chart patterns of AMZN Amazon prior to the earnings report this week,
I would consider purchasing the 245usd strike price Calls with
an expiration date of 2025-9-19,
for a premium of approximately $7.02.
If these options prove to be profitable prior to the earnings release, I would sell at least half of them.
Disclosure: I am part of Trade Nation's Influencer program and receive a monthly fee for using their TradingView charts in my analysis.
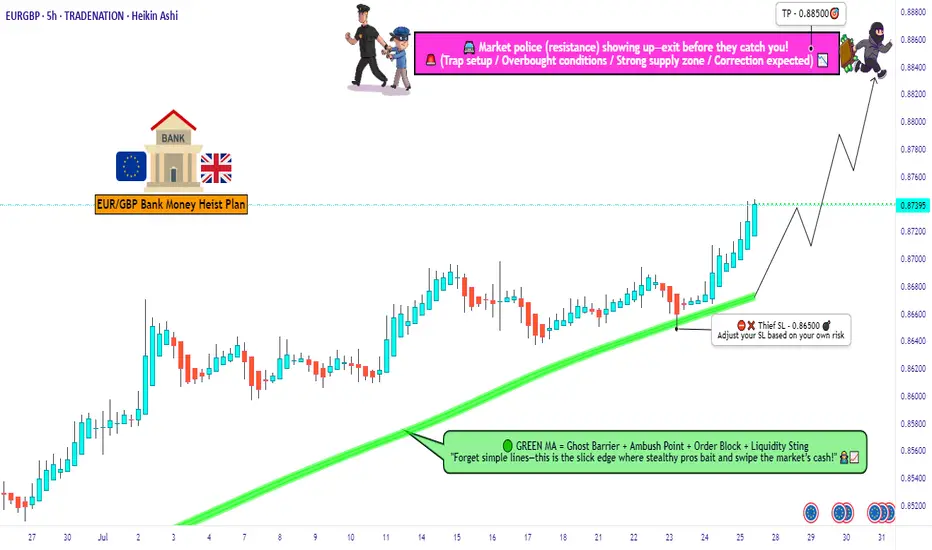
EUR/GBP Thief Trade: Swipe Profits Before Overbought Trap!🦹♂️ EUR/GBP "THE CHUNNEL HEIST" – BULLISH LOOT IN PROGRESS! 🚨💰
(Thief Trading Strategy – Escape Before the Cops Arrive!)
🎯 DEAR MARKET PIRATES & PROFIT SNATCHERS,
Based on our 🔥Thief Trading Style Analysis🔥, we’re executing a bullish heist on EUR/GBP ("The Chunnel"). The vault is wide open—time to swipe the loot before the high-risk resistance police barricade (aka overbought trap) shuts us down!
📜 THE MASTER PLAN:
✔ Entry (📈): "The Bullish Vault is Unlocked!"
Buy Limit Orders (15-30min TF) near recent swing lows/highs.
Thief’s DCA Trick: Layer entries like a pro robber—multiple limit orders for max loot.
✔ Stop Loss (🛑): "Hide Your Stash Wisely!"
SL at nearest 4H candle wick (0.86500)—adjust based on your risk appetite & lot size.
Remember: A good thief always has an escape route!
✔ Target (🎯): 0.88500 (or escape earlier if the cops get suspicious!)
🔎 SCALPERS & SWING BANDITS – LISTEN UP!
Scalpers: Stick to LONG-ONLY heists! Use trailing SL to protect profits.
Swing Thieves: If you’re low on cash, join the slow robbery—DCA & hold!
📡 WHY THIS HEIST IS HOT:
Bullish momentum in play (but BEWARE of overbought traps!).
Fundamental Drivers: Check COT Reports, Macro Data, & Sentiment.
🚨 TRADING ALERT: NEWS = POLICE RAID RISK!
Avoid new trades during high-impact news.
Trailing SL = Your Getaway Car! Lock profits before volatility strikes.
💥 BOOST THIS HEIST – STRENGTHEN THE GANG!
👉 Smash the LIKE & BOOST button to fuel our next market robbery!
👉 Follow for more heists—profit awaits! 🚀💰
🦹♂️ Stay Sharp, Stay Ruthless… See You on the Next Heist!
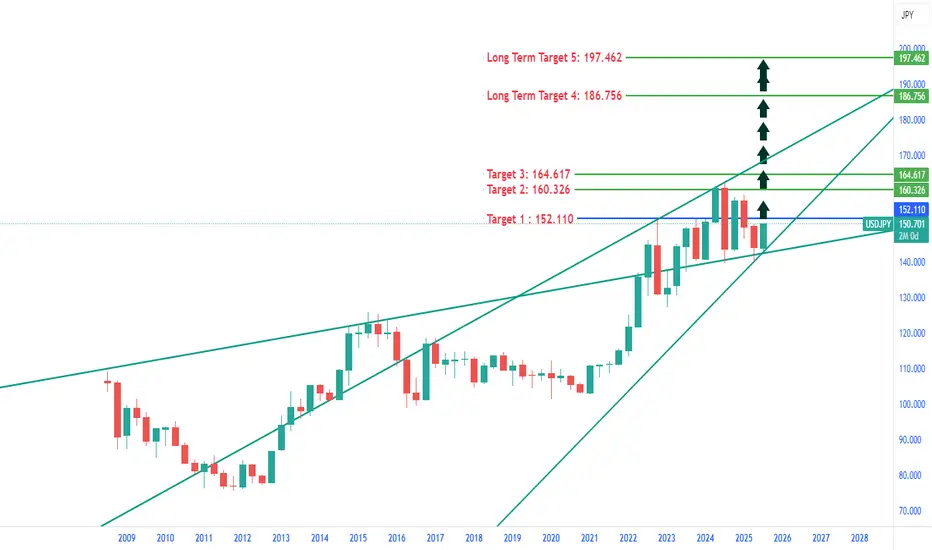
USDJPY : Where the price can reach? Long Term Scene.USDJPY Could soar to:
Target 1: 152.110
Target 2: 155 - 160.326
Target 4: 164.617
Target 5: 197.462
Trade at your own risk. Market can behave differently due to various factors.
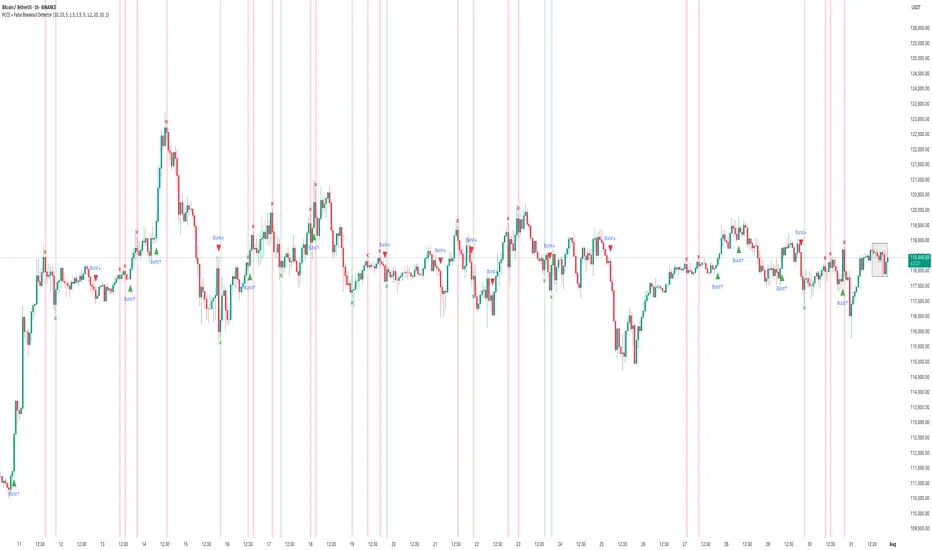
How to Use the PCCE + False Breakout DetectorHow to Use the PCCE + False Breakout Detector to Catch Trap Zones in BTC
Chart: BTC/USDT (1H)
Tool Used: PCCE + False Breakout Detector
Type: Educational – How to identify false breakouts and anticipate trend shifts.
⸻
🧠 What the Indicator Does:
The PCCE + False Breakout Detector is designed to identify breakouts from coiling ranges and filter out trap moves that often fool traders.
🔹 Burst↑ / Burst↓: Valid breakout from a price coil with volume and trend alignment
🔻 Red X: Marks a bull trap — breakout failed and price reversed lower
🟢 Green X: Marks a bear trap — breakdown failed and price reversed higher
By flagging where breakout structure fails, the indicator helps traders avoid false entries and position early for reversals.
⸻
✅ Recent Performance Highlights (BTCUSDT 1H):
📈 From July 13–31:
• Burst↑ on July 13 led to a clean uptrend (+$1,500 gain)
• Red X on July 16 called a failed breakout — price dropped hard
• Green X on July 16 caught the bear trap — price reversed immediately
• Burst↓ on July 21 triggered a sharp decline, validating breakdown
• Red X on July 30 spotted the bull trap just before price reversed down
📉 Even in sideways ranges, Red/Green Xs signaled when the move lacked conviction, allowing traders to wait instead of chasing noise.
⸻
🔍 Current Interpretation:
• BTC is trading inside a choppy structure after a recent Burst↑ and Red X combo.
• The X mark zone (gray box) warns of instability — bulls attempted a breakout but failed.
• If price continues to stay below the Red X high → likely retracement ahead.
• If we see a Green X + rally soon → potential reversal setup in progress.
⸻
📚 How-To Use the Indicator:
1. Burst Signals (Breakouts)
🔸 Use these to enter when coil compression breaks with volume
🔸 Works best when aligned with EMA trend and breakout body
2. Red / Green X (False Breakout Detector)
❌ Red X: Price spiked above resistance but lacked follow-through → trap
✅ Green X: Price dipped below support but got bought → trap
3. Confirm with Price Context
🔄 Look for reaction candles after X marks
📏 Set tighter stops — traps often reverse fast
🔔 Combine with your S/R zones or order block theory
⸻
🧠 Final Thoughts:
The PCCE + False Breakout Detector isn’t just about spotting momentum — it’s about reading intent vs. failure in price action.
BTC’s current structure shows signs of indecision. Trust the Xs to tell you whether the move has legs — or is just another trap.
🎯 Learn to trade the trap, not fall into it.