#UMA is 102% ready for the pump#UMA is 102% ready for the pump..
Hold Tight And Enjoy Ride.
!! Om Nmah Shiavye !!
$ Namaste $
Beyond Technical Analysis

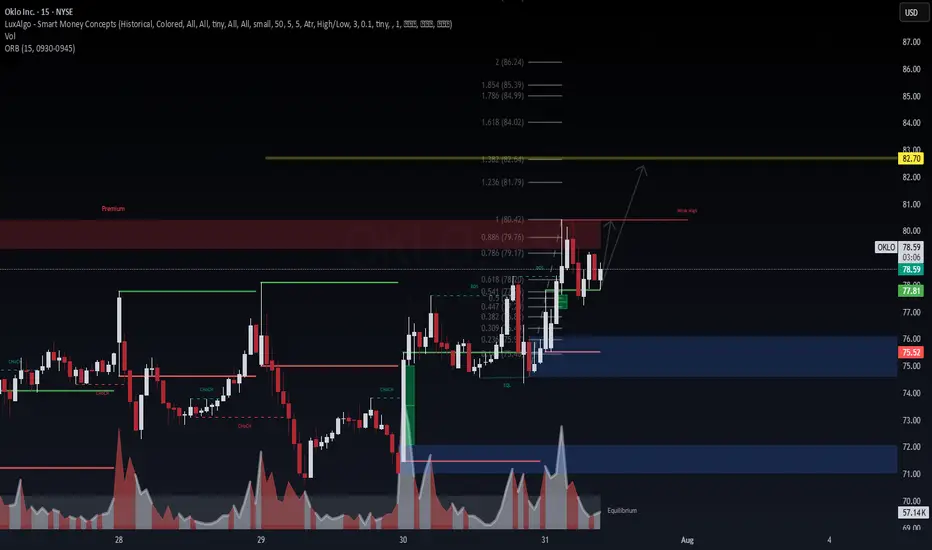
OKLO (NYSE: $OKLO) – 15M Liquidity Hunt & Expansion Path📈 OKLO (NYSE: NYSE:OKLO ) – 15M Liquidity Hunt & Expansion Path
Chart by WaverVanir International LLC | VolanX Protocol
We're observing clean SMC structure post-CHOCH (Change of Character) with strong demand defense off equilibrium. Price just reclaimed the ORB high (77.81) and is consolidating under a weak high near $80.42, inside a premium rejection block.
🧠 Institutional Narrative
CHoCH → BOS confirms bullish intent post-manipulation.
Volume spike on reclaim of fair value gap shows potential absorption and re-accumulation.
Fib confluence at 0.618 (78.20) with bullish rejection and internal liquidity grab.
🎯 Targets
Minor: 80.42 (weak high), expect sweep.
Primary: 82.70 (Fib 1.382 extension) aligns with prior premium inefficiency.
Aggressive: 84.99–86.24 (1.786–2.0 extension zone).
🛡️ Invalidation
Break below ORB low 75.52 would invalidate current bullish structure short term.
🧭 VolanX Signal
This aligns with a Liquidity Expansion Playbook inside the institutional price delivery model. Watching for continuation if $80.42 sweep holds with strength.
Disclaimer: For educational purposes only. Not financial advice. #VolanX #SMC #Trading #OKLO #Stocks #LiquidityHunt #MarketStructure #InstitutionalTrading
HOOD WEEKLY OPTIONS TRADE (7/31/25)
### ⚡️HOOD WEEKLY OPTIONS TRADE (7/31/25)
📈 **Setup Summary**
→ Weekly RSI: ✅ Rising
→ Daily RSI: ❌ Falling (⚠️ Short-term pullback risk)
→ Call/Put Ratio: 🔥 **1.89** (Bullish flow)
→ Volume: 📉 Weak — fading conviction
→ Gamma Risk: 🔥 High (1DTE)
---
💥 **TRADE IDEA**
🟢 Direction: **CALL**
🎯 Strike: **\$110.00**
💰 Entry: **\$0.82**
🚀 Target: **\$1.62** (+100%)
🛑 Stop: **\$0.41**
📆 Expiry: **Aug 1 (1DTE)**
🎯 Entry: Market Open
📊 Confidence: **65%**
---
🧠 **Quick Insight:**
Mixed signals = *Scalper’s Playground*
✅ Weekly trend favors upside
⚠️ Weak volume & daily RSI divergence = TRADE LIGHT
---
📌 Posted: 2025-07-31 @ 11:53 AM ET
\#HOOD #OptionsTrading #WeeklyPlay #GammaScalp #TradingViewViral #HighRiskHighReward

ALAB WEEKLY TRADE IDEA (2025-07-31)
### 🚨 ALAB WEEKLY TRADE IDEA (2025-07-31)
🧠 **Smart Money Snapshot**
→ RSI: **76+** = Strong Momentum
→ Call/Put Ratio: **2.19** = Bullish Bias
→ Volume: 📉 **0.6x last week** = Momentum may fade
→ Gamma Risk: ⚠️ High = Expect **fireworks**
---
📈 **TRADE SETUP**
💥 Ticker: **\ NASDAQ:ALAB **
🟢 Strategy: **Buy Call**
🎯 Strike: **\$149.00**
💰 Entry: **\$0.65**
🎯 Target: **\$0.97** (50%+)
🛑 Stop: **\$0.39**
📆 Expiry: **Aug 1 (1DTE)**
📊 Confidence: **75%**
---
⚠️ **Risk Note:**
1DTE = 💣 High gamma = **big reward / big risk**
🧯 Size small. Exit fast. Ride momentum.
---
📌 Trade posted: **2025-07-31 @ 10:58 AM ET**
\#ALAB #OptionsTrading #WeeklyPlay #GammaSqueeze #MomentumTrade #TradingViewViral

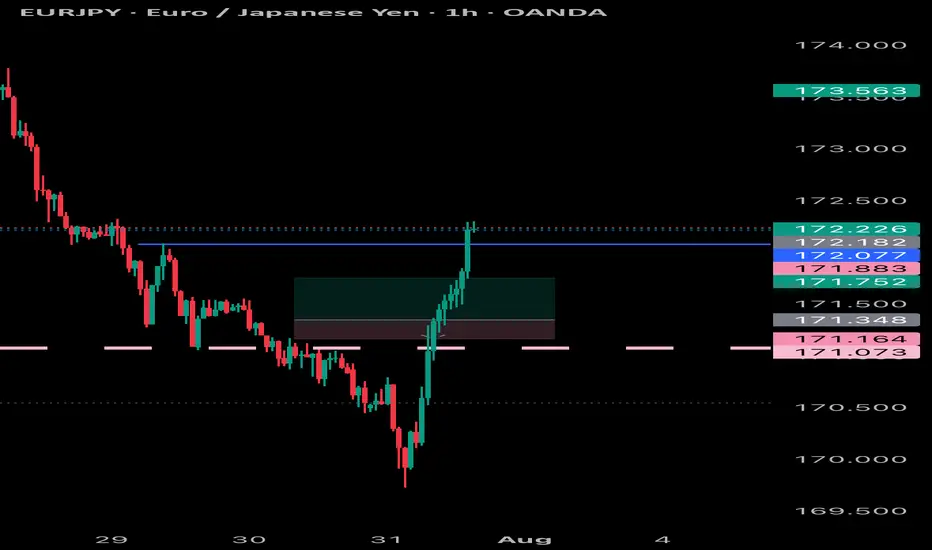
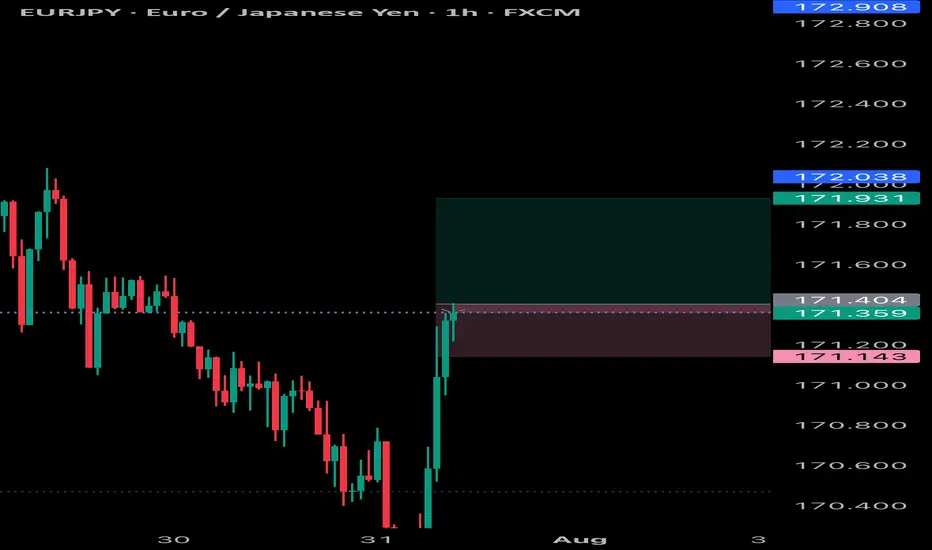
EURJPY SWEET BLUESEurjpy has hit all take profits with very little drawdown and huge profits very quickly nice pattern, simply followed
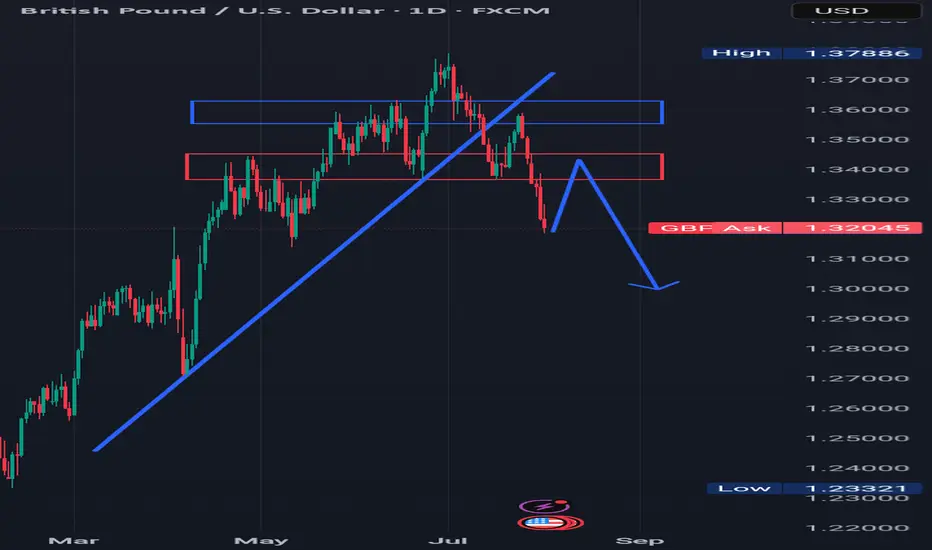
MORE DOWNSIDE AHEAD Looking at the GBPUSD pair, we can see that the trend has reversed to the downside.
The pair broke a rising trendline to the downside in the past and also formed a head and shoulder pattern.
Also in the past,price broke a resistance which is indicated with blue rectangle and a support which is indicated with a red rectangle to the downside.
I'm seeing price retracing to retest the previously broken structure or support which is indicated with a red rectangle and turning it to resistance, and thereby continuing the downtrend
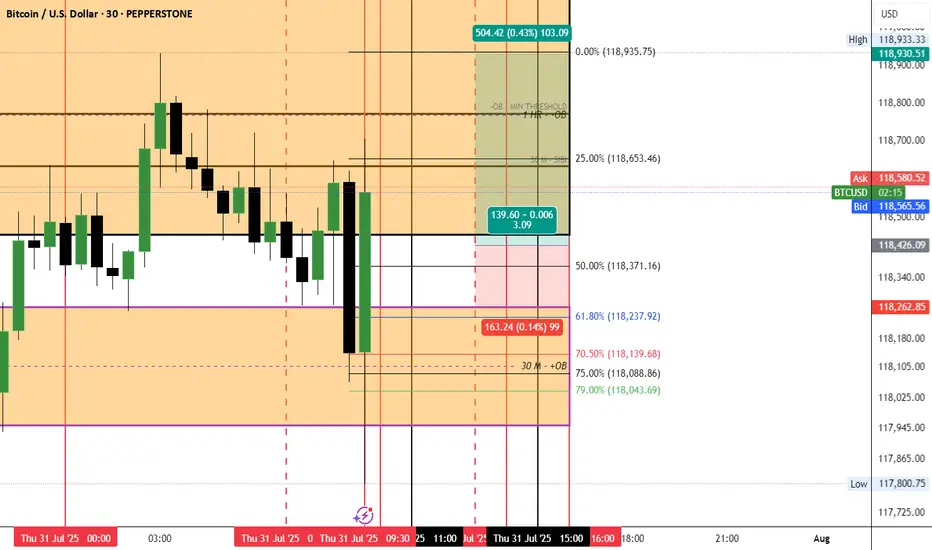
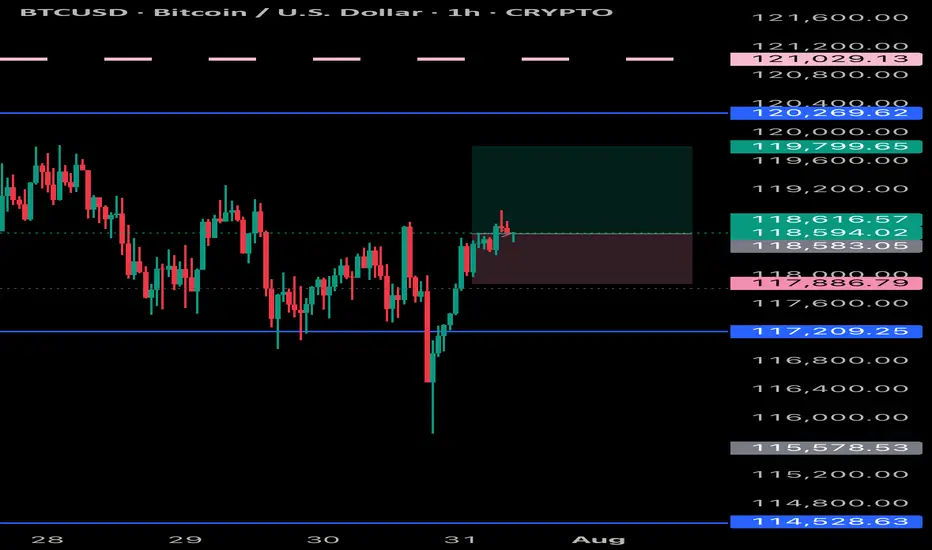
BTC LONG IDEA
My short term analysis of a long BTC Setup
ENTRY @ PRICE = 118,422
SL @ PRICE = 118262
TP @ PRICE = 118930
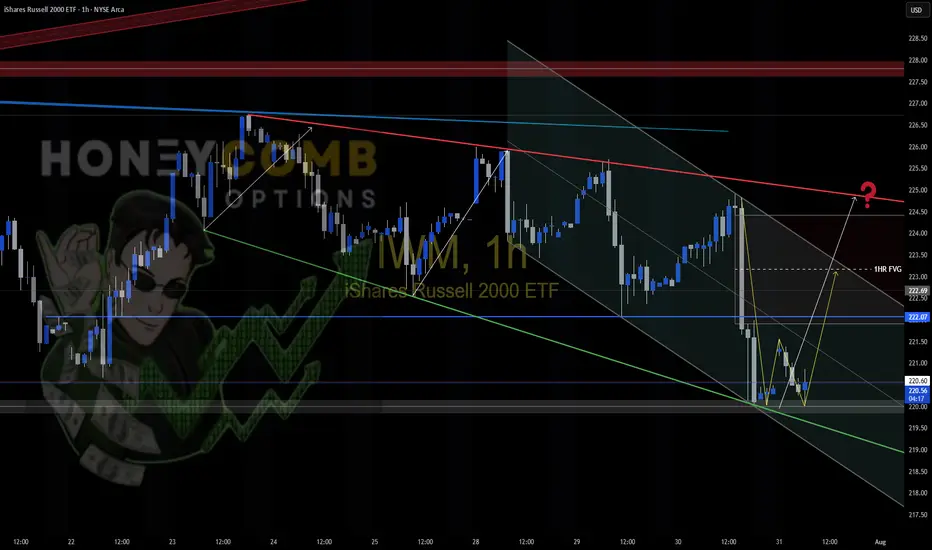
IWM SETUP. Looks good for a long.Bouncing off the trendline where it was supposed to. Will it get to the top of the broadening wedge?
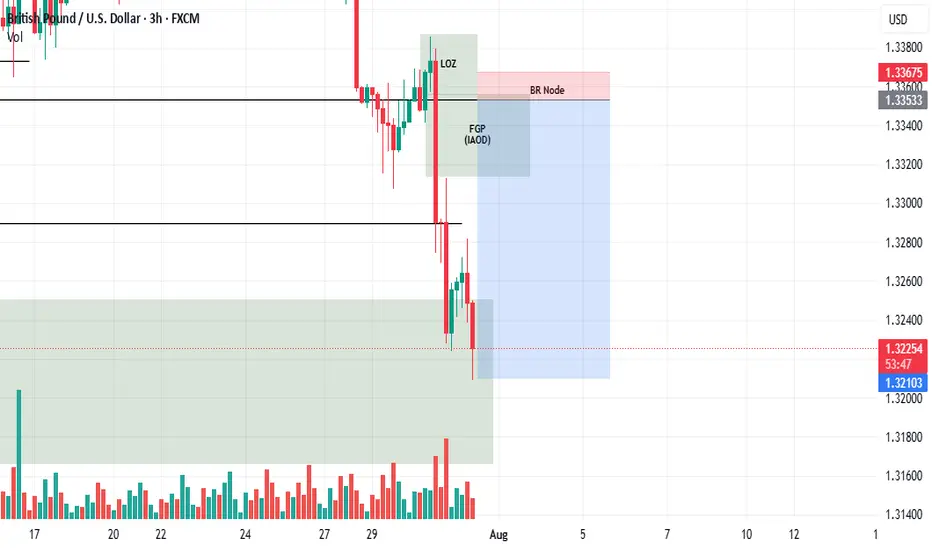
Short idea!Hello all. the last falling leg is about to start. lets see the reaction of the market on the Broken retrace zone. be happy.
Short idea!Hey all. In my idea, market needs a very deep levels in GBPUSD, as you see Dollar is on a very strong movement and we should look at just for selling. Nodes works great most of the time. be happy(wink).
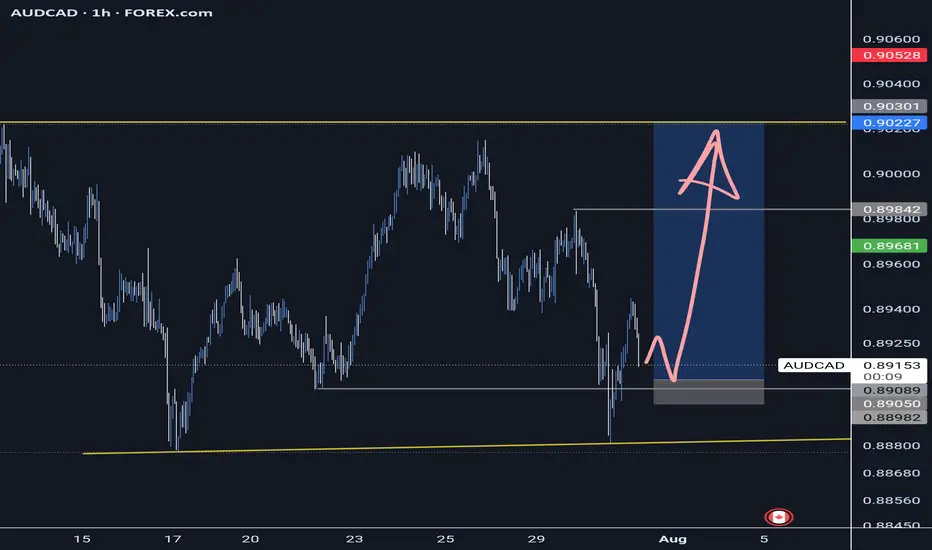
AUDCAD - Buyers ready to step in AUDCAD is in moving in LTF consolidation before next impulsive phase. Couple highs to target a good R ratio.
Good Luck
GBPUSD 30.07.2025+ US data Beat (ADP Nonfarm, GDP QoQ, Core PCE)
~+ Timing: Pre-Fed Rate Decision
~+ Latest UK Retail Sales Miss
~+ BoE is in dovish tilt (MPC 6-3 vs 6-2 expected)

Report - 31 jully, 2025Summary
Initial optimism following the historic US–EU trade agreement has swiftly eroded as France and Germany openly criticized the deal, warning it undermines EU sovereignty and economic stability. The euro fell sharply, carmakers led equity declines, and political fractures within the bloc widened. While the deal averted a full-blown trade war, concerns over inflation, competitiveness, and regulatory submission have shifted sentiment. The perception of European capitulation under pressure from Trump has reignited transatlantic tensions and injected fresh volatility into global markets.
This retreat in EU support underscores the precarious nature of transatlantic cooperation under Trump’s economic nationalism. Meanwhile, signs of tech decoupling, tariff expansion beyond the EU, and deferred retaliation signal a fractured global trade order. European fiscal policy, particularly Germany’s defense-driven deficit expansion, is now under heightened scrutiny amid market volatility and FX pressure.
Market Reactions
Equity markets across the EU opened higher on tariff relief expectations but reversed course as Germany’s Chancellor Merz and France’s Prime Minister Bayrou denounced the deal. The DAX fell 1.1%, CAC 40 slipped 0.4%, and eurozone auto stocks plunged 1.8%. The euro lost over 1% against the dollar in its second-largest daily drop this year, reflecting concern over structural imbalance and political subordination.
In contrast, semiconductor stocks surged, with ASML and BE Semiconductor rising over 4% as the tech sector escaped tariffs. Wall Street remained relatively stable, buoyed by optimism around defense, energy, and tech sectors gaining from the deal. The dollar index (DXY) rose 0.9%, reflecting both euro weakness and expectations that inflationary tariffs could keep Fed rates elevated.
Fiscal and Political Implications
The backlash from Berlin and Paris lays bare deep fractures within the EU regarding its posture toward Washington. Chancellor Merz’s warning of "considerable damage" and Bayrou’s reference to EU “submission” cast doubt on Ursula von der Leyen’s negotiation strategy. The deal’s imposition of a 15% baseline tariff—triple the pre-deal weighted average—exposes Europe to substantial cost increases without achieving reciprocal liberalization.
Internally, the European Commission is accused of caving to U.S. pressure while undermining its own credibility. Documents and diplomatic leaks suggest that more aggressive retaliatory planning was watered down due to fears of a broader security rupture, particularly concerning NATO and U.S. arms support to Ukraine. This reinforces the EU’s strategic dependency, limiting its ability to resist U.S. economic coercion.
Germany’s effort to shield its auto industry via offset schemes largely failed, while Brussels’ “trade bazooka” was shelved in favor of “strategic patience.” This perceived capitulation may embolden further unilateral action from the U.S., especially as Trump eyes tariffs on pharmaceuticals and rest-of-world imports up to 20%.
Strategic Forecasts
Europe's short-term economic outlook has darkened. The tariff burden—especially on high-margin exporters like German autos—raises inflation risks while lowering competitiveness. Political backlash could destabilize Commission leadership and provoke calls for more aggressive economic sovereignty.
Expect further euro weakness, sectoral underperformance in autos and industrials, and possibly downgrades to GDP forecasts across the eurozone. On the U.S. side, Trump’s success with transatlantic leverage may embolden him to expand tariff threats to Asia and Latin America. The Fed will likely face a more inflationary policy environment, with fiscal and protectionist stimulus prolonging higher rate expectations.
Simultaneously, China's relief from U.S. tech export freezes—designed to secure a Xi-Trump summit—adds complexity to the strategic tech rivalry. The suspension of chip export controls could spur near-term capital inflows to Chinese AI firms while igniting concern in U.S. defense circles.
Risks and Opportunities
Risks
Breakdown in EU cohesion and trust in Commission leadership
Expansion of U.S. tariffs to rest of world (ROW), escalating global trade friction
Retaliation by China if U.S. chip diplomacy reverses
Drag on European industrial profits and inflation-driven ECB recalibration
Fed rate path upwardly skewed due to structural tariff-driven inflation
Opportunities
U.S. defense and energy sectors benefit from guaranteed EU purchases
Semiconductors remain shielded, with valuation support in ASML, TSMC, Nvidia
Dollar strength provides tactical trades in EURUSD, GBPUSD
Select EM exporters (e.g. Brazil) benefit from re-diversified trade flows
AI hardware and chip infrastructure (Samsung–Tesla deal) gains strategic momentum
Key Asset Impact – Outlook
XAUUSD (Gold):
Gold holding firm around $3,340. With fresh political discord and rising protectionist inflation, gold remains a hedge. If Fed signals rate hold, expect a push to $3,400.
Bias: Bullish
S&P 500:
Resilient, driven by defense, energy, and AI. But prolonged strong dollar and tariff-induced input cost pressures are risk factors.
Bias: Moderately Bullish
Dow Jones:
Benefiting from defense and dividend-heavy mix, but under pressure from industrial drag.
Bias: Neutral to Bullish
DXY (US Dollar Index):
Strengthening on euro weakness and policy divergence. However, long-term Fed autonomy concerns and political volatility could reverse trend.
Bias: Bullish short-term, Neutral longer-term
USDJPY:
Little movement today. BoJ still cautious, yen capped unless Fed shifts dovish or global risk-off resumes.
Bias: Range-bound
EURUSD:
Second-largest single-day drop YTD. Political backlash and export headwinds limit upside.
Bias: Bearish
Crude Oil (WTI):
Flat to slightly higher, supported by EU commitment to U.S. energy, but demand data remains soft.
Bias: Neutral
Stoxx Autos:
Heavy selloff (-1.8%) despite tariff reduction, reflecting margin pressure.
Bias: Bearish
ASML / BE Semiconductor:
Relief rally on tariff exclusion. Long-term tailwinds from open AI infrastructure and Samsung–Tesla chip deal.
Bias: Bullish
Following the signing of a landmark trade deal between the U.S. and the European Union, immediate relief in financial markets has quickly given way to political and economic backlash within the EU. France and Germany, two of the bloc’s largest economies, have openly criticized the agreement, warning it will damage their industrial competitiveness and economic sovereignty. German Chancellor Friedrich Merz labeled the 15% blanket tariff “damaging” for both Europe and the United States, while French Prime Minister François Bayrou called it a “dark day” for EU autonomy. Despite avoiding a full-blown transatlantic trade war, the nature of the deal — seen by critics as submission under U.S. pressure — has sharply divided European leaders and exposed internal fractures in Brussels' negotiation strategy.
Market reactions reflect this shift in sentiment. The euro recorded its second-largest single-day drop this year, falling 1.1% against the dollar as investor confidence in European political resolve weakened. Equity markets, particularly in Germany and France, reversed earlier gains. The DAX fell 1.1%, the CAC 40 dropped 0.4%, and the Stoxx Europe 600 Auto Index declined by 1.8%, led by steep losses in Volkswagen, BMW, and Mercedes-Benz. While semiconductor stocks bucked the trend — with ASML and BE Semiconductor rising over 4% after escaping tariffs — the overall message was one of fading optimism and growing policy disarray. On the U.S. side, the dollar strengthened, aided by expectations that tariff-driven inflation will keep Federal Reserve interest rates elevated.
President Trump, emboldened by what many perceive as a successful economic power play, has signaled that he may impose tariffs of up to 20% on countries outside the deal framework — effectively targeting much of the global economy. Sectors such as pharmaceuticals and biotechnology appear to be next in line, with chip exports already under scrutiny. This expands the sphere of tariff risk, placing emerging markets and global exporters on high alert. If implemented, these levies could spark renewed capital flows into U.S. assets and exert further downward pressure on global growth forecasts.
The European Union’s failure to mount a credible retaliatory response has amplified the perception of its weakened position. Brussels initially suspended its response to U.S. tariffs in April and internal discord among member states diluted the EU’s “trade bazooka.” While a €93 billion retaliatory package was drafted, the effective threat fell to only €9 billion of actionable tariffs after exemptions were carved out for politically sensitive sectors like Irish whiskey and Italian beef. Critics argue that this strategic retreat undermined the bloc’s negotiating leverage. Strategic dependence on U.S. security guarantees — particularly for eastern and northern EU states — contributed to Brussels' caution, as did fears that escalation could prompt Washington to cut off military aid to Ukraine or withdraw from NATO commitments.
Simultaneously, the U.S. has quietly frozen certain export restrictions on China to facilitate a potential trade accord with Beijing and secure a meeting between Presidents Trump and Xi Jinping. The move, which includes halting a ban on Nvidia’s H20 chip, has drawn criticism from over 20 U.S. national security officials who warn that the chip could enhance China's military and surveillance capabilities. Despite these concerns, the Commerce Department has been instructed to avoid further provocative actions for now. This provides a temporary tailwind for Chinese tech equities and hardware manufacturers, though the strategic rivalry between Washington and Beijing remains unresolved.
In the private markets, a notable structural shift is underway. Private equity investors are increasingly opting to cash out of continuation vehicles — special funds used to extend ownership of portfolio companies — rather than roll over their stakes. Liquidity has become paramount as traditional exits via IPOs and trade sales remain scarce. Data from Houlihan Lokey shows that over 85% of investors chose to exit such vehicles in 2025, up from 75% last year. This underscores broader risk aversion and signals a waning appetite for illiquidity and long-duration exposure in uncertain macro conditions.
Overall, the global strategic landscape is growing more fragmented. Europe is politically divided and economically exposed. The U.S. is leveraging its market dominance to enforce strategic compliance, while China is benefiting from a temporary softening in U.S. export policy. Capital is flowing toward liquidity, defensives, and tech infrastructure — and away from uncertainty and regulatory entanglement. Investors should remain attuned to central bank reactions, retaliatory threats, and sudden shifts in geopolitical posture over the coming weeks.


BTCUSD INCREASES Bitcoin looking to be targeting new highs and I’m simply following the trend and keeping trading simple
UP TREND EURJPYEurjpy will be buying and scalping will be moving my SL to BE or swing with it all the way to the top as it cannot sell forever
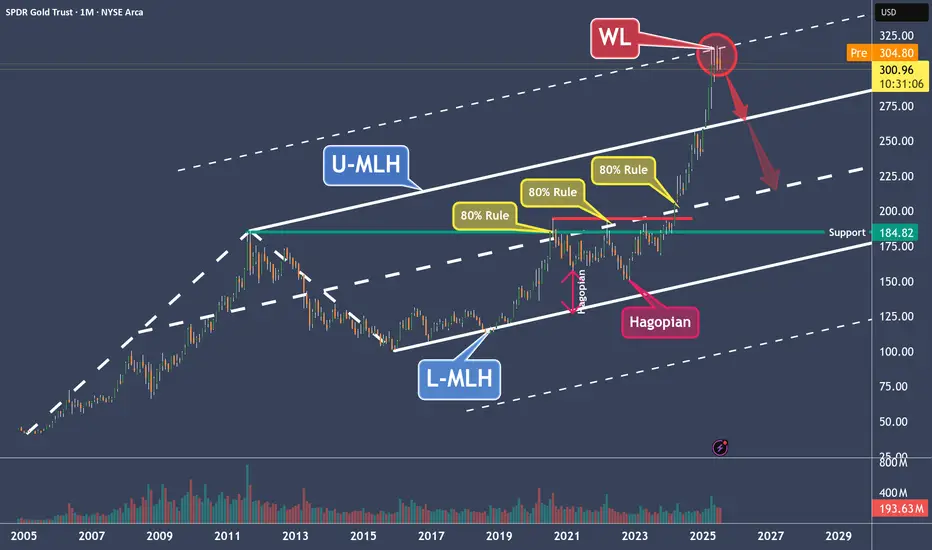
GLD – Why Gold Is a Clear Short to MePrice moved from the Lower Median Line (L-MLH) up to the Centerline, fulfilling the 80% rule.
Then we had two Hagopians, which sent price right back to the Centerline.
After the breakout above the Centerline, the next target was the Upper Median Line Parallel (U-MLH), which was reached rather quickly.
Finally, price broke above the U-MLH and was pulled up toward the Warning Line (WL).
Is this the end of the happy story?
I think so—because Gold has now reached its 2nd standard deviation, and there’s probably no more gas left in the tank.
The Trade:
- A logical target is the U-MLH.
- A secondary target is the Centerline.
At the very least, if you're long, this might be a good time to take some profits—because no tree grows to the moon.
For further details, I will follow-up with a Video explanation - See my Signature.
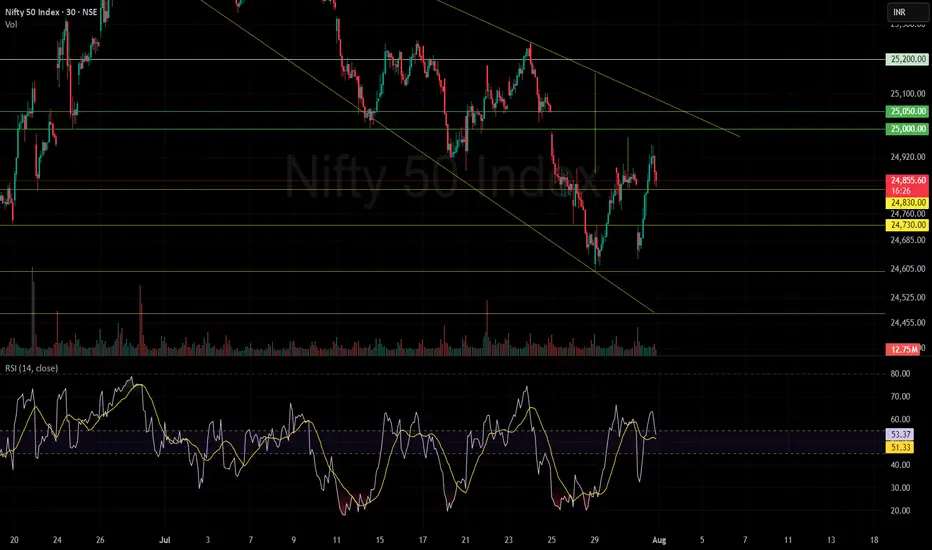
Nifty again back towards the upper rangeNifty’s recent rise can be attributed to short covering ahead of the monthly expiry, which often results in a surge as traders close their short positions.
Currently, the index faces a strong resistance zone around 25,000–25,100. A clear move above this range could indicate a trend change or a shift towards a more bullish outlook. If Nifty does not decisively cross this resistance, the market is expected to remain neutral to sideways, meaning price action could stay range-bound without a clear direction.
Additionally, 24,600 will act as a strong support level. As long as Nifty stays above 24,600, market sentiment should remain stable, supporting a constructive stance. A break below this level could signal increased caution.
Summary:
Rise driven by short covering ahead of expiry.
Strong resistance at 25,000–25,100.
24,600 will act as strong support.
Above 25,100: Trend change or bullish breakout likely.
Below 25,100: Market remains neutral/sideways.
Above 24,600: Sentiment stays steady; below may warrant caution.
Unless Nifty crosses above the resistance zone or drops below strong support, the outlook remains stable and sideways.
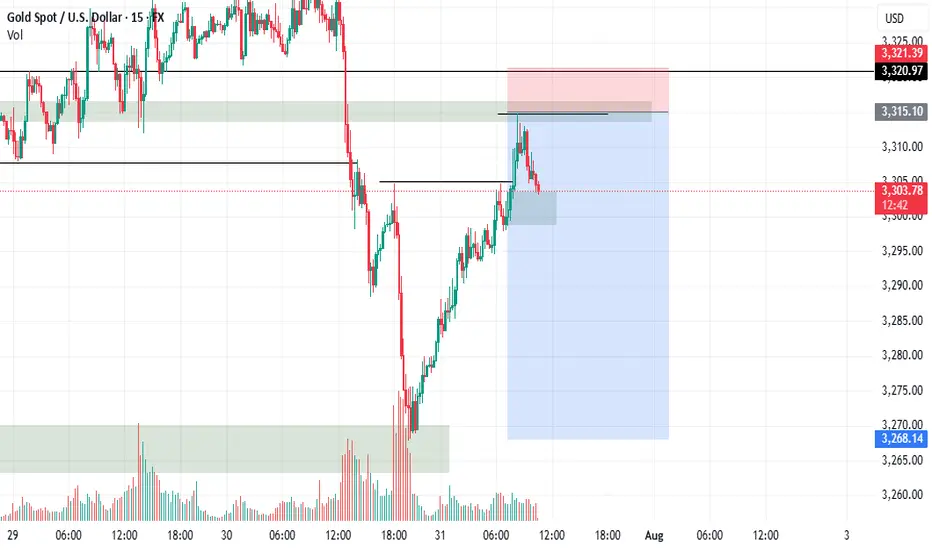
Gold at intraday critical levelIf stays below 3308, Sell target 3257
If breaks above 3308 with significant H1 close, buy target 3334. Apply risk management to enjoy trading at its best.

SAGILITY breakoutSAGILITY INDIA LTD
Technical Analysis Overview
Breakout Confirmation: The stock has convincingly broken out above a long-term descending trendline, accompanied by a sharp 9.98% surge in price and a significant jump in trading volume (181.83M). This combination of price action and volume generally indicates strong bullish sentiment and marks a potential trend reversal or fresh upward leg.
Volume Analysis: The highest volume day on the chart aligns with the breakout, suggesting institutional or large participant buying. Sustained higher volumes on up days after consolidations like this often provide additional confirmation of a genuine breakout rather than a false move.
RSI Momentum: The Relative Strength Index (RSI) is at 61.71, displaying strong bullish momentum yet leaving room before entering the overbought zone (typically above 70). This suggests there may still be scope for further upside without being immediately at risk of a major reversal due to overextension.
Trend Structure: After a consolidation phase and repeated attempts at the trendline, the price has managed to close decisively above resistance, indicating that the sellers may be getting exhausted and buyers are now in control.
Strategy & Key Levels
Watch for Retest: A pullback or retest towards the breakout trendline (around the 43-44 level) could present a buying opportunity if the level holds as new support.
Next Resistance Zones: Immediate resistance can be expected at previous swing highs, notably in the 50-55 range, where the stock faced prior selling pressure.
Risk Management: Any sustained move back below the breakout trendline would warrant caution, as it could indicate a failed breakout.
Summary
This breakout, backed by strong volume and improving RSI, indicates a shift in market sentiment in favor of buyers. Keeping an eye on price action around the breakout area and monitoring volume on any pullbacks will be key to validating the strength of this move.
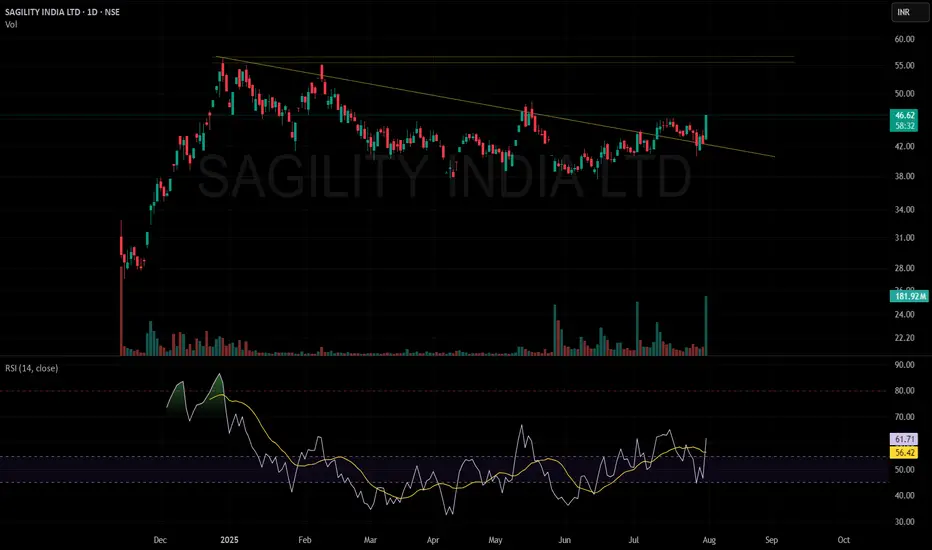
FIG IPO: Is it Worth the Hype?IPO Highlights
IPO pricing & volume
-Figma priced its IPO at $33 per share on July 30, 2025 (above its revised range of $30–32 and the initial $25–28 range—raising over $1.2 billion by selling approximately 36.94 million shares.
Valuation
-This pricing placed its valuation at around $19–19.5 billion fully diluted, close to the US $20 billion Adobe had once offered in a failed acquisition attempt.
Financial Profile & Business Strengths
Revenue and profitability
-Figma posted US $749 million in revenue for 2024 (up 48% YoY), and revenue in Q1 2025 grew by 46% to $228.2 million. It also delivered $44.9 million in net income during Q1 2025, signaling improved profitability after a net loss the prior year (inflated by a one‑time $1 billion breakup fee from Adobe).
Customer base & margins
-The company boasts 13 million monthly active users and covers 95% of Fortune 500 companies, with strong 91% gross margins and approximately 18% operating margins.
Cryptocurrency holdings
-Figma holds $69.5 million in a Bitcoin ETF and $30 million in USD Coin, planning to reinvest these into Bitcoin, a strategy similar to that of MicroStrategy.
Strategic & Market Implications
Signal for IPO revival
-Figma is the largest enterprise-software IPO since 2021 and is seen as a potential catalyst for a broader IPO rebound, potentially opening the floodgates for other companies such as Canva, Databricks, and more.
Market perception & analyst viewpoints
-Analysts, including Gil Luria at D.A. Davidson, view Figma as well-positioned in the AI/design space. Others caution that rising usage of generative AI could disrupt future margins, creating both potential and uncertainty.
Competitive landscape
-The IPO sets the stage for Figma to directly compete with Adobe. Despite Adobe’s recent stock decline, analysts expect both companies to potentially thrive given growing demand for creative tools.
-Disclaimer: This analysis is for informational and educational purposes only and does not constitute financial advice, investment recommendation, or an offer to buy or sell any securities. Stock prices, valuations, and performance metrics are subject to change and may be outdated. Always conduct your own due diligence and consult with a licensed financial advisor before making investment decisions. The information presented may contain inaccuracies and should not be solely relied upon for financial decisions. I am not personally liable for your own losses, this is not financial advise.

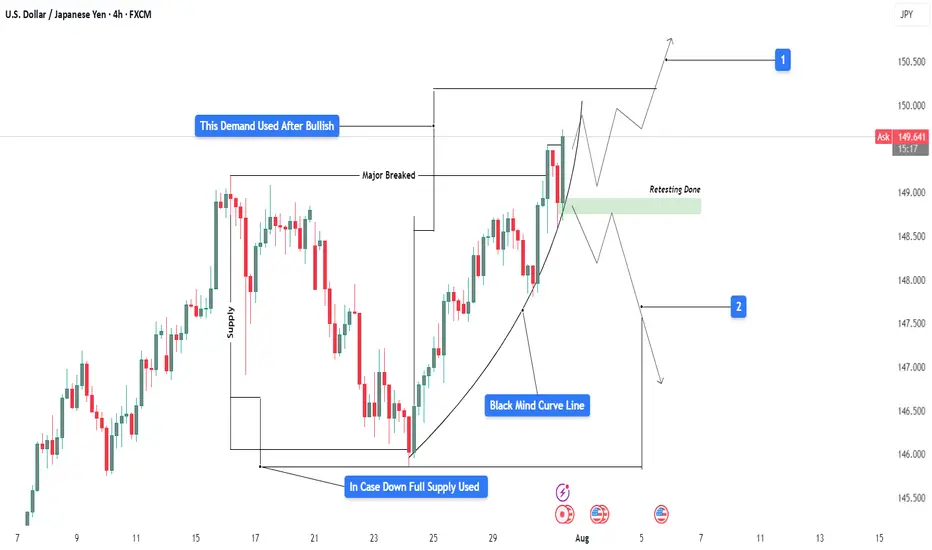
USDJPY 4H Analysis : Curve Breakout & Retest Completed + Bullish"Momentum Building Above Retested Demand – Will Bulls Take Control?"
📊 Market Structure Overview:
USDJPY has shown a clean bullish structure in recent sessions, supported by a strong demand retest and a steady parabolic curve formation (Black Mind Curve Line). The pair has successfully broken above a major resistance, retested it, and is now holding higher ground—suggesting potential for continued upside if current structure holds.
🧱 Detailed Technical Breakdown:
🔹 1. Demand & Retesting Behavior
The chart highlights a key demand zone (green box) that was previously used after a bullish move.
Price recently returned to this zone for a clean retest, validating its role as a strong support.
This type of retesting behavior is critical in smart money analysis, confirming that accumulation has occurred and sellers have been absorbed.
🔹 2. Major Breakout Confirmation
The previous major structure level has been decisively broken to the upside.
This level now acts as support, increasing the probability that the bullish move will sustain.
🔹 3. Black Mind Curve Line (Parabolic Structure)
A parabolic curved trendline supports the current price action, showing how bulls are gradually gaining momentum.
This curve represents buyer interest increasing over time, which often leads to an aggressive breakout when paired with retest confirmation.
📍 Key Price Zones:
Type Price Level (Approx.) Description
🔹 Retesting Zone ~148.800 – 149.100 Support zone after major breakout
🔺 Resistance Target (1) ~150.500 Bullish breakout target (short-term)
🔻 Downside Risk (2) ~147.000 – 146.500 Bearish invalidation zone if demand fails
🔹 Full Supply Area ~145.000 – 145.500 Historical supply zone if price fails completely
🔮 Trade Scenarios:
✅ Scenario 1 – Bullish Continuation (Primary Bias)
Retest is complete, and price is holding above the curve and demand zone.
If bullish momentum continues:
📈 Target 1: 150.50 – Near-term resistance and liquidity area
📈 Target 2: 151.20+ – Extension target if buyers dominate
Bullish Confirmation:
Price must stay above ~149.00 and continue forming higher highs.
Entry ideas: Wait for minor consolidation above current price or bullish breakout from mini range.
⚠️ Scenario 2 – Bearish Rejection
If price rejects from current level and breaks below the curve and demand zone (~148.80):
📉 First downside target: 147.00 (minor support)
📉 Final bearish target: 145.50 (full supply zone)
Bearish Confirmation:
Breakdown of curve support and close below the retesting zone with momentum.
Such a move would suggest buyers failed, and market may rotate lower.
🧠 Market Sentiment & Psychology:
Smart Money Behavior: Demand was filled cleanly and retested, indicating possible institutional interest at that level.
Momentum Curve: As shown by the black curve, momentum is rising gradually—this reflects confidence building among buyers.
However, price is near psychological resistance (150.00–150.50 zone), where heavy sell orders might be placed.
The market is in a decision zone, where confirmation of strength or failure will dictate the next 200–300 pip move.
🎯 Summary:
USDJPY is showing a bullish structure supported by:
A valid retest of demand
A clean breakout of major resistance
An ascending parabolic curve
If bulls defend the current zone, we may see a powerful continuation toward 150.50+. If price fails to hold above the retest zone, downside risks open toward 147.00 and potentially the full supply at 145.00.
📌 Trade Smart: Wait for price confirmation, manage risk with stop placement below the demand zone or structure lows, and avoid chasing the move.
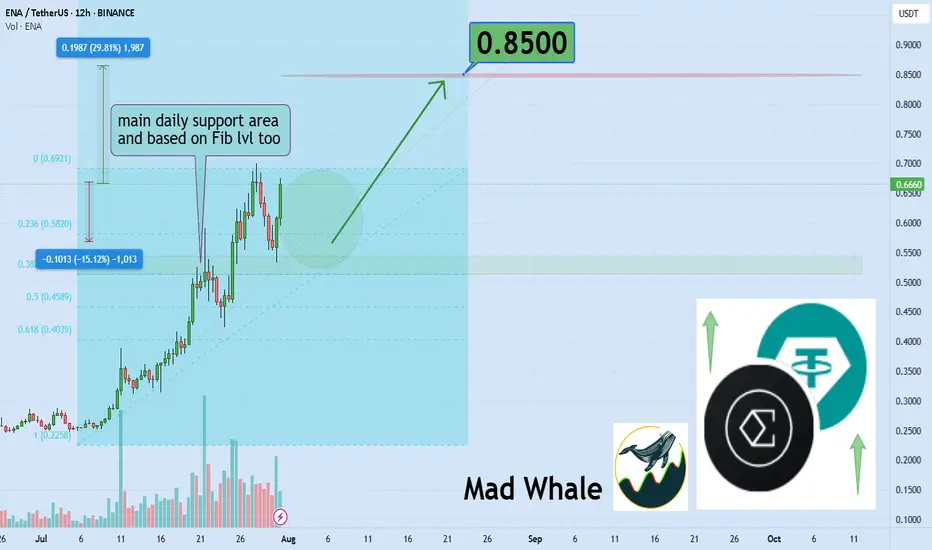
Ethena Bullish Momentum Builds, Eyes 30% Rally to $0.85Hello✌
Let’s analyze Ethena’s upcoming price potential 📈.
BINANCE:ENAUSDT has demonstrated strong bullish momentum recently, supported by positive fundamental developments 📈. The price is currently near key daily and Fibonacci support levels. If these hold, a potential 30% upside targeting $0.85 looks likely 🚀.
✨We put love into every post!
Your support inspires us 💛 Drop a comment we’d love to hear from you! Thanks , Mad Whale