STELLAR LUMENS - DOLLAR COST AVERAGE FOR LONG TERM GAINSSTELLAR LUMENS (XLM) has taken off late 2024 from under .10 cents and now trading at .40 cents for a 400% Gain in 6 months so far, and there is much more upside to come potentially. It hit all time highs around .50 cents and now the token seems to want to test those highs in the near term 2025, we can easily see XLM approach $1.00 towards 2026 for a 100% gain and even higher longer term. Overall, XLM moves with XRP and we all know XRP is a blue chip project, it has all the funds and institutional backing, and so does XLM.
Both projects share a common creator in Jed McCaleb, however they have different focuses. Ripple, and its native token XRP, was initially designed to facilitate cross-border payments for financial institutions. Stellar, on the other hand, focuses on financial inclusion and aims to provide accessible financial services for individuals, including remittances and access to banking services.
CAN WE SAY BULLISH?! TO THE MOON!!!
Beyond Technical Analysis

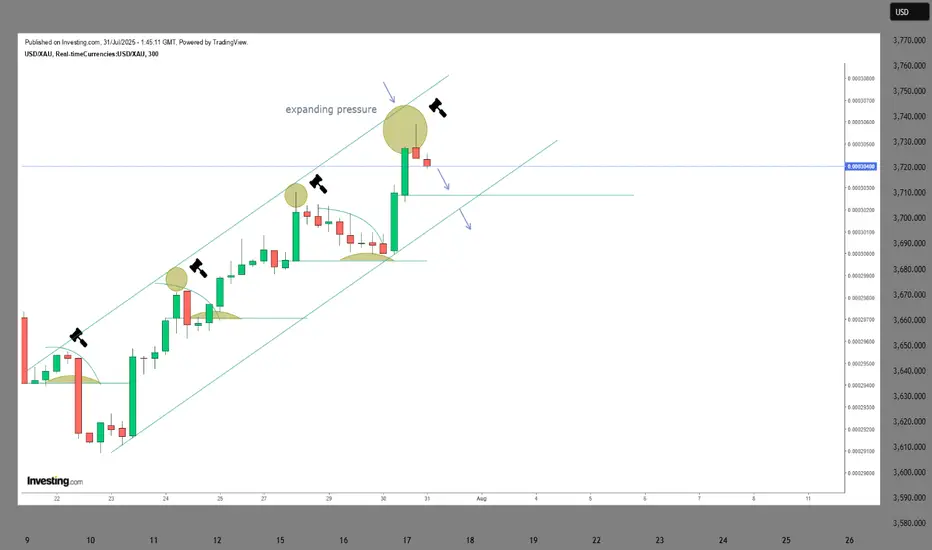
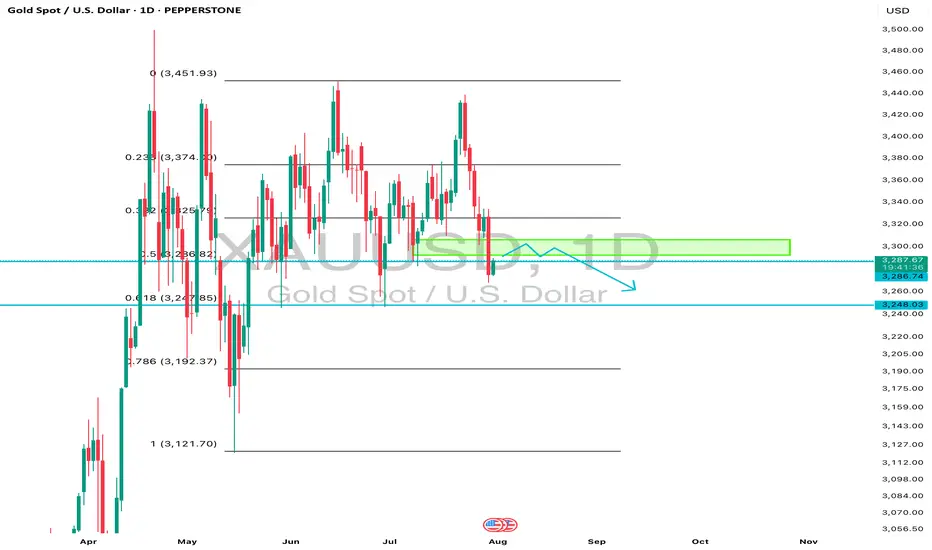
GOLD prep work to ATH retap has started. seed at 3270!First thing first.
Diagram above is in reverse metrics (USDXAU)
--------
GOLD, has been met with some well deserved respite on price growth after a series of parabolic highs this past few weeks. And this healthy trims are warranted in the grand scheme of things -- to sustain its upward trajectory. A price rest is definitely welcomed.
Now based on our latest daily metrics, gold is showing some low key hints of shift -- it may not be visible to 99% of traders -- but it is there now to magnify.
Diagram above is in reverse metrics (USDXAU). It is currently showing some pressure expansion for bears and hinting of prep work to reverse.
This is a precursor of a massive structure change-- for that elusive upside continuation.
On the daily metrics, we got some hop signals here as well from -- first one in a while. Price baselines detaching itself from the descending trend line. There maybe something here now. A good zone to seed on the most discounted bargain levels -- with safety.
Spotted at 3260.
Interim mid target: ATH at 3500
Long term. 4k++
Trade safely.
TAYOR.
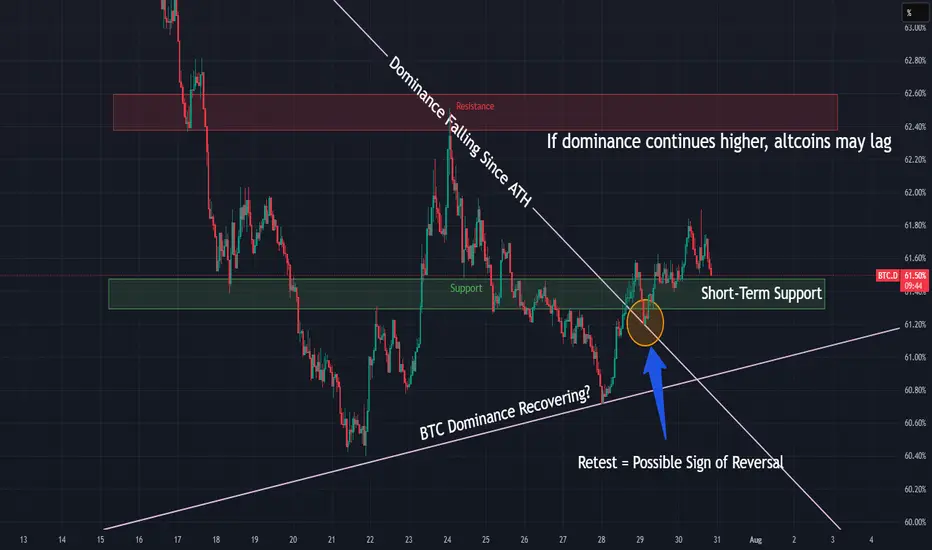
BTC Dominance Breaking Out — Rotation Incoming?BTC Dominance just broke a major downtrend and is holding above the breakout level — a possible shift in market control.
📌 If dominance continues higher, altcoins may lag
📌 Resistance zone at 62.5% could cap the move
⏱️ Timeframe: 1H
#btcd #bitcoin #altseason #dominance #marketcycle #quanttradingpro #tradingview
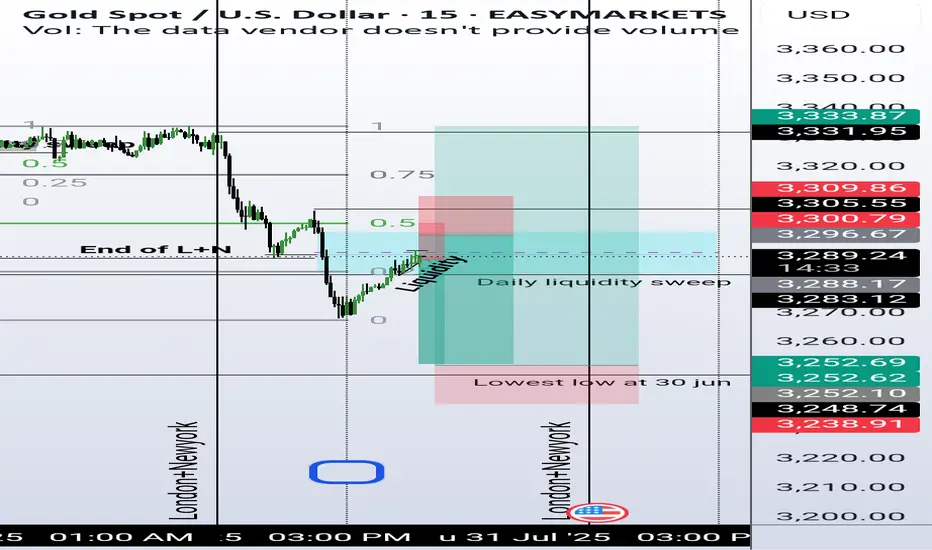
Sell at 3280 to 3240 buy at 3240 to 3400Gold is in a strong sell-off due to the volumes offered so that the strongest party, China, can buy from the maximum can bring them profits, which is the maximum point at June 30.
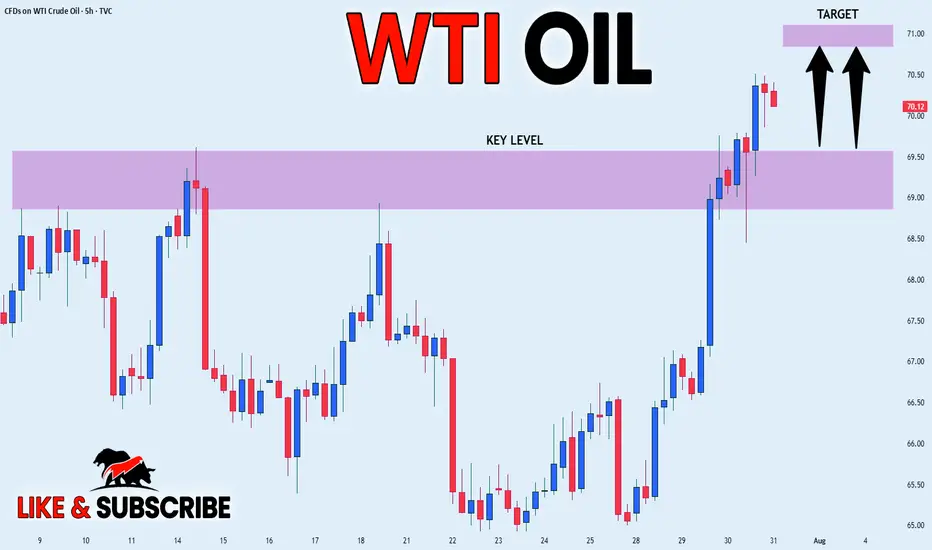
USOIL GROWTH AHEAD|
✅CRUDE OIL broke the key
Structure level of 69.50$
While trading in an local uptrend
Which makes me bullish biased
And I think that after the retest of the broken level is complete
A rebound and bullish continuation will follow
LONG🚀
✅Like and subscribe to never miss a new idea!✅
Disclosure: I am part of Trade Nation's Influencer program and receive a monthly fee for using their TradingView charts in my analysis.
BTCUSD – Descending Channel or Bullish Flag?BINANCE:BTCUSDT – Market Maker’s Game Inside a Descending Channel
Timeframe: 2H | MJTrading View
Market Structure Overview:
Bitcoin recently printed a new ATH at $122,000 after a parabolic run from the previous ATH at $111,937.
Since then, price has been consolidating inside a descending channel, which could act as a bullish flag in higher timeframes.
Liquidity pools are clearly formed:
Above $122K – resting stops of late shorts.
Below $115K–$114K – weak long stops and untapped demand near the Order Block (OB).
Key Levels & Liquidity Zones:
Upside:
$122K Liquidity Pool → If swept, could trigger momentum towards $124K–$125K.
Downside:
$116K OB → First defensive zone for bulls.
$112K Strong Support → Aligns with previous ATH breakout base.
Market Maker’s Dilemma:
If you were a market maker… which liquidity pool would you hunt first?
Price is coiling tighter within the channel, and both scenarios are possible:
Upside Sweep → Rapid breakout above $122K to clear shorts, then potential continuation.
Downside Sweep → Sharp drop into $116K–$112K liquidity, flushing longs before any recovery.
⚡ MJTrading Insight:
This is the classic market maker compression – first sweep likely determines direction.
Patience here is key; let the liquidity tell the story.
#BTCUSD #Bitcoin #Liquidity #SmartMoney #PriceAction #MJTrading #ChartDesigner #CryptoAnalysis
Psychology Always Matters:

Daily Analysis- XAUUSD (Thursday, 31st July 2025)Bias: Bearish
USD News(Red Folder):
-Average Hourly Earnings m/m
-Non-Farm Employment Change
-Unemployment Rate
-ISM Manufacturing PMI
Notes:
- No rate cut imposed, no decision made on September rate cut
- Looking for continuation to the downside
- Potential SELL if there's
confirmation on lower timeframe
- Pivot point: 3310
Disclaimer:
This analysis is from a personal point of view, always conduct on your own research before making any trading decisions as the analysis do not guarantee complete accuracy.
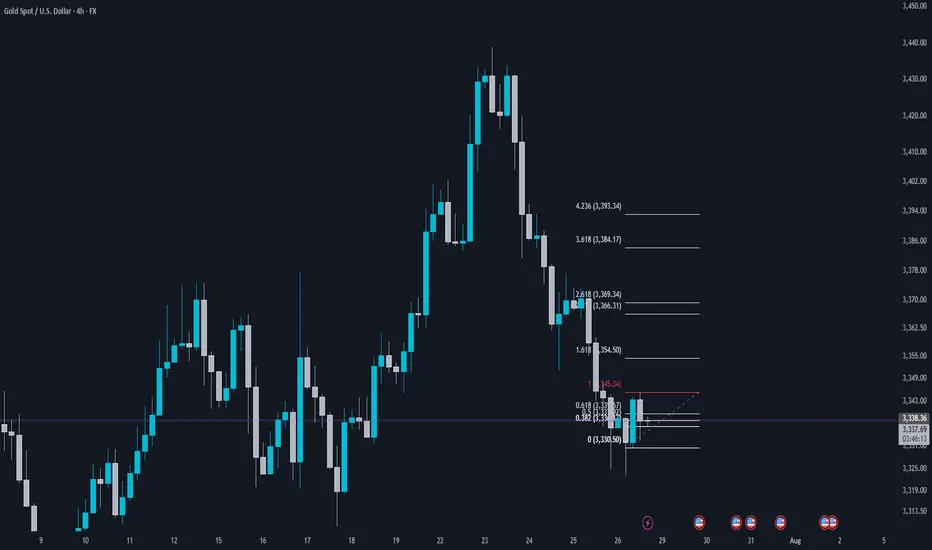
XAUUSD long day trade idea hello
day trading idea long up to 3372-3383 price zone
fibonaci levels , maybe 3390
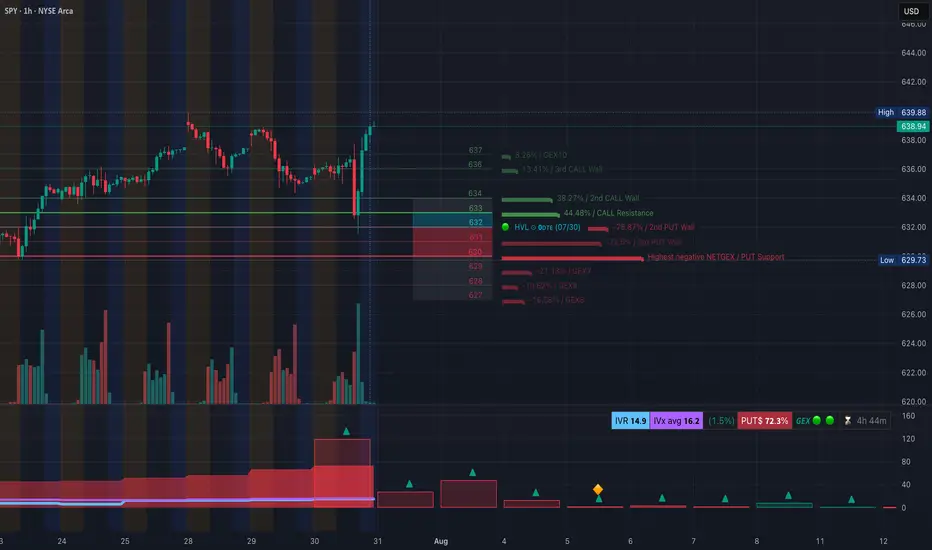
SPY Back from the Dead! Gamma Reclaim or One-Day Trap? Jul 31SPY Back from the Dead! Gamma Reclaim or One-Day Trap? 638 is the Battleground
🔍 GEX & Options Flow Insight (1st Image Analysis)
SPY surged off strong PUT support at ~630 and is now pressing into the CALL Resistance wall at 633–634, with upward momentum and a surprising gamma flip. However, it's running right into a stacked supply zone just below the next big Call Wall at 638.
* Call Walls & Resistance:
* 📍 633.78–634.34 → CALL Resistance + HVL zone
* 📍 636.39 → 2nd Call Wall (38.27%)
* 🧱 638.88–639.88 → GEX10 territory = squeeze potential, if bulls hold
* Put Support Zones:
* 🛡️ 632.00–631.00 → Flip zone from PUT-dominated to long gamma
* 🚨 629.73 → Highest negative NET GEX = anchor support
* 📉 626.19 → Breakdown risk zone
* Volatility Insight:
* IVR 14.9, IVx Avg 16.2 → Low volatility = cheap contracts
* PUTs Dominant at 72.3% = Dealer long gamma positioning
* GEX sentiment: 🟢🟢🟢 → Reversal confirmed into bullish territory
✅ Option Trading Suggestion:
Bias: Reversal long, but cautious at 638–640 resistance
Strategy: Vertical debit call spread or butterfly
* Entry Idea: Buy 636C / Sell 640C for Aug 2 or Aug 5 expiry
* Aggressive alternative: Naked 638C if breakout continues with volume
* Invalidation: Strong rejection + close back under 634
* Target: 638.88 → potential extension to 640–641.5
Why this works: SPY is squeezing dealers short from earlier PUT dominance. The reclaim above 633 into the gamma-neutral zone triggered forced hedging. If momentum holds above 636, short calls must be covered → squeeze scenario.
🧠 Technical Analysis (1H Chart) (2nd Image Analysis)
Market Structure & SMC:
* 🔄 CHoCH → BOS → CHoCH → BOS again = high volatility reversal sequence
* SPY just broke out of descending wedge and reclaimed supply
* Current price is inside a major supply zone (purple box 636–639)
Trendline Dynamics:
* Broken wedge trend now back-tested
* Price at upper channel boundary — watch for rejection or breakout confirmation
SMC Zones:
* 🟥 Supply Zone (Purple Box): 636–639.88 → historical resistance
* 🟩 Demand Zone: 631–632.5 → HVL flip zone + previous OB
* 🚨 Breakdown below 629.73 → back into bearish territory
🔄 Price Action & Key Levels
* Support:
* ✅ 634.34 → 633.78 → Flip zone from gamma trap
* ✅ 631.00 → 629.73 → OB + Put Wall cluster
* 🔻 626.19 → Final support before further downside opens
* Resistance:
* 🚩 636.39 → 638.88 → Multiple Call Walls + supply
* 🧱 641.65 → Next upside zone = GEX extension if breakout
🧭 Scalping / Intraday Trade Setup
🟩 Bullish Setup (Preferred Now):
* Entry: 634.00–635.00 breakout hold
* Target 1: 638.00
* Target 2: 641.00
* Stop: Below 632
🟥 Bearish Fade Setup:
* Entry: Rejection at 638.88 + high-volume stall
* Target 1: 634.50
* Target 2: 631.50
* Stop: Breakout above 640
🔁 Summary Thoughts
* SPY is in recovery mode, reversing from a gamma-led flush and now facing resistance at a stacked CALL wall zone.
* Dealer positioning flipped positive. If bulls hold above 636, 640+ is realistic.
* However, failure to break 638.88 will turn this into a short squeeze fade.
* Scalpers can ride the momentum if price consolidates above 634. Rejection at 638 is the line between breakout and fakeout.
🚨 Disclaimer:
This analysis is for educational purposes only and does not constitute financial advice. Always do your own research and manage your risk accordingly.
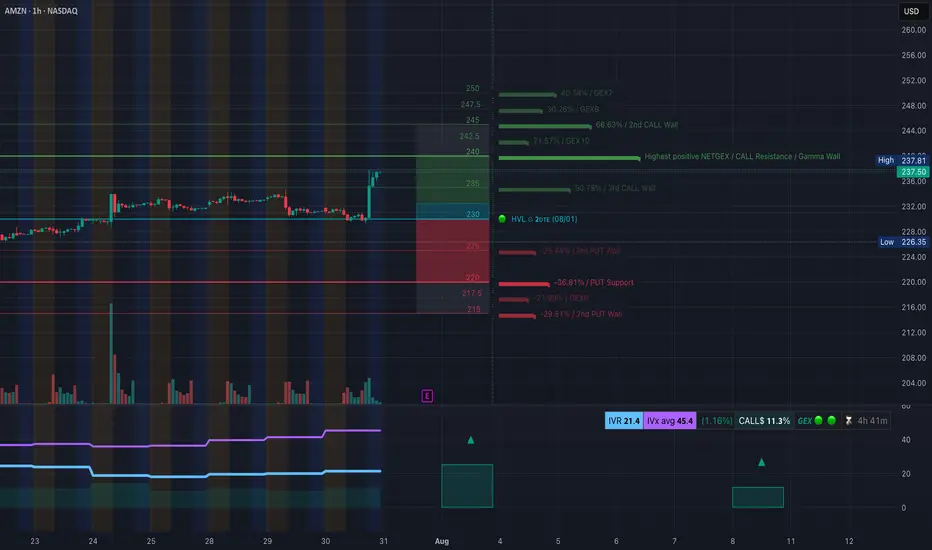
AMZN Launches Out of Trap Zone! What's next on Jul 31AMZN Launches Out of Trap Zone! Will Gamma Push Us to 245+ or Fakeout from Supply?
🔍 GEX & Options Flow Insight (1st Image Analysis)
AMZN broke out aggressively from a coil and is now trading at $237.50, right under the Gamma Wall and 2nd Call Wall. Gamma positioning shows bullish momentum potential, but current price is sitting just beneath the highest resistance zone.
* Call Walls & Resistance:
* ✅ $237.50–240.00 → 2nd Call Wall (66.63%) and Gamma Wall
* 📍 $245–247.5 → GEX8 / GEX7 → Final gamma expansion ceiling
* Put Support Zone:
* 🛡️ $231.01–230.31 → Immediate bounce zone
* 🔻 $225 / 222.18 → 3rd PUT Wall and true gamma defense layer
* Strong PUT flow at ~217.5 → Risk level for breakdown
* Volatility Insight:
* IVR: 21.4, IVx Avg: 45.4 → Normal volatility, not overly juiced
* Call flow only 11.3% = moderate bullish, not euphoric
* GEX status: 🟢🟢🟢 → Full bullish gamma support
✅ Option Trading Suggestion:
Bias: Bullish continuation above 234.00, but cautious at 237.50–240
Strategy: Debit Call Spread (conservative)
* Entry Idea: Buy 235C / Sell 240C (Aug 2 or Aug 9 expiry)
* Invalidation: Rejection below 233.20 or bearish engulfing under 231
* Target: 240 → 245 zone on squeeze
Why this works: Gamma positioning is stacked toward the upside and dealers are likely still short calls. Price just reclaimed the entire prior range — breakout traders are being trapped if this stalls under 238. If bulls stay above 234.72, a move toward 245 is likely.
🧠 Technical Analysis (1H Chart) (2nd Image Analysis)
Market Structure & SMC:
* ✅ CHoCH → BOS → 2nd CHoCH → strong BOS confirmed with today’s breakout
* 🚀 Price ripped out of descending wedge + liquidity trap below 230
* Purple Supply Zone (237.5–240) now in play as potential final resistance
Trendline Analysis:
* Long-term wedge broken to the upside
* Channel upper bound rising into 240–245 zone
SMC Zones:
* 🟩 Demand / OB Zone: 230.00–231.01 → Major flip zone
* 🟥 Supply Zone (Purple Box): 237.50–240.00 → If rejected, will trap late bulls
🔄 Price Action & Key Levels
* Support:
* ✅ 234.00–234.72 → Local structure support
* ✅ 231.01–230.31 → Flip zone and invalidation level
* 🔻 222.18 → 3rd PUT Wall → downside defense
* Resistance:
* 🚩 237.5–240.00 → Gamma Wall and supply resistance
* 🚀 245.00–247.50 → Final GEX extension zone
🧭 Scalping / Intraday Trade Setup
🟩 Bullish Setup:
* Entry: 234.50–235.50 (on retest)
* Target 1: 238.00
* Target 2: 240.00 → 245.00 extension
* Stop: Under 231.00 (invalidation)
🟥 Bearish Pullback Setup:
* Entry: Rejection at 237.50–238.00
* Target 1: 234.00
* Target 2: 231.50
* Stop: Close above 240
🔁 Summary Thoughts
* AMZN printed a clean breakout with volume, reclaiming full structure from CHoCH.
* GEX layout supports bullish continuation with targets toward 245 if 238–240 breaks.
* Price is in the final squeeze zone — gamma momentum + dealer hedging = fuel.
* Caution for late bulls: if AMZN stalls here and breaks under 233, it’ll retrace fast to 230–228.
🚨 Disclaimer:
This analysis is for educational purposes only and does not constitute financial advice. Always do your own research and manage your risk accordingly.
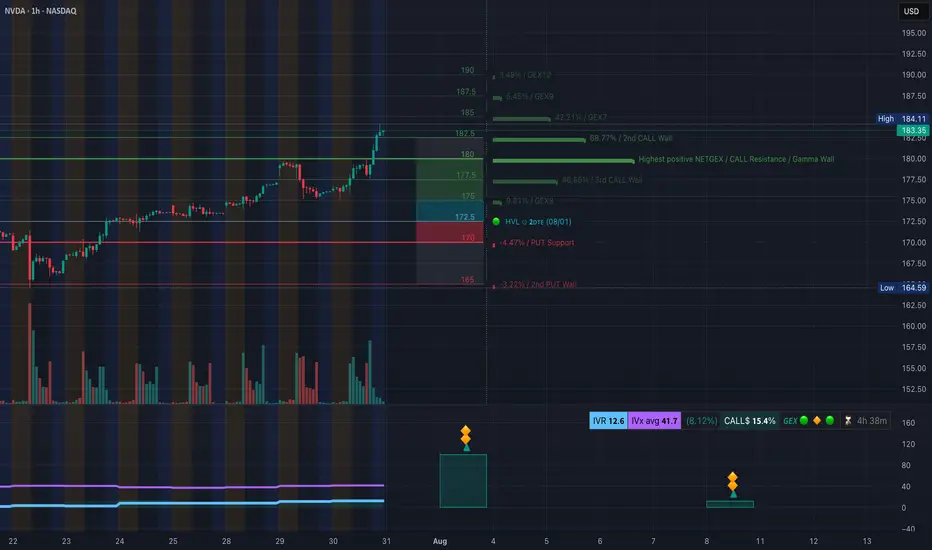
NVDA Squeezes to $187 or Pullback from Supply? Jul 31NVDA Explodes into Gamma Cloud! Squeeze to $187 or Pullback from Supply?
🔍 GEX & Options Flow Insight (1st Image Analysis)
NVDA just broke through major resistance and is trading at $183.35, sitting in the middle of stacked Call Walls and a strong positive GEX zone. Gamma positioning is highly bullish—but a stall near current levels is possible as dealers begin to hedge less aggressively.
* Call Walls & Resistance:
* ✅ $180.00 → Highest positive NET GEX zone
* ✅ $182.5 → 2nd Call Wall (68.77%) — current area of battle
* 🧱 $187.5–190.0 → GEX9 and GEX10 zones = possible squeeze targets
* Put Support:
* 🛡️ $175.18–175.51 → Strong PUT Support zone and demand on price chart
* 🔻 $172.5 → HVL zone = invalidation for breakout thesis
* Volatility Insight:
* IVR 12.6, IVx Avg 41.7 → Neutral-to-low IV
* Calls Bias: 15.4% → Slightly bullish, but not euphoric
* GEX sentiment: 🟡🟢🟢 = Cautiously Bullish
✅ Option Trading Suggestion:
Bias: Bullish with caution around 185
Strategy: Vertical debit call spread
* Entry Idea: Buy 182.5C / Sell 187.5C for Aug 2 or Aug 9
* Stop: Close below 179.65 (trap candle base)
* Target: 187.5 (GEX9 ceiling)
Why this works: NVDA is entering a highly stacked gamma region. If bulls hold above 182.5, momentum may carry price toward the outer GEX bands at 187.5. However, IV is not stretched, so premium decay is a risk—spreads protect against it.
🧠 Technical Analysis (1H Chart) (2nd Image Analysis)
Market Structure & SMC:
* ✅ CHoCH → BOS → BOS confirmed since July 29
* 🚀 Strong bullish continuation from discounted OB area near 175
* NVDA is currently riding mid-upper range of an ascending channel
Trendlines:
* Perfect channel structure respected since July 25
* Currently touching upper channel resistance around 183.35–184.50
SMC Zones & Supply/Demand:
* 🟩 Demand Zone: 175.18–177.32 → Last bullish OB
* 🟥 Supply/Exhaustion Zone: 183.5–185 (purple box) → caution here
🔄 Price Action & Key Levels
* Support:
* 📌 179.65 → Key structure base (trap candle)
* ✅ 177.32–175.18 → Demand + OB + GEX Put Support
* ❗ Below 172.5 = structure breaks
* Resistance:
* 🚩 183.35–185.00 → Supply + top channel + GEX7
* 🧨 187.5–190.0 → GEX9/GEX10 extension zone = possible parabolic breakout
🧭 Scalping / Intraday Trade Setup
🟩 Bullish Setup (Preferred):
* Entry: 182.50–183.00 breakout
* Target 1: 185.00
* Target 2: 187.50
* Stop: 179.65 break & hold
🟥 Bearish Pullback Setup:
* Entry: Rejection at 184.5 supply zone
* Target 1: 180.00
* Target 2: 177.30
* Stop: New high above 185.5
🔁 Summary Thoughts
* NVDA is showing classic breakout behavior with gamma fuel behind the move.
* SMC and structure are fully bullish, supported by rising channel and BOS continuation.
* Price is approaching a key exhaustion zone, so either it breaks through to 187.5 or pulls back to retest 179–177.
* Intraday long trades are favored above 182.5. Swing traders should wait for a dip to demand or a clean breakout above 185.
🚨 Disclaimer:
This analysis is for educational purposes only and does not constitute financial advice. Always do your own research and manage your risk accordingly.
TSLA Breaks Bull Structure - Gamma Trap or Breakdown? Jul 31TSLA Breaks Bull Structure — Gamma Trap or Breakdown? Watch 315/300 Closely!
🔍 GEX & Options Flow Insight (1st Image Analysis)
TSLA is trading at $317.82, having just lost support at the 2nd Call Wall ($322.5) and now hovering near key PUT Wall clusters. Options positioning reveals strong downside pressure unless bulls reclaim 321+.
* Call Walls / Resistance:
* 📍 $322.5 → 2nd Call Wall (73.94%) — recently rejected
* 📍 $324.5–328 → Heavy net GEX zones and dealer resistance
* 📍 $336–338 → 3rd Call Wall + GEX9 — parabolic ceiling
* Put Walls / Gamma Risk Zone:
* 🔻 $316.0 / $312.0 → GEX transition zone (dealer flip risk)
* 🔻 $305.0 / $300.4 → Major PUT Support (73.87%) and HVL demand
* Extreme risk below $300 → Gamma cascade toward $290
* Volatility Insight:
* IVR 6.7, IVx Avg 52.9 → Low relative IV = cheap options
* Call Bias: 44.8% → Dealers still net short calls, but flows are softening
✅ Option Trading Suggestion:
Bias: Leaning bearish below 321.2, bearish confirmation under 315
Strategy: Bearish vertical or put debit spread
* Entry Idea: Buy 315P / Sell 305P for Aug 2 or Aug 9 expiry
* Aggressive alt: Naked 310P or 305P if breakdown confirmed
* Invalidation: Reclaim 321.20 with volume = close or reverse
Why this works: Dealer gamma exposure has flipped to negative under 316. If TSLA fails to hold above 315, dealers must hedge by selling into weakness, potentially accelerating downside toward 300.4–305.
🧠 Technical Analysis (1H Chart) (2nd Image Analysis)
Market Structure & SMC:
* 🟥 Recent CHoCH confirmed on July 30 — bearish shift
* ❌ Failed to hold BOS structure from July 29 → trendline break
* ⚠️ Currently retesting broken structure as resistance (321.20–324.50)
Trendline Dynamics:
* 📉 Break below upward sloping trendline confirmed → downside pressure
* New bearish structure forming lower highs under OB zone
SMC Zones & Reversal Blocks:
* 🔴 Supply Zone (Purple Box): 321.2–324.5 → Rejected twice, now acting as resistance
* 🟩 Demand Zone (Green Box): 312–315.25 → Minor bounce zone; if fails, opens flush to 305–300
🔄 Price Action & Key Levels
* Support Levels:
* 🔻 315.25 → 312.00 → Minor demand + retest zone
* ⚠️ 300.41 → PUT Support + HVL zone (gamma wall)
* 🚨 Below 300 = fast move to 290
* Resistance Levels:
* 🚫 321.20 → 324.50 → Supply zone (order block + 2nd Call Wall)
* 🧱 330.48 → 336 → Next upside wall if bulls reclaim trend
🧭 Scalping / Intraday Trade Setup
🟥 Bearish Scenario (Preferred for Now):
* Entry: 316.00–317.00 rejection
* Target 1: 312.00
* Target 2: 305.00
* Stop: 321.50 reclaim
🟩 Bullish Reversal Scenario (Low Probability):
* Entry: Only on breakout and close above 324.50
* Target: 330.00 → 336.00
* Stop: 321 intraday flip back down
🔁 Summary Thoughts
* TSLA broke bullish market structure with a clean CHoCH and is now trading under OB resistance.
* Gamma positioning supports further downside if price stays under 321.
* Strong Put Walls at 305–300 create a natural magnet if breakdown continues.
* Option premiums are relatively cheap — attractive for directional plays.
* Scalpers and swing traders can ride the downside with tight stops; bulls must wait for reclaim above 324.
🚨 Disclaimer:
This analysis is for educational purposes only and does not constitute financial advice. Always do your own research and manage your risk accordingly.

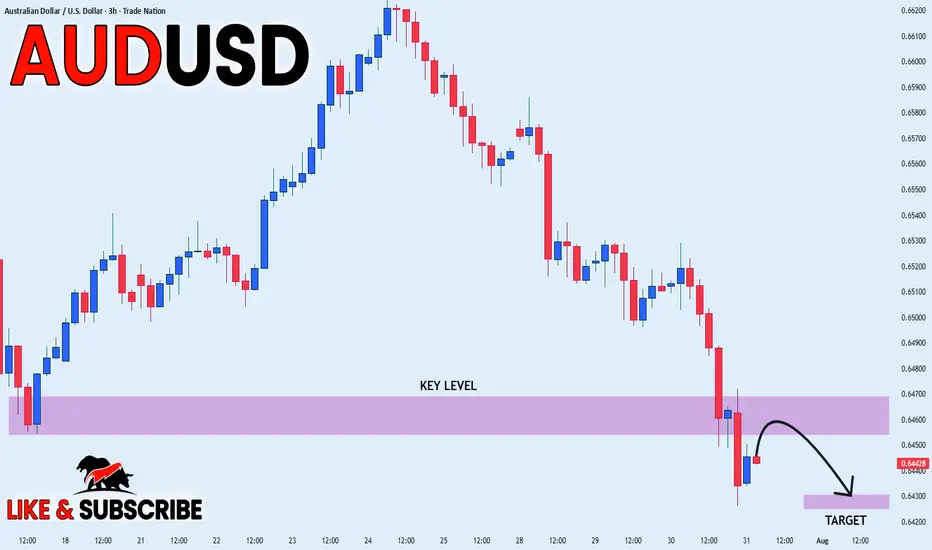
AUD_USD BEARISH BREAKOUT|SHORT|
✅AUD_USD broke the key
Structure level of 0.6460
While trading in an local downtrend
Which makes me bearish
And I think that after the retest of
The broken level is complete
A bearish continuation will follow
SHORT🔥
✅Like and subscribe to never miss a new idea!✅
Disclosure: I am part of Trade Nation's Influencer program and receive a monthly fee for using their TradingView charts in my analysis.
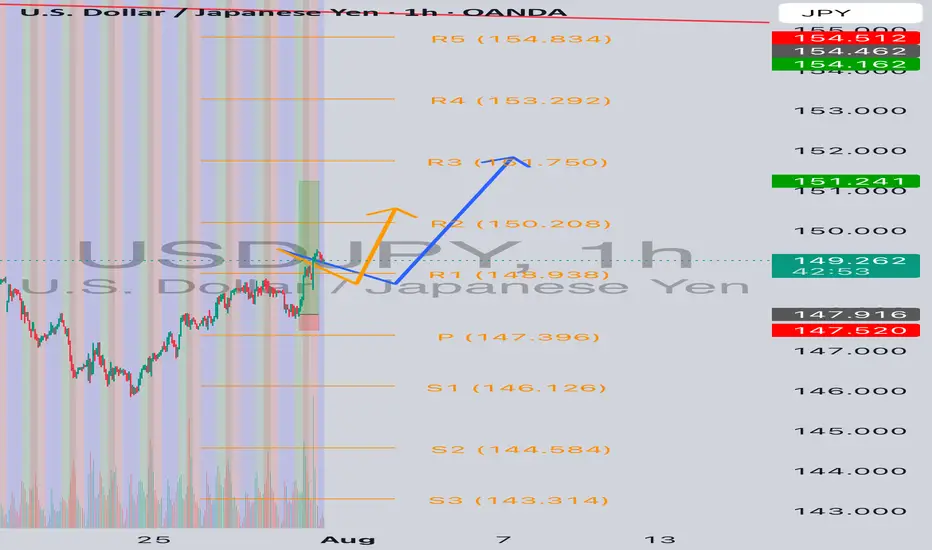
USDJPYMaintaining Long Bias On UJ. Targetted price prediction are the orange and blue arrow for both TP1 and TP2
Trade safe and manage you risk wisely
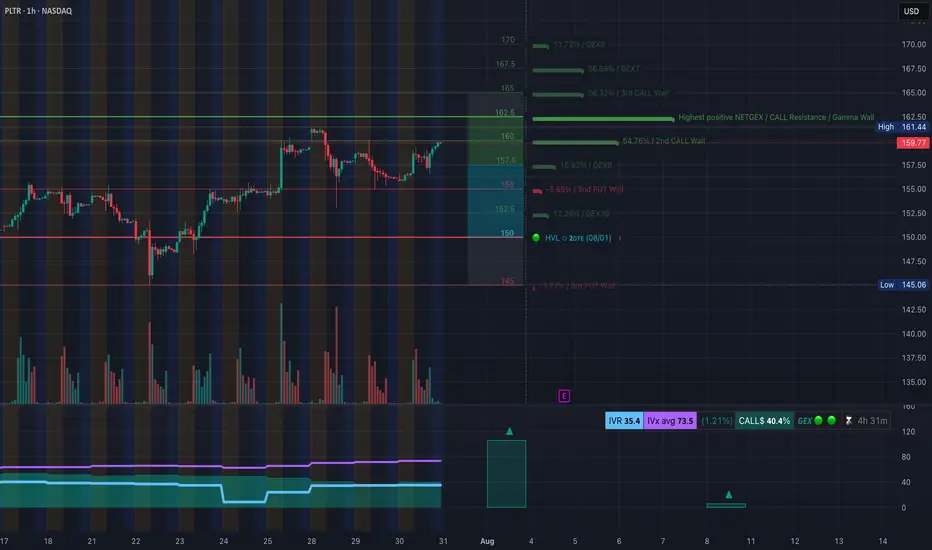
PLTR Breaking Out or Bull Trap? Jul 31PLTR Breaking Out or Bull Trap? Options Flow Says Bulls Might Win!
🔍 GEX & Options Flow Insight (1st Image Analysis)
PLTR is pushing into key resistance around $159.77, just under the 2nd CALL Wall at $161.44, with massive gamma clusters building overhead. Here's the breakdown:
* Call Walls & Gamma Resistance:
* 📍 $159.77 → Current wall that price is testing
* 📍 $161.44 → 2nd CALL Wall / Highest positive NET GEX
* 📍 $165–168 → 3rd Call Wall and deeper GEX levels = high resistance/squeeze potential
* Put Support Zones:
* 🔻 $155.00 / $153.00 / $151.06 → Multiple layers of liquidity and support
* 🛡️ $145.00 → 3rd PUT Wall = Strong downside defense
* Volatility Metrics:
* IVR: 35.4, IVx Avg: 73.5 → High IV suggests elevated premium
* Calls Flowing Heavy (40.4%), Bullish GEX 🌕🟢🟢
* Options sentiment is decisively bullish with strong open interest at upper walls
✅ Option Trading Suggestion:
Bias: Bullish momentum with caution at overhead resistance
Strategy: Debit Call Spread or Vertical Fly
* Entry Idea: Buy 160C / Sell 165C (or 168C) for Aug 2 or Aug 9
* Risk: Price must hold above $156.24 to remain valid
* Target: $161.44 → $165.00 if gamma squeeze plays out
Why this works: PLTR is pressing into a GEX transition zone. If price breaks through $161.44 with volume, dealers will likely hedge net short exposure by buying more, pushing toward $165+. But risk is tight — failure to break 160 convincingly can lead to fast reversal.
🧠 Technical Analysis (1H Chart) (2nd Image Analysis below)
Market Structure & SMC:
* ✅ CHoCH → BOS confirmed mid-July, with aggressive bullish structure
* ⚠️ CHoCH again on July 30 = possible trap or reload
* Price now retesting previous BOS zone under supply
Trendline Analysis:
* Ascending trendline holding support from July 29 to now
* Price approaching upper wedge resistance around $160–161
SMC Zones:
* Order Block Support: Around 156.24–154.91
* Reversal Zone / Supply: Purple box between 159.77–161.44 → Caution for fakeout traps
* Below 153.06, liquidity opens to HVL gap zone at 151–145
🔄 Price Action & Key Levels
* Support:
* ✅ 156.24 → Critical order block + trendline confluence
* ✅ 154.91 → Confirmed demand wick
* 🔻 151.06 → Liquidity base
* ⚠️ 145.00 → 3rd PUT Wall (GEX-based demand)
* Resistance:
* 🔼 159.77–161.44 → Major supply + 2nd Call Wall = high-conviction resistance
* 🚀 165.00 → Next wall for gamma expansion
* 🧨 Above that → Blowoff zone (168+)
📉 Bearish Reversal Zone
If price fails to close above 160 or gets rejected from 161.44, watch for:
* Breakdown to 156.24 → If this fails, opens up to 154.91 then sweep to 151.06
* Options IV is high → risk of premiums collapsing on rejection, so avoid chasing long OTM calls
🔁 Summary Thoughts
* PLTR is coiling tightly under a strong gamma ceiling with a bullish structure intact.
* Option flow shows aggressive CALL positioning, suggesting bulls are betting on breakout.
* Smart money might be stacking up before pushing through 161.44 — or could trap retail and unwind.
* Day traders can long above 157.5–158 on dips toward 160–161.44. Swing traders should avoid entries until breakout confirmation or dip to OB.
* Watch gamma squeeze to 165 if bulls break structure.
🚨 Disclaimer:
This analysis is for educational purposes only and does not constitute financial advice. Always do your own research and manage your risk accordingly.
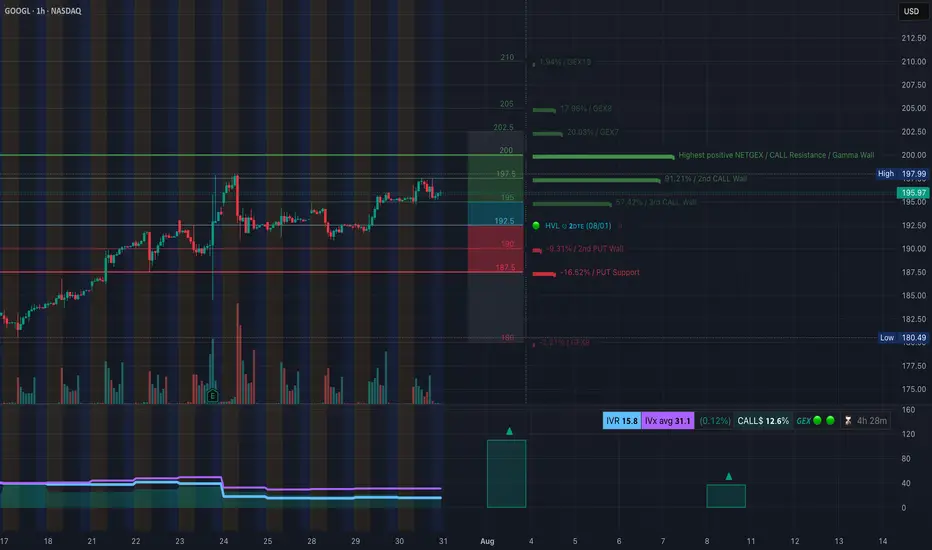
GOOGL Eyeing Gamma Squeeze to $202? Jul 31GOOGL Eyeing Gamma Squeeze to $202? Smart Money Sets the Trap!
🔍 GEX & Options Flow Insight
GOOGL is trading around $196 and sitting just under the 2nd Call Wall at $197.5, with a visible Gamma Wall / Resistance around the psychological $200 level. Here's how GEX is positioned:
* Call Walls:
* 📍 $197.5 → Current hot zone (2nd CALL Wall — 91.21%)
* 📍 $200.00 → Highest Positive NET GEX / Gamma Resistance
* 📍 $202.5 and above → Extreme GEX buildup with potential squeeze fuel
* Put Support:
* 🚨 $188.41 → Strong PUT Support (−16.52%)
* 🔻 Below that: Risk increases toward $187.5 (major demand zone)
* Volatility Context:
* IVR 15.8 and IVx Avg 31.1 → IV is relatively low
* Calls Outweigh Puts (12.6%) → Bullish GEX skew
* Green GEX, Green Sentiment, Long Gamma Zone Active
✅ Option Trading Suggestion:
Bias: Moderately bullish with potential for gamma-driven breakout
Strategy: Debit Call Spread or Naked Call if aggressive
* Entry Idea: Buy GOOGL 195C / Sell 200C (or 202.5C) for Aug 2 or Aug 9 expiration
* Risk: Tight invalidation below 194.50 (under price structure)
* Target: $200–202.5 (Gamma Wall exhaustion)
Why this works: Price is coiled just under a heavy call wall. If GOOGL pushes above $197.5 with volume, gamma hedging can amplify the move to $200+ — where dealers are net short calls and may have to buy shares to hedge.
🧠 Technical Analysis (1H Chart)
Market Structure:
* ✅ Bullish Break of Structure (BOS) confirmed on July 29
* ⚠️ Change of Character (CHoCH) seen on July 30 with a mild pullback
* Currently trading inside a rising channel, respecting trendline support
Trendline:
* Upper trendline rejection seen at ~198
* Lower channel support aligning near 195–195.5
Smart Money Concepts (SMC):
* Order Block Zone formed around 195.75–195.97 = current support
* Premium/Discount zone separation validates possible retest and continuation
* Purple Box = Supply Zone → Sellers active below 198.50
🔄 Price Action & Key Levels
* Support Zones:
* 📌 195.75–195.97 → Order block + Trendline
* 📌 194.91 → Minor support + fib confluence
* 🚨 191.56–190.85 → Liquidity pocket below CHoCH
* Resistance Zones:
* 🚩 197.5–198.5 → Call Wall + Prior swing highs
* 🔼 200.0–202.5 → Gamma squeeze zone / possible parabolic move
📉 Bearish Reversal Zone
If GOOGL fails to reclaim 197.5 or gets rejected again at 198.5:
* Expect retracement toward 195.7 → 194.91
* Breakdown below 194.91 → Opens test of CHoCH zone and fills inefficiency to 191–192 range
🔁 Summary Thoughts
* GOOGL is consolidating near a high-conviction breakout zone.
* GEX flow favors bullish continuation with strong gamma clustering above.
* Smart Money has already swept liquidity and flipped structure; bulls are in control if they defend the OB.
* Scalpers can long dips to 195.75 with stop under 194.91, targeting 198–202.
* Avoid calls above 202.5 unless new GEX builds show extended flow.
🚨 Disclaimer:
This analysis is for educational purposes only and does not constitute financial advice. Always do your own research and manage your risk accordingly.
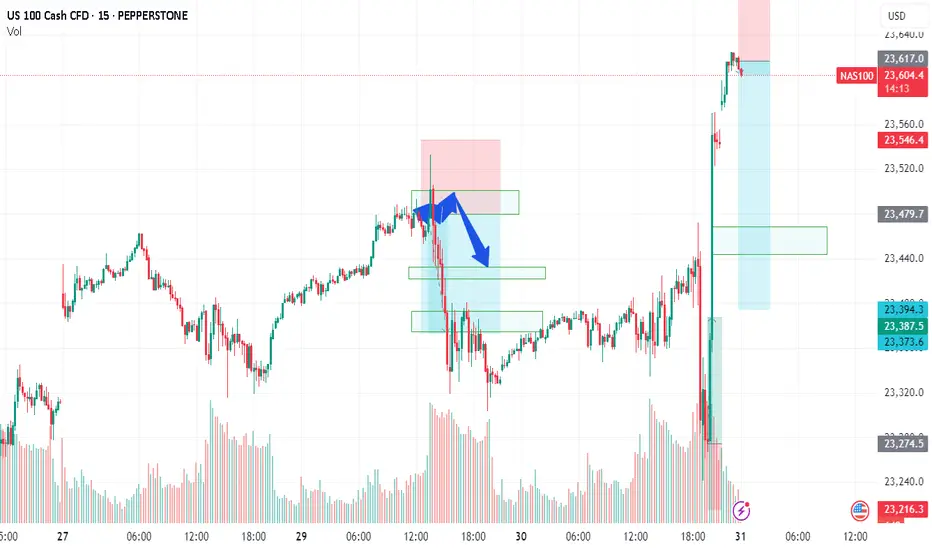
NAS - LET'S MAKE MILLIONS Team, last night NAS I was expect the FALL BACK as I predicted rate un-change will get NASTY on both DOW AND NAS.
So I have a set up entry LONG, i didnt expect the NAS flying to the moon.
both target hit so fast in 15 minutes
However, today is another opportunity to SHORT NAS on the current market at 23613-23625
STOP LOSS AT 23720
Once the NAS pull back toward 23580-65 - BRING STOP LOSS TO BE
TARGET 1: at 23540-20
TARGET 2: at 23480-65
LETS GO
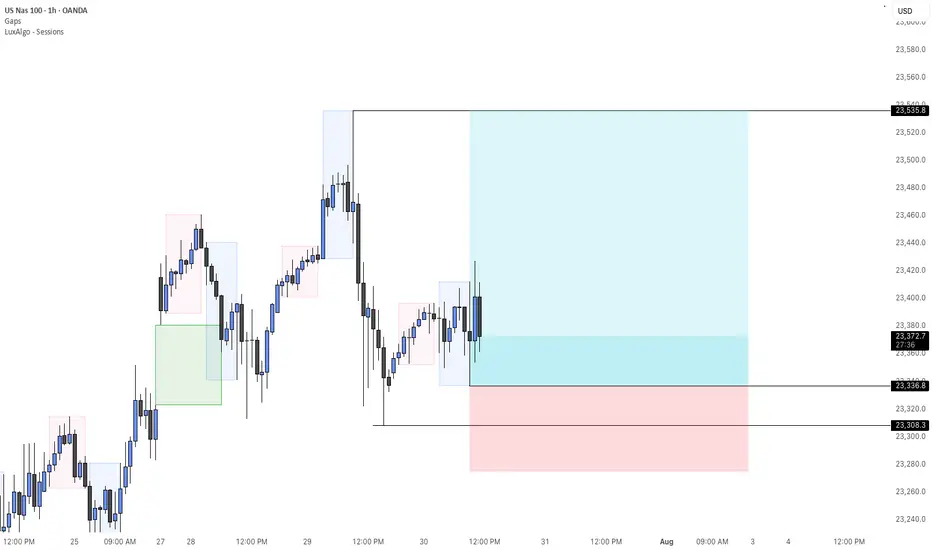
Short idea!Hey all. as you see market returned from middle of no-where and the response will be right at the LOZ. it is sort of risky because the LOZ candle covered by the next candle. It makes the Zone less efficient but it is still powerful. be happy (wink)

NAS - LONGWaiting to see how news affects the markets today. IF we hold this area and we get confirmation that buyers are taking over. I will enter long and target previous highs.
Important Volatility Period: August 2nd - 5th
Hello, fellow traders!
Follow us for quick updates.
Have a great day!
-------------------------------------
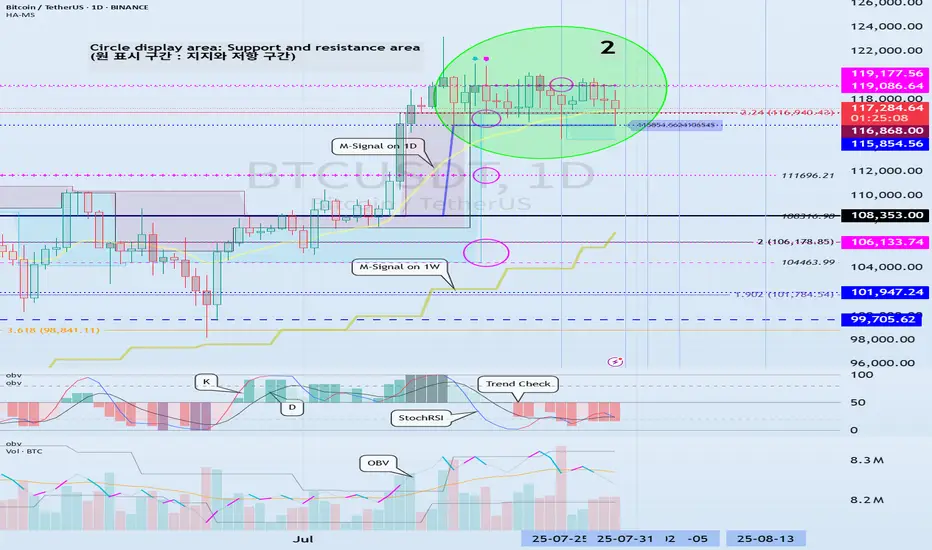
(BTCUSDT 1M Chart)
Let's take a moment to check the trend before the new month begins.
There have been two major declines so far, and a third major decline is expected next year.
For the reason, please refer to the "3-Year Bull Market, 1-Year Bear Market Pattern" section below.
-
My target point for 2025 is around the Fibonacci ratio of 2.618 (133889.92).
However, if the price surges further, it could touch the Fibonacci range of 3 (151018.77) to 3.14 (157296.36).
If it rises above 133K, it's expected that prices will never fall below 43823.59 again.
Since the HA-Low indicator hasn't yet been created on the 1M chart, we need to monitor whether it appears when a downtrend begins.
Based on the current trend, the HA-Low indicator is expected to form around 73499.86.
More details will likely be available once the movement begins.
-
The basic trading strategy involves buying in the DOM(-60) ~ HA-Low range and selling in the HA-High ~ DOM(60) range.
However, if the price rises above the HA-High ~ DOM(60) range, a step-up trend is likely, while if the price falls below the DOM(-60) ~ HA-Low range, a step-down trend is likely.
Therefore, the basic trading strategy should be a segmented trading approach.
The further away from the HA-High indicator, the more likely it is that the DOM(60) indicator will act as a strong resistance when it forms.
Therefore, if the current price and the HA-High indicator are trading far apart, and the DOM(60) indicator forms, it is expected to face significant resistance.
-
Looking at the current trend formation, the high trend line is drawn correctly, but the low trend line is not.
This is because the StochRSI indicator failed to enter the oversold zone.
Therefore, the low trend line is marked with a dotted line, not a solid line.
Therefore, what we should pay attention to is the high trend line.
We need to see if the uptrend can continue along the high trend line.
-
(1D chart)
If we use the trend lines drawn on the 1M, 1W, and 1D charts to predict periods of volatility, the periods around August 5th and August 13th are significant periods of volatility.
By breaking this down further, the volatility periods are around July 31st, August 2nd-5th, and August 13th.
Therefore, trading strategies should be developed based on the assumption that the volatility period extends from July 30th to August 14th.
The current price is moving sideways in the 115,854.56-119,177.56 range.
This range, the HA-High ~ DOM (60), is a crucial area to consider for support.
This will determine whether the price will continue its upward trend by rising above 119,177.56, or whether it will turn downward by falling below 115,854.56.
If the price falls below 115854.56, it is expected to meet the M-Signal indicator on the 1W chart and reestablish the trend.
The HA-High indicator on the 1W chart is forming at 99705.62, and the DOM (60) indicator on the 1W chart is forming at 119086.64.
Therefore, when the price declines, it is important to check where the HA-High indicator on the 1W chart forms and determine whether there is support near that point.
-
The On-Board Value (OBV) indicator within the Low Line ~ High Line channel is showing a downward trend.
If the OBV falls below the Low Line, the price is expected to plummet.
Therefore, it is necessary to closely monitor the movements of the OBV indicator.
The Trend Check indicator is a comprehensive evaluation of the StochRSI, PVT-MACD Oscillator, and On-Board Value (OBV) indicator.
The TC (Trend Check) indicator interprets a rise from the 0 point as a buying trend, while a decline indicates a selling trend.
In other words, a rise from the 0 point is likely to indicate an uptrend, while a decline is likely to indicate a downtrend.
Currently, the TC (Trend Check) indicator is below the 0 point, suggesting a high probability of a downtrend.
However, if the TC (Trend Check) indicator touches a high or low, the trend may reverse.
In other words, touching a high increases the likelihood of a reversal from an uptrend to a downtrend, while touching a low increases the likelihood of a reversal from a downtrend to an uptrend.
When such movements occur, it's important to consider the support and resistance levels formed around the price level to determine a response.
In other words, consider the support and resistance levels formed at the current price level.
As a significant period of volatility approaches, prepare to transition from box trading to trend trading.
-
Thank you for reading to the end.
I wish you successful trading.
--------------------------------------------------
- Here's an explanation of the big picture.
(3-year bull market, 1-year bear market pattern)
I'll explain more in detail when the bear market begins.
------------------------------------------------------
Dow jonesDow Jones daily analysis
Time frame daily
Risk rewards ratio >3.5
Short position
Because price couldn't break the 45.048 again and earthquake in 5he east of Russia and Japan makes the markets drop down

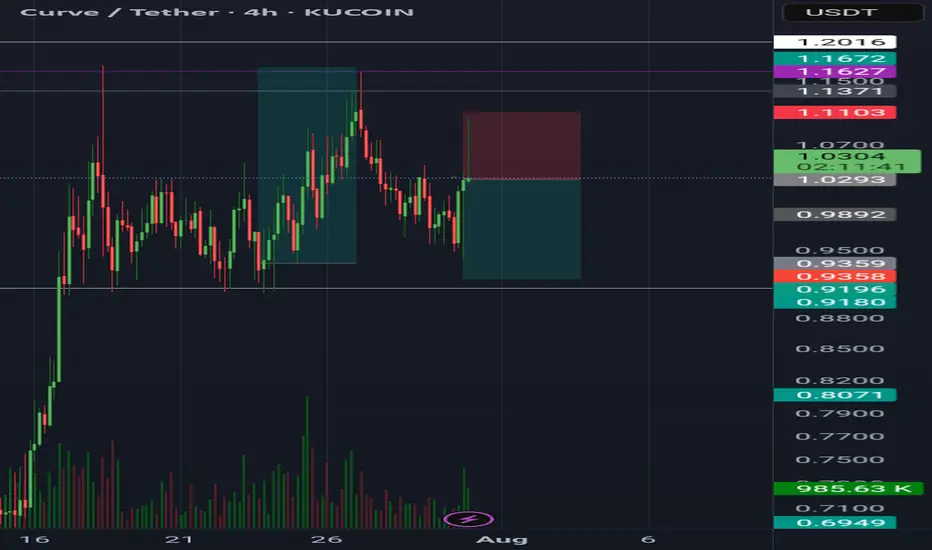
CurveCrv usdt daily analysis
Time frame 4 hours
Risk rewards ratio >1.3
Target 0.92$
Short position because of earthquake in the Russia
RDDT Earnings Play — July 30 (BMO)
## 🚀 RDDT Earnings Play — July 30 (BMO)
**🎯 Bullish Call Trade | 75% Confidence | High Momentum Setup**
---
### 📈 REDDIT, INC. (RDDT) – EARNINGS SNAPSHOT
🧠 **Revenue Growth**: +61.5% TTM — AI + Ads combo paying off
💸 **Margins**:
• Gross: 90.8% ✅
• Op: 1.0% 🚩
• Profit: 8.1% 👍
🧾 **EPS Surprise Streak**: ✅ 5 for 5 | Avg. +191%
🎯 **Target Price**: \$155.58 (+9.5%)
⚖️ **Forward P/E**: 222.6 — Rich but justified?
**Score: 8/10**
📊 Sector: Comm Services (AI-driven tailwinds)
---
### 💥 OPTIONS FLOW SNAPSHOT
💰 Calls Stack at \$150 & \$160
🛡️ Puts cluster \$140–\$149 = Hedges, not bearish bets
📉 IV High = Juicy premiums
📈 Gamma Bias: Positive Skew
**Score: 7/10**
---
### 🔍 TECHNICAL CHECK
📍 Price: \~\$145.32
🧭 20D MA: \$147.89
📊 RSI: 59.5 (Momentum neutral, room to run)
🔓 Resistance: \$150
🛡️ Support: \$140
**Score: 6/10**
---
### 🌎 MACRO CONTEXT
🧠 Sector tailwinds from AI hype + digital ad rebound
🛑 No major regulatory red flags
**Score: 8/10**
---
## 🔥 THE TRADE SETUP
**📈 Direction**: Bullish
🎯 **RDDT 08/01 \$150C**
💸 **Entry**: \$9.55
🛑 **Stop Loss**: \$4.78
📈 **Target**: \$19.55+
🧮 **Size**: 1 Contract = \$955 Risk
🕒 **Entry Timing**: Pre-earnings close
📆 **Earnings Time**: BMO (Before Market Open)
📊 Expected Move: \~5%
📈 Setup = High risk / High reward, theta-sensitive
---
## ⚡ TRADE PLAN
✅ Take partial profit at 100%, full at 200%
⏳ Exit within 2H post-ER if target unmet
🛑 Cut below \$4.78 to cap drawdown
---
## 🧠 CONVICTION SCORE
🎯 75% Bullish Bias
📊 Based on fundamentals, options, and flow
📉 Risk = Valuation + Thin Op Margin
📈 Reward = Explosive upside w/ surprise history
---
💬 **Watch for \$150 breakout. If cleared post-ER = moonshot to \$160 possible.**
📢 #RDDT #EarningsTrade #RedditStock #CallOptions #AIStocks #TechMomentum #OptionsFlow #IVSurge #TradingViewIdeas #SwingTrade #OptionsStrategy #VolatilityPlays #RDDTstock
