Beyond Technical Analysis
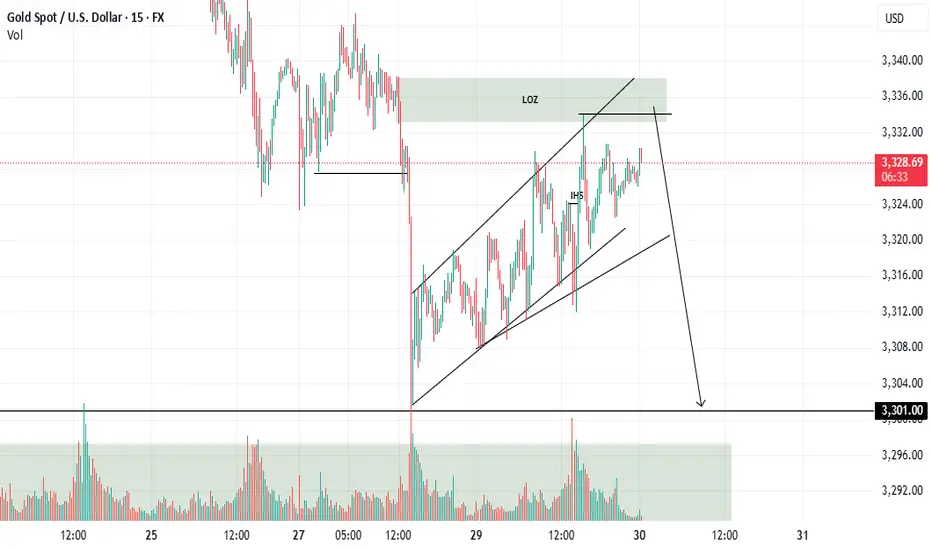
Short idea!Hello all. market needs a new lower low and it reversed from no where. the loz is the best Option here. be happy(wink)
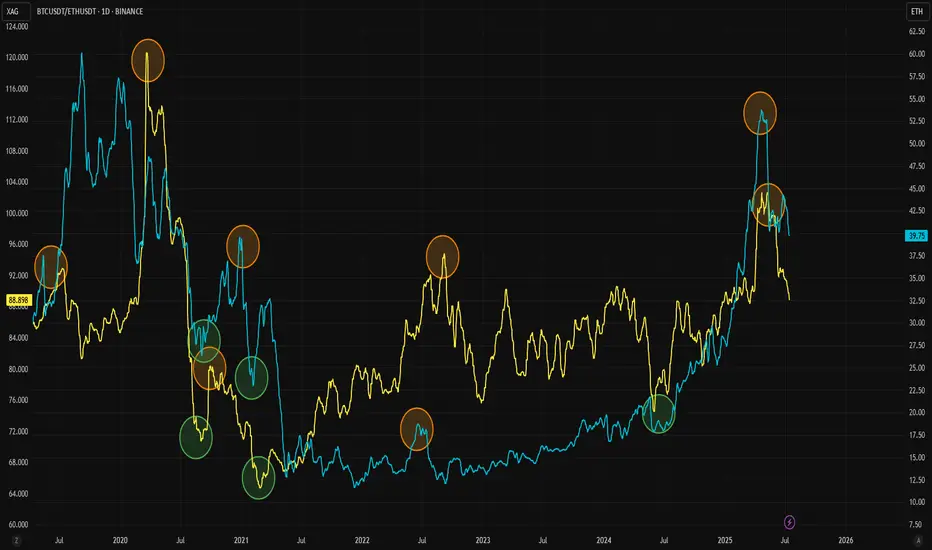
Want to Know What Happens in Crypto? Check Silver InsteadThe Gold/Silver ratio is one of the key indicators that highlights major turning points in modern economic history. Similarly, the ETH/BTC ratio is widely followed as a gauge of strength in the crypto market and the beginning of altcoin seasons. Interestingly, these two ratios also appear to correlate well with each other.
As adoption of both Ethereum and Bitcoin has grown, the Gold/Silver and BTC/ETH ratios have started to move more closely together. They often follow similar patterns, with tops and bottoms forming one after the other. For clarity, this analysis uses the BTC/ETH ratio rather than ETH/BTC.
Historically, BTC/ETH tends to lead during market tops, followed by a similar move in the Gold/Silver ratio. This pattern has been observed repeatedly since 2020. When it comes to bottoms, the timing between the two ratios is usually tighter, as seen during the 2020, 2021, and 2024 lows.
The latest signal came from a top in the BTC/ETH ratio, and the Gold/Silver ratio now appears to be following that move. Given the cyclical nature of crypto markets, both ETH and silver could be at the early stages of new upward trends. For a potential trend reversal, it may be wise to keep a closer eye on silver in the coming weeks.
Implied volatility, one more tool in our arsenalWHAT IS IMPLIED VOLATILITY?
Implied volatility (IV) refers to the market’s expectations of future volatility for a given asset, derived from option prices. Unlike historical volatility, which measures past price fluctuations, IV is forward-looking and reflects what traders believe will happen in the near future, typically over a 1 to 3 month horizon. IV is not directly observable; it is inferred from option prices using models like Black-Scholes. When option premiums rise even though the underlying asset remains flat, this often signals a rise in implied volatility: investors are preparing for more pronounced future price moves.
IMPLIED VOLATILITY IN FX
In FX markets, as in equities or commodities, implied volatility serves as a risk gauge and a proxy for uncertainty. It plays a critical role in portfolio management, hedging, and strategy timing.
High implied volatility on a currency pair indicates market expectations for increased future movement. This can stem from upcoming economic data, central bank decisions, geopolitical risk, or broader market instability. For example, rising IV on EUR/USD ahead of a major Fed or ECB meeting may signal increased demand for options as market participants hedge against potential surprises. Conversely, sustained low IV often reflects calm market conditions or, at times, a strong directional trend.
Implied volatility can act as a market condition filter for trading strategies. To simplify, we can, for example, divide the CVOL level into four distinct categories.
Abnormally low IV (well below average): Reflects extreme complacency or post-event calm.
Moderately low IV (below average): Indicates orderly, technical markets.
Moderately high IV (above average): Suggests elevated uncertainty.
Abnormally high IV (well above average): Signals market stress or panic.
In spot FX, where retail traders rarely engage in options directly, implied volatility serves best as a macro signal, helping inform position sizing, stop placement, or overall risk exposure based on the current volatility regime.
One advanced use of IV is to compare it against realized (historical) volatility. When implied volatility is much higher than realized volatility, it often means options are expensive, and vice versa. This comparison proves especially valuable in FX markets, as it helps traders identify situations where risk premia may be overpriced, revealing potential misalignments between implied and realized volatility. It also offers a forward-looking perspective by highlighting upcoming catalysts that are not yet fully priced into the spot market.
INTRODUCING THE CME CVOL INDEX
To make volatility data more accessible and comparable across asset classes, CME Group introduced the CVOL index family in 2023, a set of standardized implied volatility indexes derived from listed futures options.
How CVOL is calculated?
CVOL indexes are built using vanilla options on futures. They estimate 30-day forward implied volatility, using a basket of out-of-the-money options across various strikes and near-term expirations. The methodology is comparable to that of the VIX in equities, but adapted for the structure of futures markets. Each CVOL index is expressed as an annualized percentage, which can be interpreted as the expected one-standard-deviation move over the next 30 days.
CVOL indexes in FX
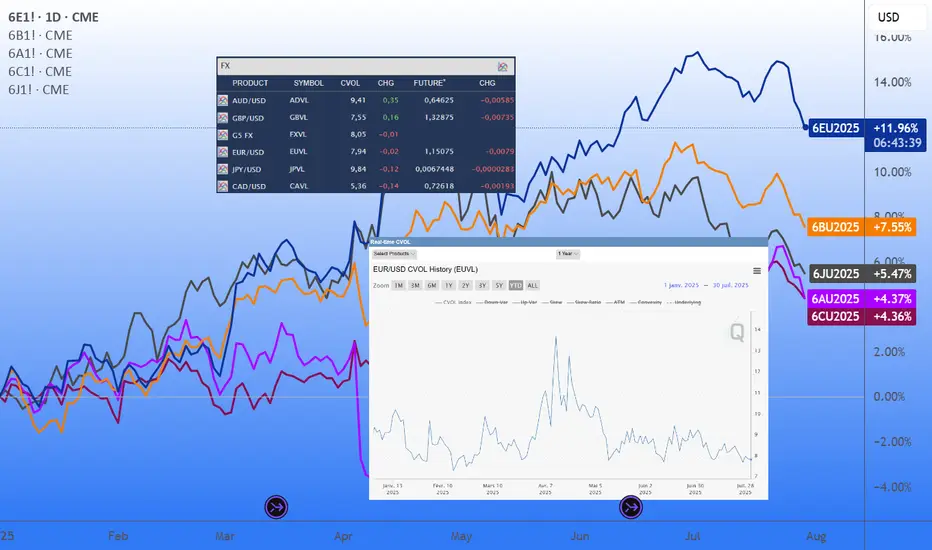
Several major currency pairs now have their own dedicated CVOL indexes, offering a real-time measure of implied volatility based on options pricing from CME Group futures contracts. Each index reflects the market’s expectations of future volatility for a given pair:
EUVL for EUR/USD (based on 6E futures)
JPVL for USD/JPY (6J futures)
GBPVL for GBP/USD (6B futures)
CAVL for USD/CAD (6C futures)
ADVL for AUD/USD (6A futures)
In addition to individual pair indexes, the G5 CVOL Index provides a broader view by aggregating the implied volatility of the five major currency pairs, offering a high-level snapshot of volatility across the G5 FX complex. This makes it a valuable tool for macro-focused traders monitoring global risk appetite, cross-asset volatility regimes, or portfolio-level currency exposure.
HOW TO USE CVOL IN PRACTICE
Detecting shifts in risk perception
A sudden spike in CVOL, without a move in the underlying, suggests that institutional players are actively hedging. This can act as an early warning signal for market-moving events or shifts in sentiment. Example: before an ECB decision, a jump in EUVL from 7% to 10% annualized while EUR/USD remains flat may suggest that traders are bracing for a policy surprise.
Adjusting position sizing
When CVOL moves beyond predefined thresholds, traders often respond by reducing leverage, widening stop-loss and take-profit levels, and avoiding overly aggressive directional exposure, in contrast with periods where CVOL fluctuates near its historical average and market conditions appear more stable.
Quant strategy filters
CVOL can also act as a regime filter within systematic trading strategies. For example, when implied volatility on EUR/USD, as measured by EUVL, reaches extreme levels, certain algorithms may shift into breakout mode, anticipating strong directional moves in a high-volatility environment. Conversely, when the index shows no abnormal reading, it may reflect a well-balanced market backdrop, offering more orderly conditions where structured strategies such as range trading tend to perform better.
As historical data on CVOL indexes are available, quant traders can easily backtest and validate ideas that incorporate volatility-based signals or regime filters. More experienced participants often go further, combining FX implied volatility with other volatility indicators, such as CVOL indexes on interest rate futures, to build multi-asset strategies and monitor cross-asset shifts in risk appetite with greater precision.
FINAL THOUGHTS
Implied volatility is a powerful lens into market expectations and potential price swings. In FX, although not always directly accessible to retail traders via options, IV data provides essential context for positioning, timing, and risk management.
With the advent of CME’s CVOL indexes, traders now have a standardized and transparent way to track and compare implied volatility across currencies. Whether you are a macro trader, hedge fund manager, or informed retail participant, monitoring CVOL brings a distinct informational edge, especially when used to anticipate shifts in sentiment and volatility regimes.
And perhaps most importantly: IV doesn’t tell you what happened, but what might happen next, making it an invaluable tool for anyone navigating fast-moving global FX markets.
---
When charting futures, the data provided could be delayed. Traders working with the ticker symbols discussed in this idea may prefer to use CME Group real-time data plan on TradingView: tradingview.com/cme/ .
This consideration is particularly important for shorter-term traders, whereas it may be less critical for those focused on longer-term trading strategies.
General Disclaimer:
The trade ideas presented herein are solely for illustrative purposes forming a part of a case study intended to demonstrate key principles in risk management within the context of the specific market scenarios discussed. These ideas are not to be interpreted as investment recommendations or financial advice. They do not endorse or promote any specific trading strategies, financial products, or services. The information provided is based on data believed to be reliable; however, its accuracy or completeness cannot be guaranteed. Trading in financial markets involves risks, including the potential loss of principal. Each individual should conduct their own research and consult with professional financial advisors before making any investment decisions. The author or publisher of this content bears no responsibility for any actions taken based on the information provided or for any resultant financial or other losses.
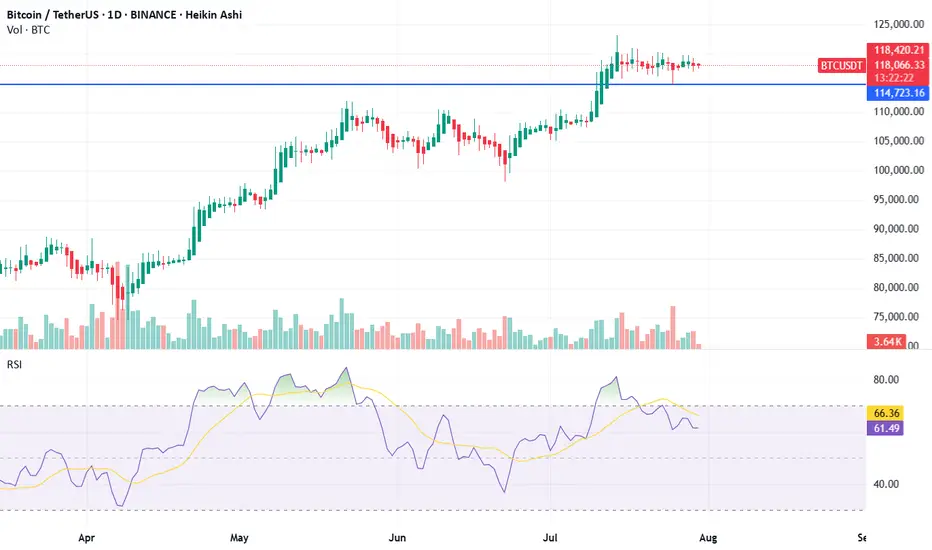
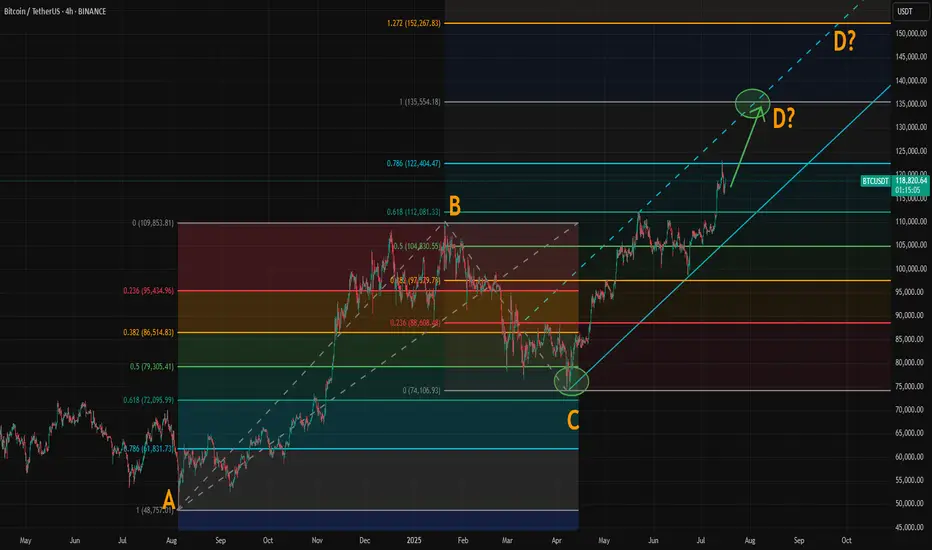
Where Could Bitcoin Make Its Cycle Top? Model and ABCD AlignedWith the breakout above resistance around 110,000, Bitcoin’s rally appears to be back on track. If you've been following our crypto analysis, either here or on our website, you’ll know our target range for this bull cycle is between 135,000 and 150,000, with the top of the range possibly extending further depending on the strength of the final wave.
Now, a possible ABCD pattern is forming, with point D potentially landing at either 135,000 or 150,000. A coincidence? Maybe, maybe not.
How Did We Arrive at the 135K–150K Target?
We based this range on historical halving cycle returns:
Halving Year - Return to Cycle Top
2012 - 9,076%
2016 - 2,122% (↓ 4.27x)
2020 - 541% (↓ 3.92x)
Two things stand out:
Each cycle has shown diminishing returns.
The rate of decline appears roughly consistent, dropping by around 4x each time—but slightly less with each cycle.
So depending on the multiplier used:
If returns fall by 4.27x again → target: 135K
If reduced by 4x → target: 140K
If reduced by 3.92x → target: 142K
If the rate of reduction itself slows (difference of 0.35 between 4.27 and 3.92) → target: 150K
While the sample size is too small, we believe the model holds reasonable logic with fundamental backing from various metrics.
The chart now shows a possible ABCD pattern:
If it becomes a classic AB = CD structure, point D could form near 135K.
If it becomes an extended ABCD (with CD = AB × 1.272), then point D could reach just above 150K.
These technical targets align closely with our halving model projections, increasing our confidence in the 135K–150K range as a likely top zone for this cycle.
Also, please check our earlier post for possible altseason start. A correlation between BTC/ETH and Gold/Silver might give some tips about possible Ether surge.
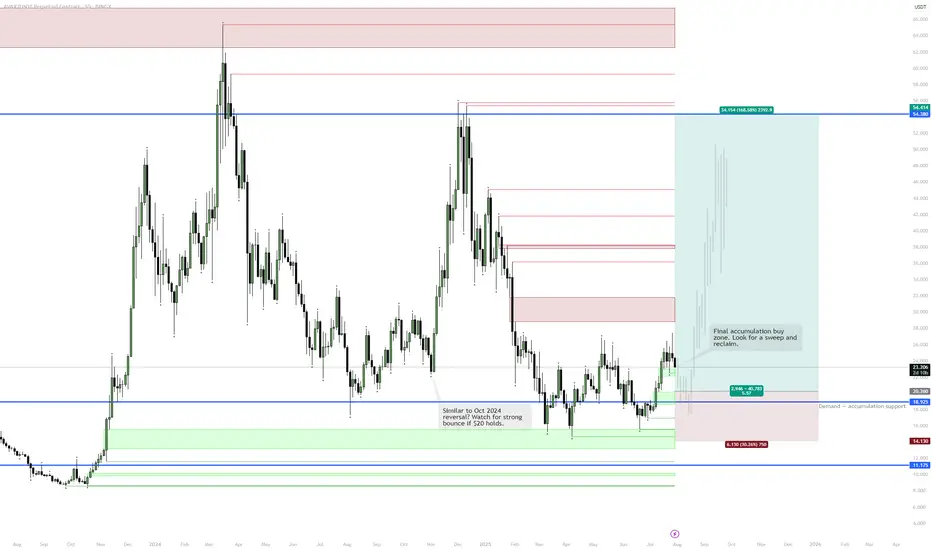
AVAX | Final Accumulation & Potential ReversalContext:
Price is in a major accumulation range, showing similarities to the October 2024 setup.
Green zones indicate strong demand/support; blue is key structural support.
Step-by-Step Scenario:
Accumulation Phase:
Price is consolidating above the $20 level, with repeated defenses of the support zone.
Spot Buys:
Orders set in the $19–$20 area to capture a potential “final shakeout.”
Spring/Reversal:
If price sweeps below $20 and quickly reclaims the level, this signals the final flush before reversal — mirroring the October 2024 bottom structure.
Upside Target:
First major resistance at $38, but the big objective is the $54–55 range, marking previous macro highs and supply.
Invalidation:
A sustained close below $14.1 would break the accumulation structure and invalidate the bullish scenario.
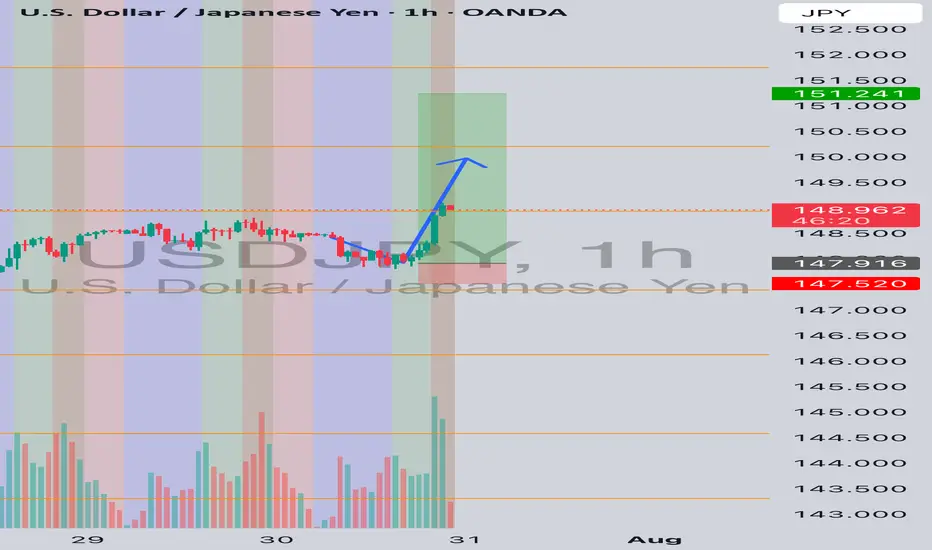
USDJPY LongDecided to do a long entry on UJ. Below is the prediction. Entry was during Asian session. Expecting TP of UJ at around 149ish or 151.250 max
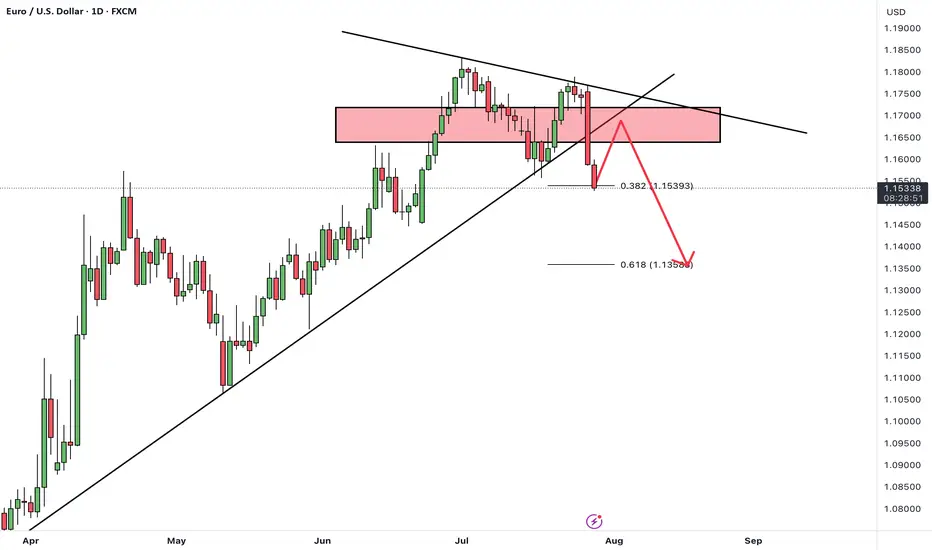
A TEST OF THE PREVIOUS BROKEN STRUCTURE From the daily time frame, we can see that EURUSD has broken a structure which was acting as previous resistance turned support, which is indicated with a blue rectangle.
I'm anticipating the broken support to turn to resistance when the price action retraces from somewhere at the demand zone which is indicated with a red rectangle.
So let's have in back of our mind that price will need to retrace from the low to retest the broken structure and turn into resistance and then after continue to the downside.
......................,.................,......................
Please share your thoughts,what do you think,will EURUSD move downwards or will it be buy the dip and continue with its uptrend.
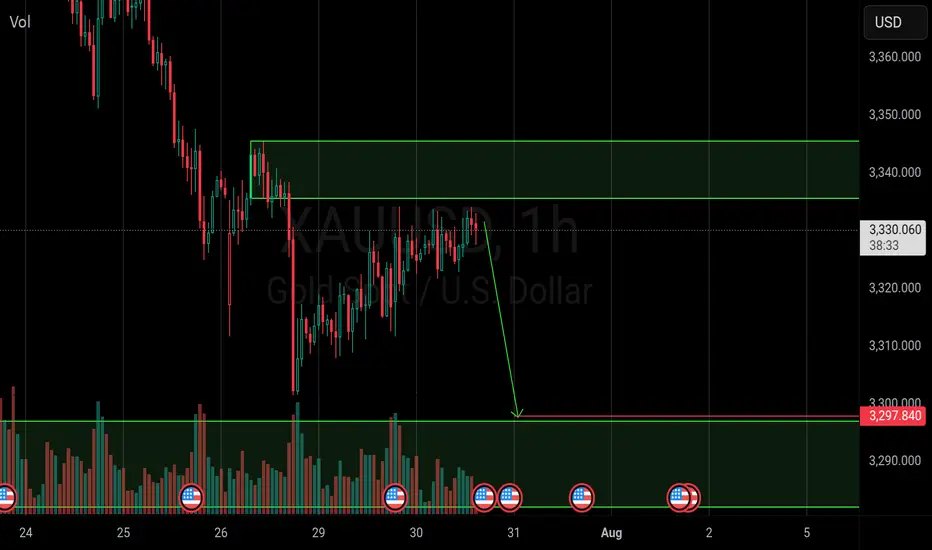
GOLD Is ready for a short fallGold is approaching an interesting level and i expect the fall begins soon to beloe marked demand zone
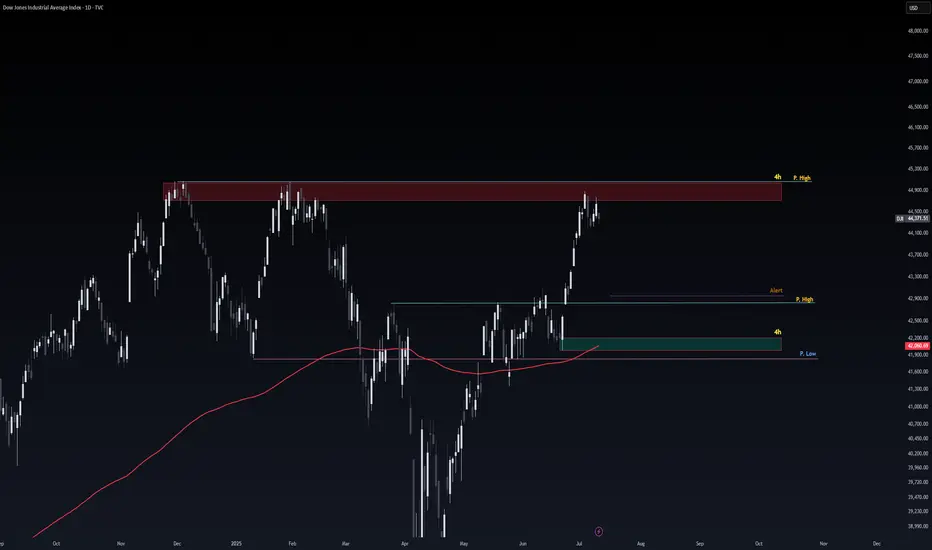
Safe Entry DJIObvious Movement I Guess.
P.High(Previous High) Act As good Support for price to Respect.
Note: 1- Potentional of Strong Buying Zone:
We have two scenarios must happen at The Mentioned Zone:
Scenarios One: strong buying volume with reversal Candle.
Scenarios Two: Fake Break-Out of The Buying Zone.
Both indicate buyers stepping in strongly. NEVER Join in unless one showed up.
2- How to Buy Stock (safe way):
On 1H TF when Marubozu/Doji Candle show up which indicate strong buyers stepping-in.
Buy on 0.5 Fibo Level of the Marubozu/Doji Candle, because price will always and always re-test the
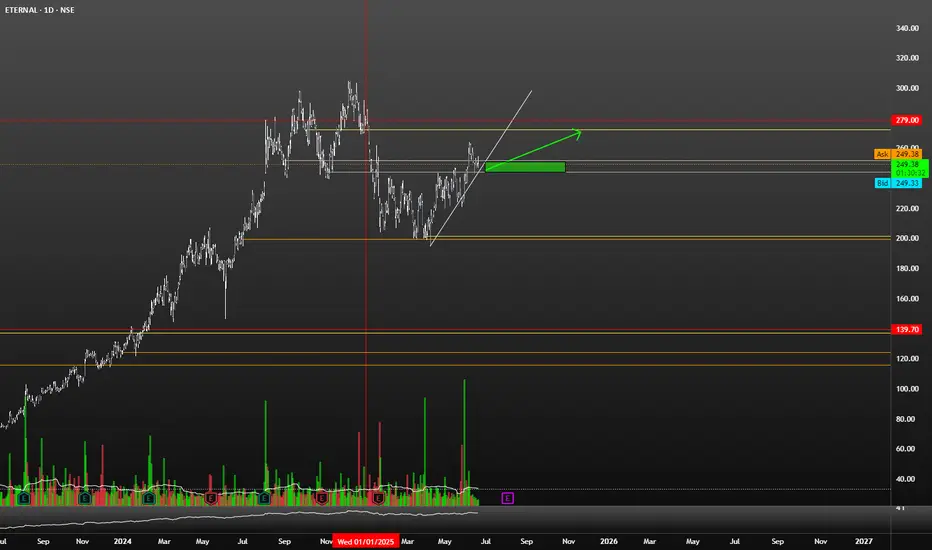
$NSE:ETERNAL To SkyRocket in the Coming Days !NSE:ETERNAL
Very Good Price Action is Already Formed.
Its the Time to make Accumulations of Stock near the Current price.
Its The Company, Which Goin to Cater Services the Future.
Its Now or Never !
Boost the idea ! Pal
EURUSDHello Traders! 👋
What are your thoughts on EURUSD?
EUR/USD kicked off the week with a sharp drop of nearly 200 pips, driven by renewed concerns over U.S. tariff policies. This strong bearish momentum signals intensified selling pressure across the board.
The pair is now approaching a support zone, which has previously triggered bullish reactions.
However, given the current strong bearish sentiment, there is a real risk this support may not hold.
Our bias remains bearish overall.
If the pair finds temporary support at this level, a short-term corrective bounce is possible.
But ultimately, we expect a continuation of the downtrend toward lower support levels after the correction completes.
Can this support zone stop the bleeding, or is more downside coming? Let us know your thoughts! 👇
Don’t forget to like and share your thoughts in the comments! ❤️
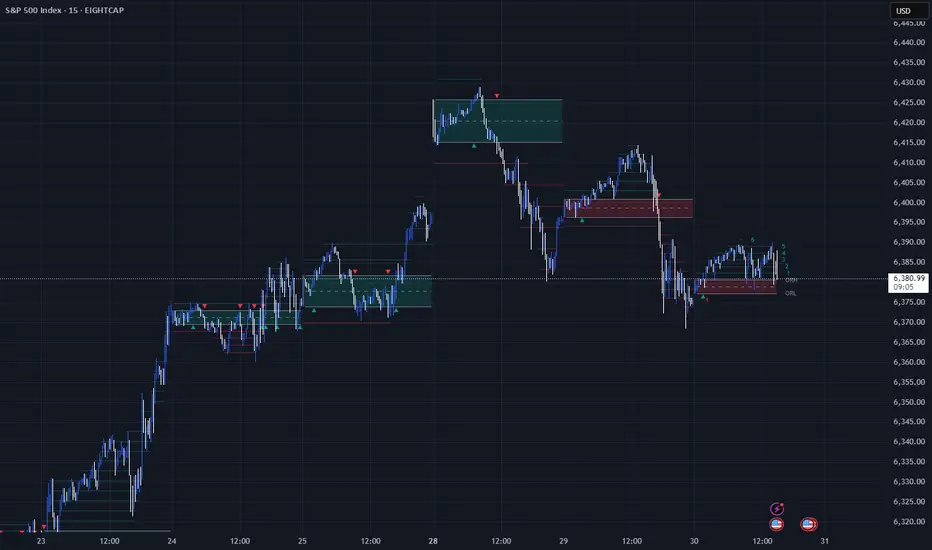
Unlocking the Power of ORB (Opening Range Breakout)Unlocking the Power of ORB (Opening Range Breakout): A Proven Strategy for Intraday Traders
In the fast-paced world of intraday trading, simplicity and structure can often outperform complexity. One such time-tested strategy is the Opening Range Breakout (ORB) — a method favored by both discretionary and system traders for its clarity and adaptability.
📌 What is ORB (Opening Range Breakout)?
ORB refers to the price range (high and low) formed during the first few minutes (typically 5, 15, or 30) after the market opens. Traders look for a breakout above or below this range, anticipating strong momentum in that direction.
🧠 Why ORB Works
Volume Surge: The opening minutes see high institutional activity, creating genuine demand/supply signals.
Market Psychology: ORB captures trader sentiment as news digests overnight and is priced in at the open.
Defined Risk: The high/low of the range becomes a natural stop-loss area, allowing clean setups.
✅ Entry and Exit Rules for the ORB Strategy
Having a consistent framework helps you avoid emotional decisions. Here’s how you can structure your trades using ORB:
🔹 Entry Criteria:
Timeframe: Define your ORB window — e.g., first 15-minute candle.
Bullish Breakout Entry:
Enter long when price closes above the ORB high with volume confirmation.
Bearish Breakdown Entry:
Enter short when price closes below the ORB low with volume confirmation.
⚠️ Avoid entering on the first breakout candle. Wait for a close and retest, or a strong momentum candle for higher confidence.
🔹 Stop-Loss Placement:
For Long Trades: Place SL just below ORB low
For Short Trades: Place SL just above ORB high
🔹 Target/Exit Options:
Fixed RR Target: Aim for 1.5–2x your risk as initial target.
Mid/Outer Bands: Use indicator-drawn breakout bands (like those in LuxAlgo script) as profit zones.
Time-based Exit: Close position by end of session if price stalls or consolidates.
Trailing Exit: Trail your stop behind higher lows (long) or lower highs (short) after breakout.
📊 ORB in Action
You can explore this ready-to-use TradingView indicator to visualize ORB levels in real-time:
🔍 Indicator: Opening Range with Breakouts & Targets (by @LuxAlgo) Thanks to @LuxAlgo team to make this indicator available.
🛠️ Highlights:
Automatically marks the opening range
Plots breakout zones and targets
Ideal for intraday strategies
Works across indices, forex, and crypto
📓 Integrating ORB into Your Trading Journal App
If you're journaling ORB trades, consider logging:
✅ Symbol & timeframe
✅ ORB range (high/low)
✅ Breakout direction (long/short)
✅ Entry time & price
✅ Exit reason (target hit, SL hit, time-based exit)
✅ Notes: market sentiment, news drivers, volume confirmation
Over time, this data will help you:
🔍 Identify which assets respect ORB best
📈 Tune your RR ratio and stop placements
🧠 Reduce decision fatigue by automating setups
🧪 Want to Automate It?
Our trading journal app is ready with 🧠 AI-based journaling for feedback and refinement
🎯 Final Thoughts
ORB is a classic — not because it’s flashy, but because it offers structure, risk control, and repeatability. Whether you're a price action purist or using smart indicators, ORB can provide a disciplined edge — especially when integrated into a journaling and feedback loop.
📌 Start small. Track results. Tune your edge.
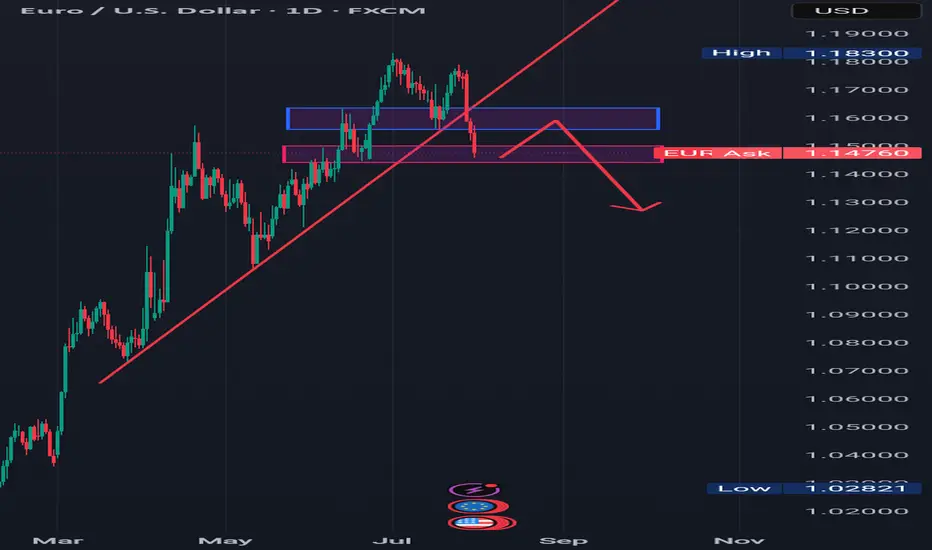
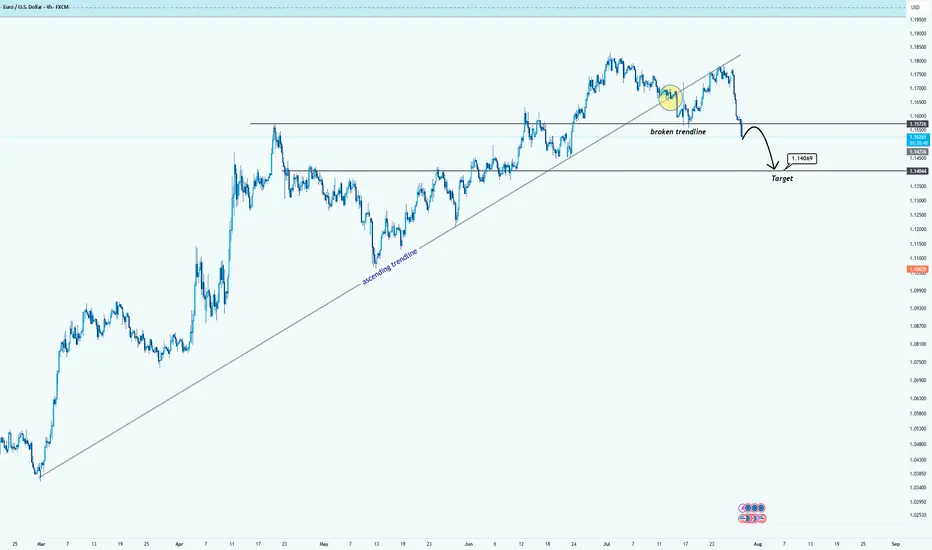
EURUSD Breaks Trendline: Bearish Momentum in PlayHello guys!
After months of climbing steadily along the ascending trendline, EURUSD has finally broken below support. The trendline breach, followed by a tight consolidation (yellow circle), hinted at a loss of bullish strength, and now the breakdown is in full motion.
Broken ascending trendline
Clear rejection after retest
Bearish continuation underway
Target area: 1.1400–1.1440 zone
If sellers maintain control, the price could descend toward the next major demand area.
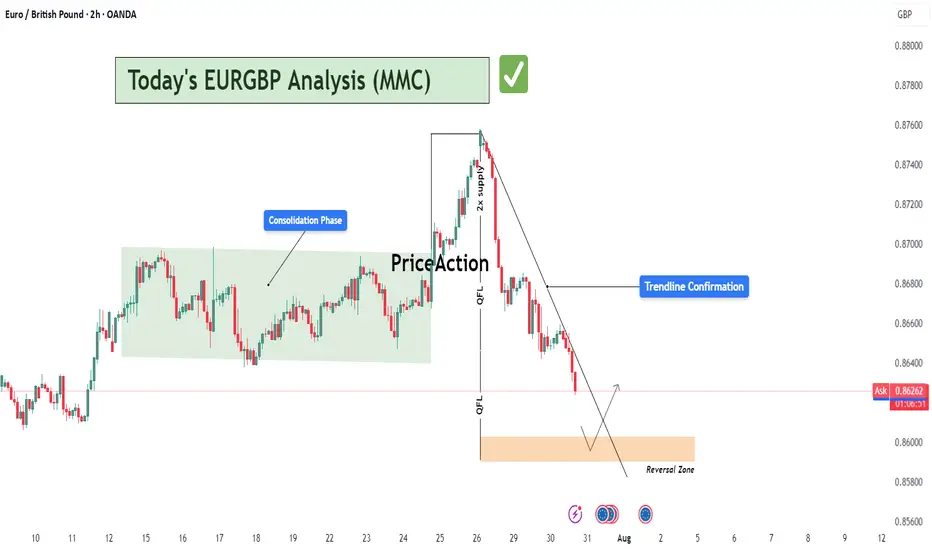
EURGBP Analysis : Bearish Leg Nearing Completion + Target Zone📍 Overview:
The EURGBP pair has recently provided significant price action signals that suggest a high-probability reversal setup is unfolding. This analysis dives deep into market structure, supply and demand dynamics, and institutional price behavior using MMC principles.
The current focus lies in identifying a potential trend reversal opportunity after a sharp decline from a key supply level, as price nears a well-marked Reversal Zone. This detailed breakdown covers each phase to provide clarity and trade planning.
🧩 Phase 1: Consolidation Phase (Accumulation)
From July 11th to July 24th, EURGBP moved sideways within a clearly defined range-bound structure (highlighted in green).
This consolidation indicates a battle of control between bulls and bears, typically signaling accumulation or distribution depending on breakout direction.
The tight price action and wicks on both sides suggest market makers accumulating positions before a breakout.
Price eventually broke out to the upside, confirming bullish accumulation rather than distribution.
🚀 Phase 2: Impulse Move & 2x Supply Rejection
Following the breakout from the consolidation, price experienced a strong impulsive rally, catching breakout traders and pushing into a major supply zone.
The area where price reversed is marked as a 2x supply rejection zone, suggesting heavy institutional sell orders were triggered.
This zone aligns with a historical resistance level and is critical in the current structure.
Price failed to sustain the bullish momentum, forming a sharp drop right after tapping into supply, indicating strong selling pressure.
🔄 Phase 3: Market Structure Shift via QFL (Quick Flip Levels)
As the price dropped from the supply zone, two significant QFL levels were printed in quick succession.
QFL (Quick Flip Levels) represent a break in internal structure, showing that buyers were no longer defending the previous support zones.
These quick flips signal an aggressive shift in momentum from buyers to sellers.
Each QFL breakdown was followed by a new lower low, confirming the start of a bearish sequence or trend leg.
📉 Phase 4: Descending Trendline & Dynamic Resistance
After the QFL shifts, a clear downtrend channel formed, respected by multiple lower highs.
The descending trendline drawn from the supply zone peak has acted as dynamic resistance, rejecting every bullish pullback attempt.
This trendline provides technical confluence for intraday traders to manage risk and timing entries.
🟠 Current Market Context: Entering the Reversal Zone
Price is now approaching a marked Reversal Zone (highlighted in orange).
This zone represents a high-probability demand area, previously respected as a base before the rally to supply.
If price reaches this area and shows signs of exhaustion (e.g., bullish engulfing, long wick rejection, volume divergence), it may serve as a reversal point.
This zone aligns with MMC logic — market makers tend to react at zones of trapped liquidity, especially after stop hunts.
📈 Projected Scenario & Trade Setup:
Price drops into the Reversal Zone
A bullish rejection pattern appears (e.g., pin bar, engulfing candle)
Price retests and breaks the descending trendline to confirm a momentum shift
Entry can be taken post-breakout or with aggressive confirmation inside the zone
Stops placed below the zone; targets aligned with the previous QFL or trendline retest
⚠️ Key Notes for Traders:
Don't chase the move. Wait for reversal confirmation before entering.
QFLs offer strong structure-based levels to identify where the market flipped.
Use trendline confluence and volume confirmation for precise entries.
Monitor price action in the Reversal Zone — if invalidated, the downtrend may extend toward the next macro support.
Apply proper risk management and stay patient for the setup to fully develop.
📊 Summary:
🧭 Bias: Short-term bearish → possible reversal bullish
🎯 Entry Area: Reversal Zone (0.85800 – 0.86000 approx.)
⛔ Invalidation: Clean break and close below 0.85700
🏁 Potential Target: First TP near 0.86750; extended TP near 0.87050 (previous QFL level)
🔄 MMC Approach Recap:
This analysis follows the Market Maker Cycle (MMC) method, which involves:
Consolidation (Accumulation)
Manipulation (False Breakouts or Stop Hunts)
Distribution (Rapid Expansion & Flip Levels)
Re-Accumulation or Reversal
Each step is clearly defined in this chart, offering a blueprint for both trend traders and reversal specialists.
💬 Let's Talk:
What do you think about this setup? Are you seeing similar MMC patterns on other EUR or GBP crosses?
Drop your thoughts, charts, and questions below!
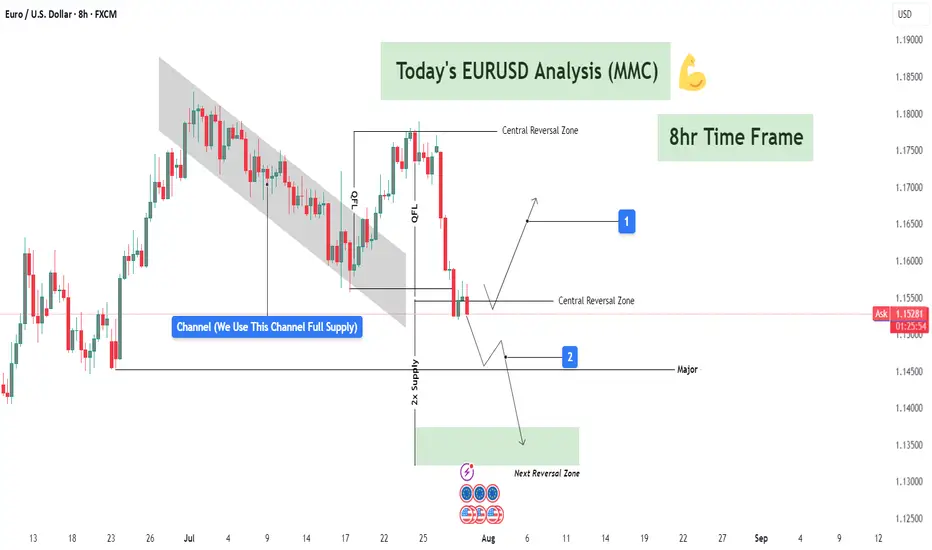
EURUSD Analysis – Supply Zones & Reversal Opportunities (MMC)Today’s EURUSD analysis focuses on identifying major supply zones, potential reversal points, and directional bias using the Mirror Market Concept (MMC) on the 8-hour timeframe.
1️⃣ Market Structure & Channel Supply Zone
The market recently formed a descending channel 📉, acting as a full supply zone where sellers dominated.
Every time price touched the upper boundary of this channel, we saw bearish reactions, proving this zone as a strong liquidity grab area.
Breakdown from the channel: After repeated attempts to break the channel to the upside, sellers regained control, pushing EURUSD lower and confirming bearish momentum.
2️⃣ Central Reversal Zone (Decision Point) ⚖️
Currently, price is consolidating around the Central Reversal Zone.
This zone is crucial because it can act as:
Reversal Point 🟢: If buyers step in aggressively, we might see a bullish leg toward previous swing levels, targeting resistance zones.
Continuation Zone 🔻: If sellers maintain pressure and break below this level, momentum will shift strongly bearish, aiming for deeper support.
Price behavior here will define short-term direction. Traders must wait for confirmation before committing to large positions.
3️⃣ Next Major Reversal Zone (High-Probability Demand) 🟩
Marked in green, this zone is expected to attract buyers if the current level fails.
Historically, these areas show high liquidity grabs and institutional activity.
If price reaches this zone, we expect significant bullish interest, making it a high-probability reversal area for medium-term buy setups.
4️⃣ Trade Scenarios
Scenario 1 (Bullish Reaction 🟢):
Price bounces from the Central Reversal Zone.
Possible targets: Previous structure highs inside the channel break zone.
Scenario 2 (Bearish Continuation 🔻):
Price fails to hold above and breaks lower.
Target: Next Major Reversal Zone for fresh liquidity accumulation.
5️⃣ Trading Approach & Risk Management 🛡️
Aggressive Approach: Intraday traders can scalp inside the Central Reversal Zone but must keep tight stop-losses to avoid fake-outs.
Conservative Approach: Wait for a clean break and retest confirmation, especially near the Next Reversal Zone for high-probability trades.
Maintain risk-to-reward (RR) ≥ 1:2 and avoid emotional trading during reversal attempts.
Summary:
EURUSD is at a critical juncture. The current market structure shows a bearish tone, but the Central Reversal Zone can still cause a temporary bullish reaction. A failure to hold will open the path toward the green reversal demand zone, where major buyers are likely to appear.
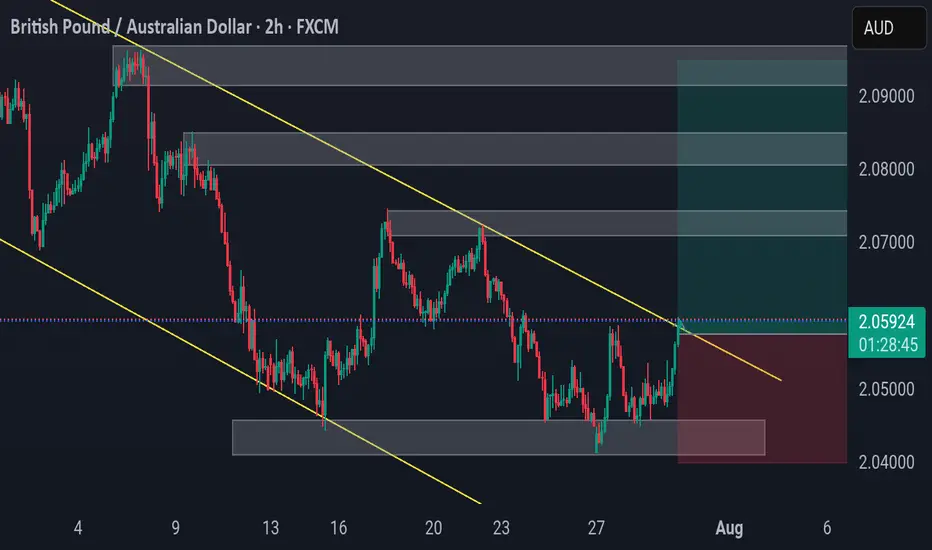
GBPAUD 2H – Clean Breakout SetupGBPAUD 2H – Clean Breakout Setup
Price has broken out of a descending channel and is retesting structure. Demand zone held firm, and bullish momentum is building.
Setup by PULSETRADESFX
T g.
#ForexSignals #GBPAUD #BreakoutTrade #RiskManagement #PulseTradesFX
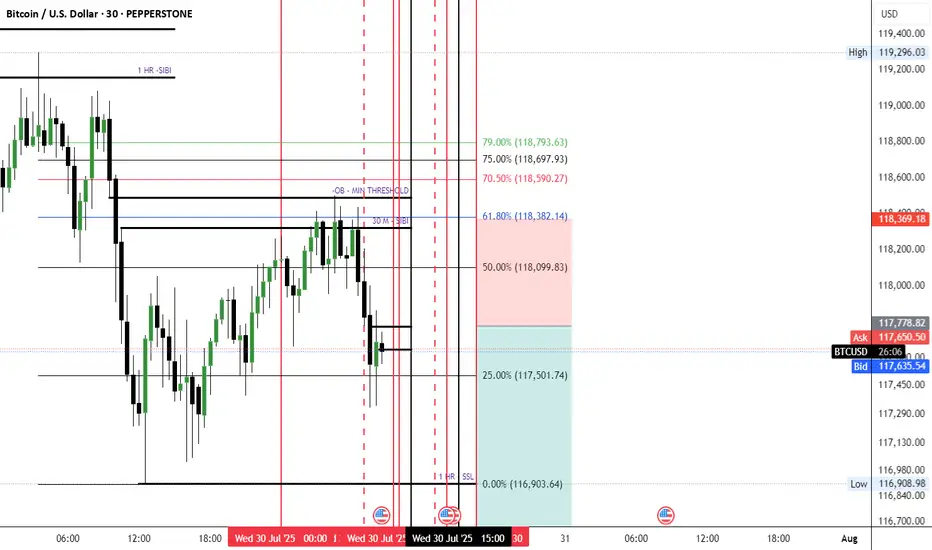
BTC AI Prediction Dashboard - 6h Price Path (30.07.25)
Prediction made using Crypticorn AI Prediction Dashboard
Link in bio
BTCUSDT Forecast:
Crypticorn AI Prediction Dashboard Projects 6h Price Path (Forward-Only)
Forecast timestamp: ~10:45 UTC
Timeframe: 15m
Prediction horizon: 6 hours
Model output:
Central estimate (blue line): -118,306
Represents the AI’s best estimate of BTC’s near-term price direction.
80% confidence band (light blue): 118,086 – 118,670
The light blue zone marks the 80% confidence range — the most likely area for price to close
40% confidence band (dark blue): 117,520 – 119,603
The dark blue zone shows the narrower 40% confidence range, where price is expected to stay with higher concentration
Volume on signal bar: 80.50
This chart shows a short-term Bitcoin price forecast using AI-generated confidence zones.
Candlesticks reflect actual BTC/USDT price action in 15-minute intervals.
This helps visualize expected volatility and potential price zones in the short term.

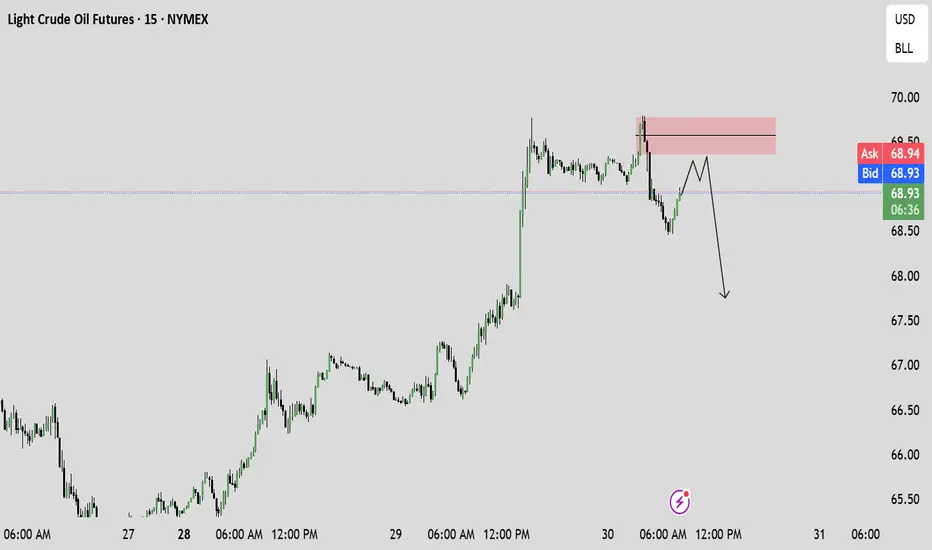
Short idea!Hello all. after reversing from an LOZ market needs a very special zone for reaction. It would be a Broken Retraced zone and it is right here. be happy (wink)

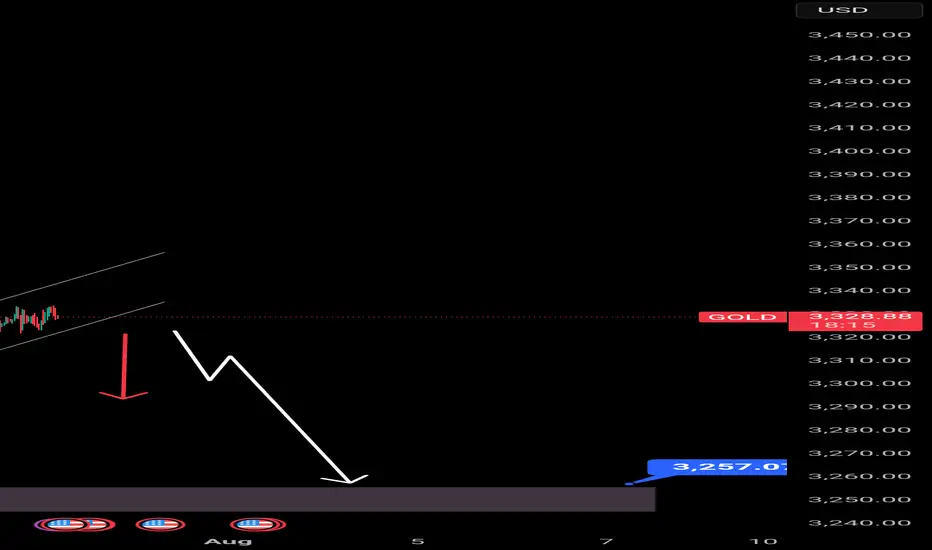
Gold--sellWell, gold is having an interesting moment. It is currently correcting in a downtrend and is holding steady. I don't feel any strength in its trend. How far will it correct to the specified area?
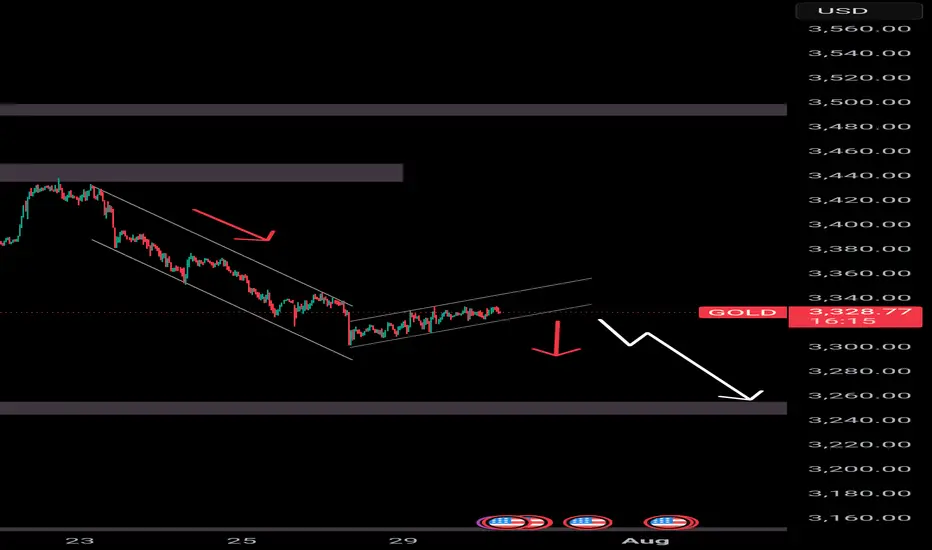
Gold-sellWell, gold is having an interesting moment. It is currently correcting in a downtrend and is holding steady. I don't feel any strength in its trend. How far will it correct to the specified area
Short- Sell Bitcoin Target 107000 $ in next few monthsBitcoin is on way to it's down side in next 5-6 months. If it will not sustain, then it can fall down to 85000$.