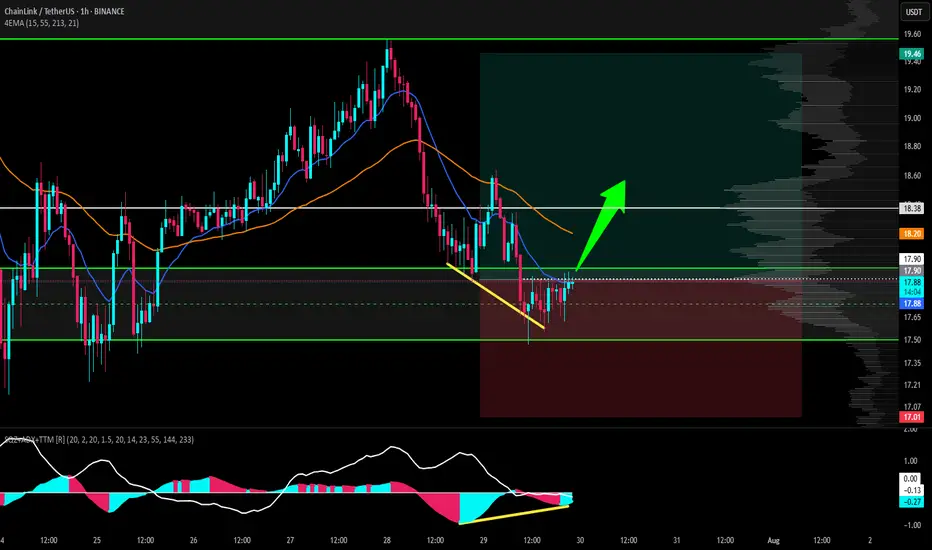
LINK/USDT, 1H chart, Futures - Bullish projection.based on 1H chart, we have a confirmed bullish divergence, this divergence is supported by potential bullish divergence in formation for 4 chart
H, so it could boost the movement with much more upward probabilities.
Beyond Technical Analysis
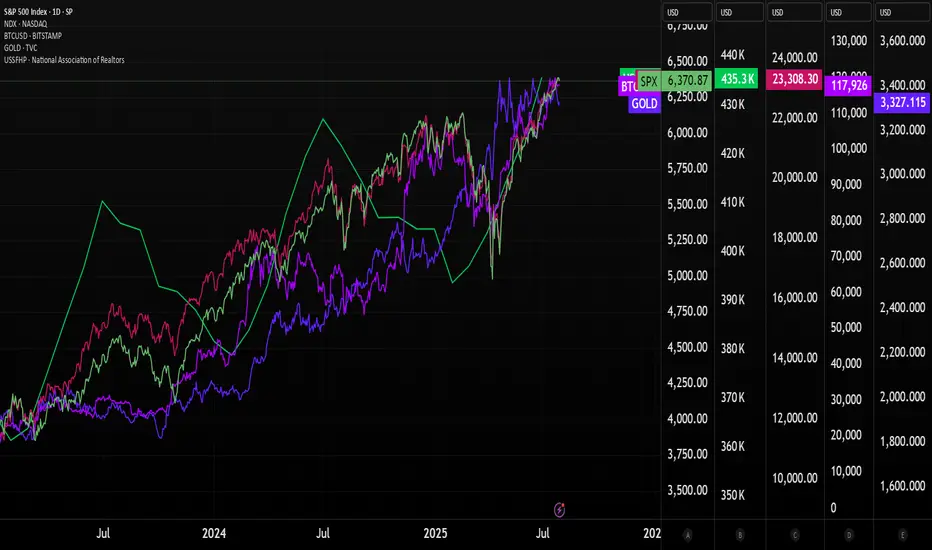
Nasdaq and S&P 500 higher than ever. Crash incoming??The stock market is now more expensive than ever.
Some people are calling the top, saying that the market is overbought and too high.
There are indicators that show that the market is overheated, but NO ONE KNOWS whether it's going to crash next week or continue running up for months.
Since April, Nasdaq has gained 40%, which is a lot. Congrats if you bought some QLD and TQQQ back in April when I posted about it.
SP:SPX : All-time high. NASDAQ:NDX : All-time high. BITSTAMP:BTCUSD : All-time high. TVC:GOLD : All-time high HOME PRICES ( ECONOMICS:USSFHP ): All-time high. Sounds a bit like a bubble.
The S&P 500’s market cap now equals 28x real disposable personal income — a record.
The stock market Shiller PE ratio is at its highest in 20 years.
Nasdaq companies, especially the MAG7, are strongly outperforming small-cap companies. The last time this happened at this speed, we had the dot-com crash.
The top 10 stocks in the S&P 500 account for 40% of the index.
So, saying this, is the market going to crash?
I don't know, but I know that it's more likely to crash now than it was 3 months ago. It might continue running higher, too, as the FED is expected to cut rates. Really, no one knows. 😊
Here's what I'm doing:
I trimmed down some overpriced stocks from my portfolio: Lemonade, Coupang, Shopify, and Crowdstrike
I trimmed down some of my crypto, especially Bitcoin and Ethereum
I stopped DCA'ing into leveraged ETFs
I'm accumulating cash
I'm still investing (added more healthcare stocks to the portfolio)
Quick note: I'm just sharing my journey - not financial advice! 😊
Shorts ConfirmationPrepare to sell! Be Ready! Its preparing a move like eurusd, we try to make a similiar down push, this patern is ready to drain al that liquidity downstairs
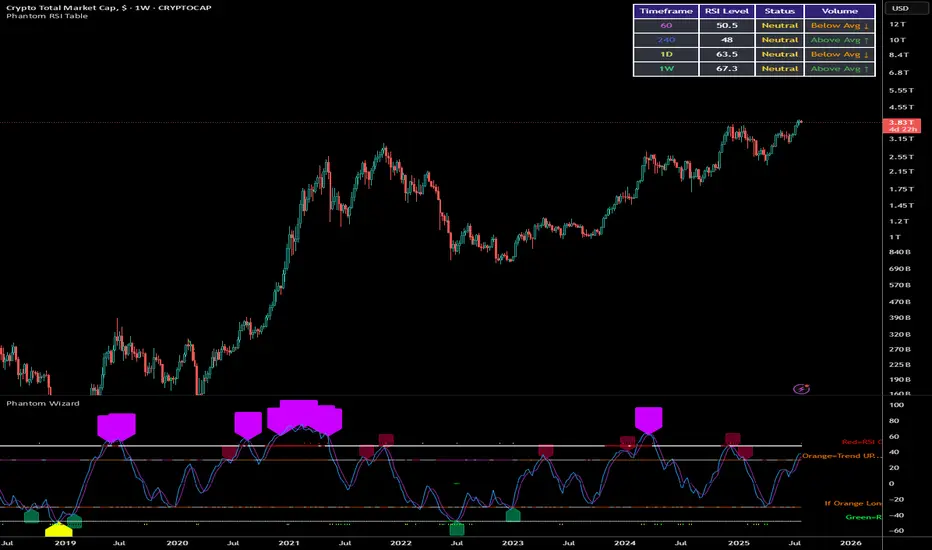
Comprehensive Cryptocurrency Market Analysis: Top 10 Assets and Executive Summary
This analysis examines price data for the top 10 cryptocurrencies by market capitalization (BTC, ETH, BNB, SOL, ADA, XRP, TRX, USDT, USDC, DOGE) . The inclusion of stable coins (USDT, USDC) and meme coins (DOGE) provides a more complete picture of capital flows within the cryptocurrency ecosystem. The data reveals significant market trends, correlation patterns, and potential future price targets based on historical performance.
Market Overview
The total cryptocurrency market capitalization grew from approximately $2.06 trillion in July 2024 to $3.82 trillion by July 2025, representing an 85% increase. During this period, we observed several notable market-wide movements:
Major Growth Phase (October-November 2024): The market experienced substantial growth, with Total Market Cap increasing from $2.47T to $3.57T.
Market Correction (January 2025): A significant correction occurred with the Total Market Cap dropping to $2.81T, representing a 21% decline from its peak.
Recovery and Stabilization (February-July 2025): The market recovered and stabilized, reaching new highs around $3.82T by July 2025.
Stable coin Analysis
USDT (Tether)
Market Cap Range: $119.6B to $163.7B (July 2024 - July 2025)
Overall Growth: 36.9%
Key Insight: USDT's market cap grew steadily throughout the period, with accelerated growth during market uptrends, indicating increased demand for trading liquidity.
Correlation with Market Movements: USDT market cap expansion typically preceded major market rallies, suggesting capital inflows preparing to enter volatile assets.
USDC (USD Coin)
Market Cap Range: $34.7B to $65.1B (July 2024 - July 2025)
Overall Growth: 87.6%
Key Insight: USDC showed stronger percentage growth than USDT, potentially indicating institutional preference for this stable coin.
Usage Pattern: USDC market cap showed notable increases in October 2024 and April-May 2025, coinciding with periods of market volatility.
Combined Stable coin Impact
Total stable coin market cap (USDT + USDC) grew from approximately $154.3B to $228.8B, a 48.3% increase.
This growth suggests significant new capital entered the cryptocurrency ecosystem during this period.
The ratio of stable coin market cap to total market cap decreased slightly from 7.5% to 6.0%, indicating that volatile assets grew at a faster rate than stable coins.
Individual Volatile Asset Performance
Bitcoin (BTC)
Price Range: $60,459 to $120,998 (July 2024 - July 2025)
Overall Growth: 94.2%
Key Support Zones: $80,000-$84,000, $95,000-$97,000, $103,000-$105,000
Key Resistance Zones: $120,000-$122,000, $130,000-$135,000
Future Target: Based on established support levels and growth trajectory, BTC could target the $125,000-$135,000 range in the next cycle, with potential for $150,000 if market conditions remain favourable.
Ethereum (ETH)
Price Range: $2,330 to $3,941 (July 2024 - July 2025)
Overall Growth: 57.8%
Key Support Zones: $2,800-$3,000, $3,200-$3,300, $3,500-$3,600
Key Resistance Zones: $4,000-$4,100, $4,500-$4,700
Future Target: ETH could target the $4,200-$4,800 range, with potential for $5,500 if it breaks historical resistance levels.
Finance Coin (BNB)
Price Range: $544 to $861 (July 2024 - July 2025)
Overall Growth: 45.7%
Key Support Zones: $650-$680, $720-$750, $800-$820
Key Resistance Zones: $860-$880, $900-$950
Future Target: BNB could reach $900-$1,000 based on its established support levels and growth patterns.
Solana (SOL)
Price Range: $135.52 to $224 (July 2024 - July 2025)
Overall Growth: 33.8%
Key Support Zones: $140-$150, $175-$185, $200-$210
Key Resistance Zones: $220-$230, $250-$270
Future Target: SOL could target $230-$280 range if market conditions remain favourable.
Cardano (ADA)
Price Range: $0.3315 to $1.3264 (July 2024 - July 2025)
Overall Growth: 136.7%
Key Support Zones: $0.70-$0.75, $0.85-$0.90, $1.05-$1.10
Key Resistance Zones: $1.30-$1.35, $1.50-$1.60
Future Target: ADA could target $1.40-$1.80 based on its growth trajectory and previous resistance levels.
XRP
Price Range: $0.486 to $3.6607 (July 2024 - July 2025)
Overall Growth: 501.1%
Key Support Zones: $2.00-$2.20, $2.50-$2.70, $3.00-$3.20
Key Resistance Zones: $3.60-$3.80, $4.00-$4.50
Future Target: XRP could target $3.80-$4.50 if its growth momentum continues.
TRON (TRX)
Price Range: $0.1531 to $0.351 (July 2024 - July 2025)
Overall Growth: 104.4%
Key Support Zones: $0.25-$0.27, $0.30-$0.32
Key Resistance Zones: $0.35-$0.37, $0.40-$0.42
Future Target: TRX could target $0.36-$0.45 based on its established growth pattern.
Dogecoin (DOGE)
Price Range: $0.10311 to $0.48 (July 2024 - July 2025)
Overall Growth: 117.9%
Key Support Zones: $0.16-$0.18, $0.20-$0.22, $0.25-$0.27
Key Resistance Zones: $0.40-$0.45, $0.50-$0.55
Future Target: DOGE could target $0.45-$0.60 during the next market cycle, with potential for higher spikes based on its historical volatility patterns.
Market Capitalization Analysis
Total Market Cap vs. Total Market Cap 3 (Excluding BTC and ETH)
Total Market Cap: Increased from $2.06T to $3.82T (+85%)
Total Market Cap 3: Increased from $579B to $1.01T (+74.4%)
This comparison reveals that BTC and ETH slightly outperformed the broader altcoin market in percentage terms, suggesting a preference for established cryptocurrencies during this period.
Capital Flow Analysis
Stable coin to Volatile Asset Flow:
The data shows clear patterns of capital moving from stable coins to volatile assets during bullish phases.
USDT market cap growth often preceded major market rallies by 2-4 weeks, suggesting accumulation phases.
USDC showed more pronounced growth during institutional adoption phases, particularly in Q4 2024.
Bitcoin Dominance Trend:
Bitcoin maintained or slightly increased its market share relative to altcoins.
During market corrections (particularly January 2025), capital flowed from altcoins to BTC, reinforcing its status as a "crypto safe haven."
Altcoin Rotation:
Clear evidence of capital rotation among altcoins, with ADA, XRP, and DOGE experiencing periods of significant outperformance.
SOL showed high correlation with overall market sentiment, amplifying both upward and downward movements.
DOGE experienced significant volatility, with its price movements often lagging BTC rallies but showing stronger percentage gains during peak market euphoria.
Meme Coin Impact:
DOGE's market cap fluctuated between $13.8B and $33.8B, representing a significant but volatile portion of the market.
DOGE price movements often signalled market cycle extremes, with major rallies in DOGE coinciding with broader market tops.
Correlation Analysis
High Correlation Assets: BTC, ETH, and Total Market Cap showed the strongest correlations (>0.9), indicating that these assets move largely in tandem.
Moderate Correlation Assets: BNB, SOL, and ADA showed moderate correlations with BTC (0.7-0.85), suggesting they follow broader market trends but with greater independent movement.
Lower Correlation Assets: XRP, TRX, and DOGE showed the lowest correlations with BTC (<0.7), indicating more independent price action potentially driven by project-specific factors or retail sentiment.
Stable coin Correlations: USDT and USDC market caps showed weak negative correlation with volatile asset prices during extreme market movements, confirming their role as counter-cyclical safe havens.
Price Zone Analysis and Future Targets
Bitcoin (BTC)
Current Support Zones: $103,000-$105,000, $95,000-$97,000
Current Resistance Zones: $120,000-$122,000
Future Target Zones: $125,000-$135,000 (primary), $150,000-$160,000 (extended)
Key Insight: BTC has established strong support around the $100,000 psychological level, which could serve as a foundation for future growth.
Ethereum (ETH)
Current Support Zones: $3,500-$3,600, $3,200-$3,300
Current Resistance Zones: $4,000-$4,100
Future Target Zones: $4,200-$4,800 (primary), $5,000-$5,500 (extended)
Key Insight: ETH needs to decisively break the $4,000 level to confirm its next major uptrend.
Binance Coin (BNB)
Current Support Zones: $800-$820, $720-$750
Current Resistance Zones: $860-$880
Future Target Zones: $900-$1,000 (primary), $1,100-$1,200 (extended)
Key Insight: BNB has shown resilience during market corrections, suggesting strong holder conviction.
Solana (SOL)
Current Support Zones: $175-$185, $150-$160
Current Resistance Zones: $220-$230
Future Target Zones: $230-$280 (primary), $300-$350 (extended)
Key Insight: SOL's volatility makes it susceptible to sharp corrections but also enables rapid recoveries.
Cardano (ADA)
Current Support Zones: $0.85-$0.90, $0.70-$0.75
Current Resistance Zones: $1.30-$1.35
Future Target Zones: $1.40-$1.80 (primary), $2.00-$2.20 (extended)
Key Insight: ADA has shown strong percentage growth from its lows, suggesting potential for continued outperformance.
XRP
Current Support Zones: $3.00-$3.20, $2.50-$2.70
Current Resistance Zones: $3.60-$3.80
Future Target Zones: $3.80-$4.50 (primary), $5.00-$5.50 (extended)
Key Insight: XRP's price action appears heavily influenced by regulatory developments, making it more unpredictable than other assets.
TRON (TRX)
Current Support Zones: $0.30-$0.32, $0.25-$0.27
Current Resistance Zones: $0.35-$0.37
Future Target Zones: $0.36-$0.45 (primary), $0.50-$0.55 (extended)
Key Insight: TRX has shown steady growth with lower volatility compared to other altcoins.
Dogecoin (DOGE)
Current Support Zones: $0.20-$0.22, $0.16-$0.18
Current Resistance Zones: $0.40-$0.45
Future Target Zones: $0.45-$0.60 (primary), $0.70-$0.80 (extended)
Key Insight: DOGE price movements often signal retail sentiment and can be leading indicators for market cycle extremes.
Future Outlook
Based on the comprehensive data analysis, several key trends may continue:
Bitcoin's Continued Dominance: BTC is likely to maintain its position as the market leader, with potential targets in the $125,000-$135,000 range in the near term, and possibility of $150,000-$160,000 in an extended bull market.
Stablecoin Growth: The continued expansion of stablecoin market caps suggests ongoing new capital inflows to the cryptocurrency ecosystem, which could fuel further price appreciation across volatile assets.
Altcoin Selectivity: The data suggests increasing selectivity in altcoin performance, with projects like ADA, XRP, and SOL showing potential for continued outperformance based on their specific adoption metrics.
Meme Coin Volatility: DOGE and similar assets may continue to experience extreme volatility, with their performance often signaling market cycle extremes.
Market Maturation: The overall market shows signs of maturation, with less extreme volatility in established assets compared to previous market cycles, suggesting growing institutional involvement.
Conclusion
The cryptocurrency market from July 2024 to July 2025 demonstrated significant growth with varying performance across assets. Bitcoin maintained its dominance while select altcoins showed remarkable growth. The inclusion of stablecoins in the analysis reveals important capital flow patterns that help explain market movements.
The data suggests a maturing market with increasing differentiation between assets based on their fundamental value propositions and adoption metrics. Stablecoins continue to play a crucial role in providing liquidity and serving as temporary safe havens during market volatility.
Future price targets should be considered in the context of broader market conditions, regulatory developments, and technological advancements that could significantly impact individual asset performance. The identified support and resistance zones provide valuable reference points for potential entry and exit levels.
A Top Down Approach will help you spot quality tradesAll the information you need to find a high probability trade are in front of you on the charts so build your trading decisions on 'the facts' of the chart NOT what you think or what you want to happen or even what you heard will happen. If you have enough facts telling you to trade in a certain direction and therefore enough confluence to take a trade, then this is how you will gain consistency in you trading and build confidence. Check out my trade idea!!
tradingview.sweetlogin.com

Surely the RBA Must Cut Rates Now?The RBA defied expectations of a cut in July, despite soft trimmed mean inflation figures in the monthly CPI report. The quarterly figures have now dropped, which I suspect leaves little wriggle room to hold at 2.85% in August. I 6ake a look at the quarterly and monthly inflation prints that matter, then wrap up on AUD/USD.
Matt Simpson, Market Analyst at City Index and Forex.com

AUS200/ASX200 - ANOTHER OPPORTUNITY TO SHORT AUS200Team, today, good data came out from the AUS200
The market has given some steroids
Time to put an end to this
SHORTING AUS200 at 8761 toward 8772 with stop loss at 8810
Target 1 at 8732-8726 - take 50% volume and bring stop loss to BE
TARGET 2 at 8712-8696
ENJOY YOUR DAY!

Daily AnalysisWe continue following our trade setup from Monday and looked into valid entries for the day

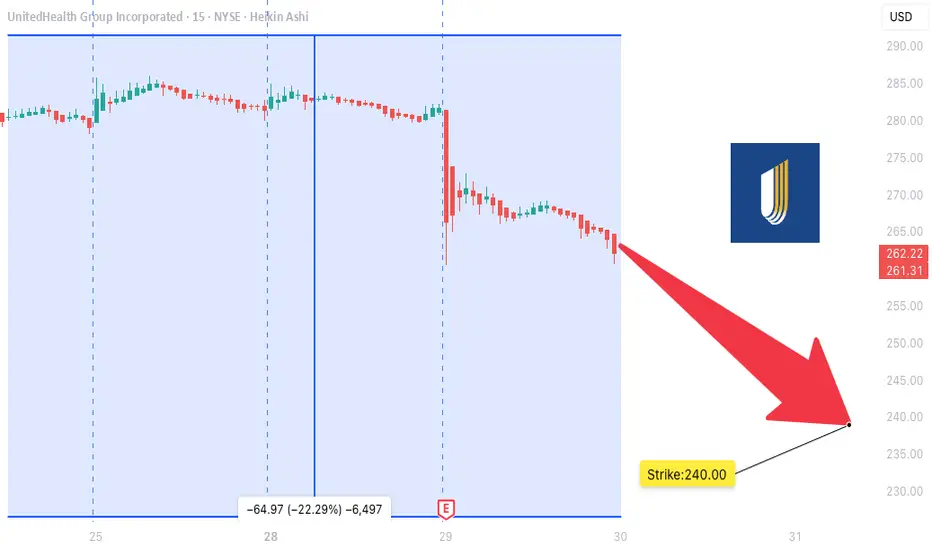
NH SWING TRADE IDEA (2025-07-29)
### 🩻 UNH SWING TRADE IDEA (2025-07-29)
**UnitedHealth Group – Bearish Setup**
📉 **Sentiment:** Moderately Bearish
📊 **Daily RSI:** 28.9 (Oversold!)
📉 **Momentum:** 5D/10D bearish
🔇 **Volume:** Weak (1.0x avg = low conviction)
💬 **Options Flow:** Neutral (C/P = 1.00)
🌬️ **VIX:** 15.71 — calm, tradable
---
### 🔻 Trade Setup
* **Play Type:** Naked PUT
* **Strike:** \$240.00
* **Expiry:** 2025-08-15
* **Entry:** \$0.85
* **Target:** \$1.35
* **Stop:** \$0.60
* **Risk Size:** 1 contract
* **Entry Timing:** Market Open
* **Confidence:** 75% 📉
---
### 🤖 Model Consensus (5 Models)
✅ All agree: **Bearish RSI + Downward Momentum**
⚠️ Disagree on *strength* of the trend: moderate vs strong
💡 Models: Claude, Grok, Gemini, LLaMA, DeepSeek
---
### ⚠️ Key Risks
* Neutral options flow = no crowd confirmation
* Weak volume = price may stall or fake out
* Watch for VIX spikes — could flip sentiment fast
---
### 🔎 Summary for Swing Traders
**UNH \$240P → \$0.85 → \$1.35**
🧠 RSI confirms downside
⛔ Low volume = trade light, manage risk
📅 Target expiry: Aug 15
🧲 Key level: \$247.13 — if broken, ride lower
BTC Moon Phase, Dominance % and BBWP resolutionBTC, D. Moon Phase. I see bearish scenario for the next days, until 4-5th of August. After reviewing Moon Phase chart for last year+, I see same scenario is happening most of the times. During the First Quarter ( Aug. 1) of the phase, price is dropping and start to recover about 4-5 days prior Full Moon. This is exactly when energy of the Full Moon starting to amplify. Current BBWP is contracted for 8 days, making the next move very rapid, I would not set any long/short trades, untill the volume start to expand. Its the mid summer - always slow and August is the month it start to accelerate towards the Fall, with all financial/political tricks happening in September and later in Q4. We already had one bear trap fakeout, but price didnt anticipate to go higher and got rejected by falling wedge upper like ( or bull flag, in this case).I would expect that high volume green candle will be either fully recovered to $110-111K , or 75% recovery, where the CME gap is $113500 - 1-2% lower, making it $113,000. The cascade liquidation will happen very fast, I expect the whole move down and up will take around 24 hours, with the bottom time 5-15 minutes. Need to be ready, that all alts will crash as well, Im expecting BTC %dominance to bounce here , after 8.4% drop to weekly 50EMA. I would like to see BTC, D% at 70% by Christmas and new ATH, what ever it is 160K or 200K what ever it is, for bitcoin to make ATH, it must grab dominance.

MU WEEKLY TRADE IDEA (2025-07-29)
### 🚀 MU WEEKLY TRADE IDEA (2025-07-29)
**Micron Technology (MU) – Bullish Call Play**
🔹 **Sentiment:** Moderate Bullish
🔹 **C/P Ratio:** 2.91 (Bullish Flow)
🔹 **RSI (Weekly):** 53.6 📈
🔹 **Volume:** Weak (⚠️ caution — low conviction)
---
### 🎯 Trade Setup
* **Strike:** \$116.00
* **Type:** CALL (LONG)
* **Expiry:** 2025-08-01
* **Entry:** \$0.62
* **Target:** \$0.89
* **Stop:** \$0.31
* **Risk:** 2–4% of account
* **Confidence:** 65% 🧠
* **Entry Timing:** Market Open
---
### 🤖 Multi-Model Consensus
5 AI Engines Agree:
✅ Buy \$114–\$116 Calls
🧠 Models: Grok, Gemini, Claude, Llama, DeepSeek
📉 Main Risk: Weak volume divergence despite strong options flow
---
### ⚠️ Key Notes
* 📊 Institutional call buying ✅
* ⚠️ Low volume = reduced confirmation
* 🎯 Play is short-dated — gamma spikes expected
* 💥 Manage exits actively near target zones
---
### 🧠 Quick Recap (for speed-readers)
**MU 116C ➜ \$0.62 → \$0.89**
💥 Weekly flow supports upside
⚠️ Volume = weak, but RSI rising
⏱️ Hold short-term with stops

HIMS WEEKLY TRADE IDEA (7/29/25)*
**💊 HIMS WEEKLY TRADE IDEA (7/29/25)**
**🔥 Bullish Flow + Rising RSI + Institutional Volume**
**📈 Trade Setup**
• **Stock**: \ NYSE:HIMS
• **Direction**: CALL (LONG)
• **Strike**: \$64.00
• **Entry**: \$0.92
• **Target**: \$1.38
• **Stop**: \$0.46
• **Size**: 2 contracts
• **Expiry**: Aug 1, 2025 (3DTE)
• **Confidence**: 80%
• **Entry Timing**: Market Open
---
**🧠 Why This Trade?**
✅ **Call/Put Ratio = 1.37** → Bullish sentiment
✅ **RSI Daily: 65.2 / Weekly: 61.3** → Momentum building
✅ **1.8x Weekly Volume Surge** → Institutional accumulation
✅ **\$64C OI = 2,616** → High liquidity + interest
⚠️ **Gamma Risk + Fast Decay** → Time-sensitive play
---
**🎯 Strategy**
→ Play the momentum spike into expiry
→ Exit quickly on profit target or 50% stop
**#OptionsTrading #HIMS #SwingTrade #EarningsPlay #TradingViewSetup #FlowTrade**

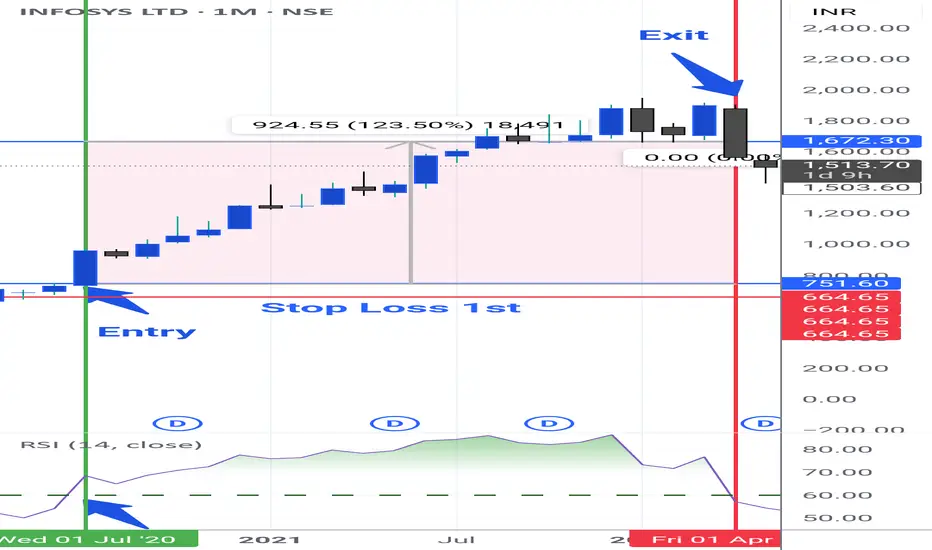
Swing & Positional Trading and Stock Options Setup _ High Beta✅ Final Setup for Positional and Swing Trades (High Beta Liquid Stocks for Cash and Options)
This trading guide outlines a simple and effective setup for both positional and swing trades, focused on high beta, highly liquid stocks. Follow the rules strictly for better consistency and profitability.
🔹 Positional Trade Setup
Chart Setup:
• Open the Monthly Chart of the stock.
• Add the RSI (Relative Strength Index) indicator.
• Uncheck all levels (30, 50, 70) and only keep one level at 60.
• Edit the level from 70 to 60 and highlight it in green.
Entry Criteria:
• Stock must cross the 60 RSI level on the monthly chart.
• Entry is only triggered if the price breaks the previous month's high.
Stop Loss:
• Place the initial stop loss below the previous month's low.
Trailing Stop Loss:
• Trail the stop loss to the current month’s low, but only after the monthly candle closes.
• Continue trailing the stop loss every month using this method until exit.
Exit Rule:
• Exit the positional trade only if the current month’s candle closes below the previous month’s low.
⚡ Note: The RSI 60+ setup is a powerful momentum strategy with high reward probability.
🔹 Swing Trade Setup
Precondition:
• Monthly RSI must cross above the 60 level.
• Switch to the Daily Chart of the stock.
• Entry Criteria:
• Identify the current swing high on the daily chart.
• Entry is triggered only when the stock breaks the swing high.
Stop Loss:
• Place the stop loss below the current swing low.
• If unsure how to mark swing low, then use a daily close below RSI 60 as your stop.
Trailing Stop Loss:
• If the trade moves in your favor, trail the stop loss to each day’s low.
Exit Rule:
• Exit the swing trade only if RSI crosses back below 60 with a daily candle close.
🔥 Stock Options Trading Strategy – Built on Core Swing/Positional Principles (75% Win Rate Setup)
I’m now sharing a Stock Options Trading Concept that follows the same core principles but is tailored specifically for liquid stock options.
For this strategy, you will strictly focus only on those High Beta Liquid Stocks provided below-
✅ Strategy Setup
🔹 Timeframe Filters:
• Monthly RSI > 60 (RSI has crossed and is holding above 60)
• Weekly RSI > 60 (same condition as above)
• Daily RSI: RSI must be crossing 60 or on the verge of crossing
Now, on the Daily Chart, mark the current swing high and swing low.
📌 Two Entry Approaches:
Approach 1: Breakout Entry
• Entry: When swing high is broken.
• Stop Loss (SL): Swing low or previous week’s low.
Approach 2: Pullback Entry
• Wait for a retracement from swing high (should not exceed 50% retracement).
• Confirmation of pullback weakness: Volume bars should be shrinking/decreasing.
• Entry: On breakout of the last candle high of the pullback.
• Stop Loss: Swing low or previous week’s low.
Once in the trade, trail your stop loss to cost after 3 consecutive bullish candles.
📤 Exit Rules
• Exit the Stock Options position only if the Daily RSI closses below 60 level.
⚠️ Important Guidelines for Stock Options
• 💡 Trade with only 1 lot. Never exceed your lot size.
• 📅 Enter after 2 days of the monthly expiry and exit before 2 days of next monthly expiry to avoid smart money manipulation.
• 🎯 Choose strike prices in multiples of 25, 50, 75, or 100 for better liquidity.
Example: If stock is at 1564, choose 1550 ITM or 1575 ATM.
• ⏱️ For quick exits, always place exit orders at round numbers like 5 or 10 levels.
• Example: If you entered at ₹70 and the option is at ₹144, place an exit at ₹140 or ₹145—not any random price.
For PE buying-
Monthly RSI < 40
Weekly RSI < 40
Daily RSi crossing 40 or below
Same process for PE with 2 approach as you like but in reverse form.
📊 75 High-Beta, Highly Liquid NSE Stocks
These stocks are liquid, fundamentally strong, and mostly traded in the F&O segment — giving you both flexibility and depth.
🚗 Auto
• Bajaj Auto
• Bosch Ltd
• Eicher Motors
• Hero Motocorp
• Maruti Suzuki
• TVS Motors
• Tata Motors
🏦 Banking & Financial Services
• Bank of Baroda
• Kotak Mahindra Bank
• Axis Bank
• ICICI Bank
• HDFC Bank
• IndusInd Bank
• Bajaj Finserv
• Bajaj Finance
• SBI
🧪 Chemicals
• Aarti Industries
• Atul Ltd
• Navin Fluorine
• UPL
• Tata Chemicals
🍫 FMCG
• Britannia Industries
• Godrej Consumer
• Tata Consumer
• DMart
• Hindustan Unilever
• Dabur
💊 Pharma & Healthcare
• Apollo Hospitals
• Alkem Labs
• Biocon
• Divis Labs
• Dr. Reddy’s
• IPCA Labs
• Laurus Labs
• Lupin
• Aurobindo Pharma
• Sun Pharma
• Cipla
💻 IT Sector
• HCL Technologies
• Infosys
• LTIMindtree
• TCS
• Tech Mahindra
• Wipro
⛓️ Steel & Metals
• APL Apollo Tubes
• JSW Steel
• Jindal Steel
• Tata Steel
• Hindalco
• L&T
🛢️ Oil & Gas
• Reliance Industries
• Gujarat Gas
• Indraprastha Gas (IGL)
• Mahanagar Gas (MGL)
• Tata Power
🏢 Realty
• DLF Ltd
• Godrej Properties
• Lodha (Macrotech Developers)
• Oberoi Realty
• Phoenix Mills
🛋️ Durables & Others
• Sona BLW (Sona Comstar)
• Amber Enterprises
• Bata India
• Crompton Greaves
• Dixon Technologies
• Titan Company
• ACC Cement
• Ambuja Cement
• Ultratech Cement
• Voltas Ltd
• Polycab India
• Mazagon Dock (Mazdock)
• Asian Paints
• Berger Paints
📝 Final Thoughts
This is not just a strategy — it’s a framework to reprogram your trading mindset. Use higher timeframes, respect structure, and focus only on high-probability setups. You’re not here for noise. You’re here for moves that matter.
If this helped you, prepare a trading journal based on this strategy. Stay focused. Be consistent. Trade less, but trade right.
Midcap and Small cap stocks are only used for Positional Trading Long Setup for longer periods ex 6 months to a year.
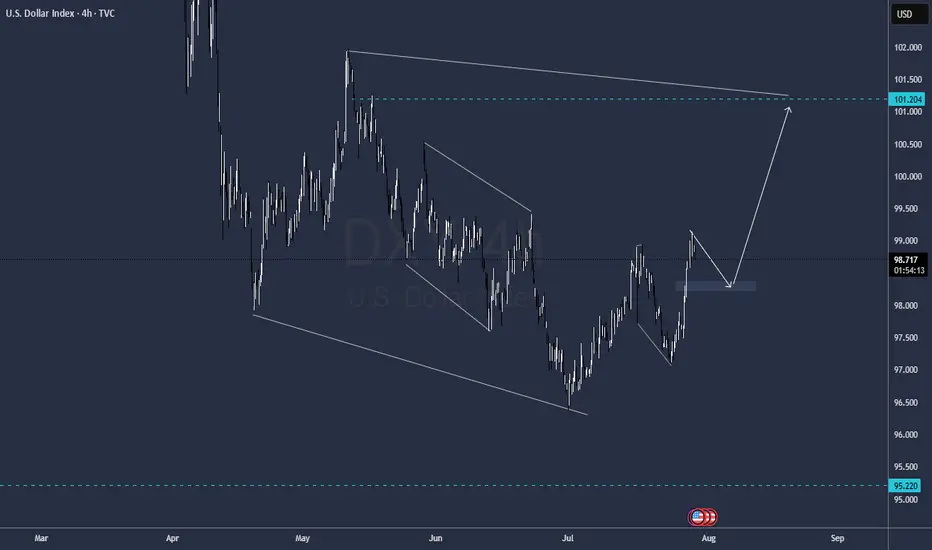
DXY dayly structureMay change indeed
but its pretty much what meassures and current development is showing
GG
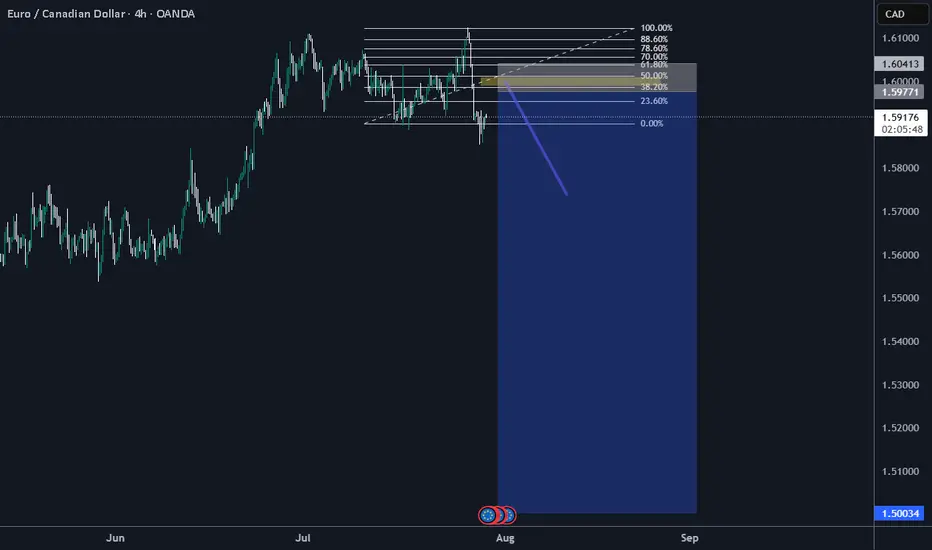
Daily Analysis- XAUUSD (Wednesday, 30th July 2025)Bias: Bullish
USD News(Red Folder):
-ADP Non-Farm Employment Change
-Advance GDP q/q
-Federal Funds Rate
-FOMC Statement
-FOMC Press Conference
Notes:
- Bullish closure after daily liquidity sweep
- Looking for price to respect 0.618 fib level
- Potential BUY if there's
confirmation on lower timeframe
- Pivot point: -
Disclaimer:
This analysis is from a personal point of view, always conduct on your own research before making any trading decisions as the analysis do not guarantee complete accuracy.

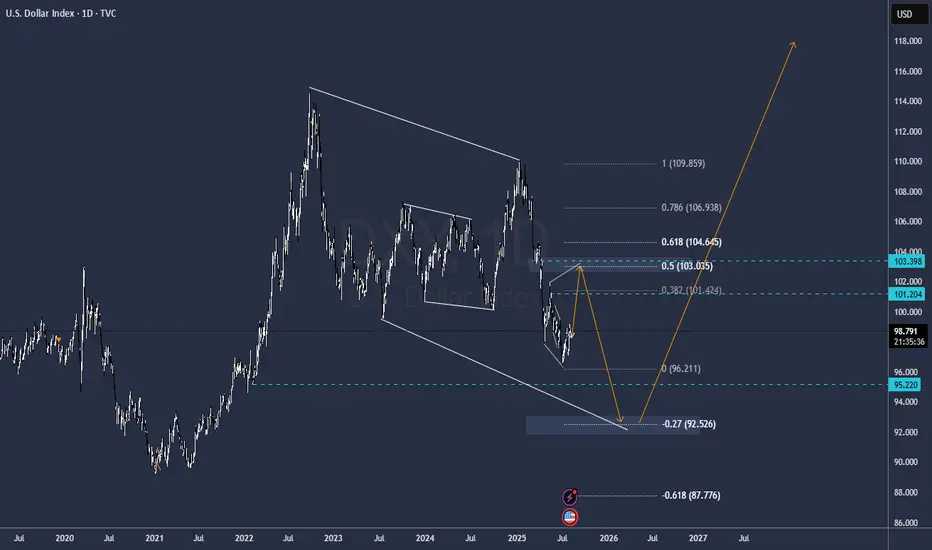
DXY FOMC FORECASTCristal Clear structure to me, dolar down today before FOMC and then up wild
Levels highlighted
Najors Gold and Cryptos will follow the same behavior
GG
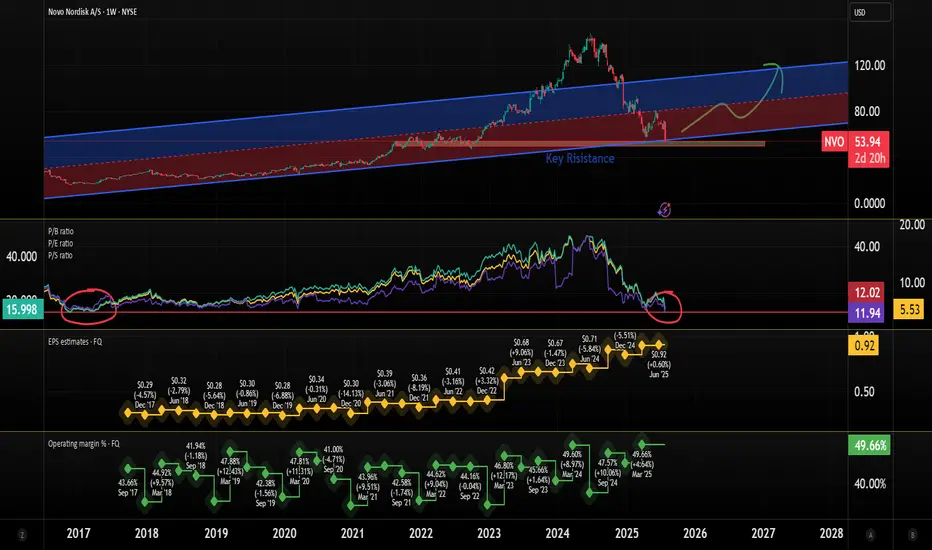
Is Novo Nordisk a buy? Novo Nordisk $NYSE: NVO plummets 22% on July 29, wiping out $57.5B in market value!
Here's what's happening and how I see it.
Here’s the breakdown on why the stock hit its lowest since Nov 2022:
Slashed 2025 Guidance: Sales growth cut to 8–14% from 13–21%, operating profit to 10–16% from 16–24%. Weak U.S. demand for Wegovy & Ozempic, plus competition from cheaper compounded GLP-1 drugs (i.e. grey market), cited as key issues.
CEO Shake-Up: Lars Fruergaard Jørgensen out, Maziar Doustdar in as CEO effective Aug 7. Investors worry Doustdar’s limited U.S. experience could hurt Novo’s edge in its biggest market (57% of sales).
Competition: Eli Lilly’s Zepbound (20.2% weight loss vs. Wegovy’s 13.7%) & Mounjaro are stealing market share. Compounded GLP-1s from Hims & Hers add pricing pressure.
Here's what I see:
There's a strong bearish sentiment, but the stock is very underpriced.
Considering the current stock price, EPS is at an all-time high. This means investors get more earnings for their stock.
P/B, P/E, and P/S ratios are at the lowest level since 2017! This is despite revenue growth of 25%+ for 3 consecutive years.
Operating margins are still quite healthy.
The company still has a very significant share (over 50%) of the GLP1 drugs worldwide.
The valuation of this company is now at the best level of the last 7-8 years.
There might be more volatility ahead, but I see the recent price drop as an opportunity to buy a pharma giant at a big discount, giving investors a margin of safety.
Quick note: I'm just sharing my journey - not financial advice! 😊
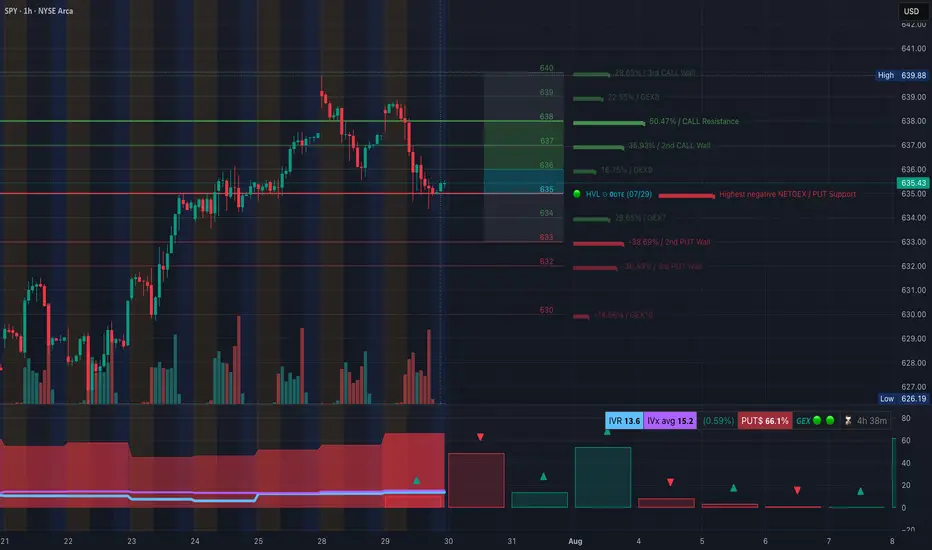
SPY at the Edge of Breakdown or Bounce? Jul 30SPY at the Edge of Breakdown or Bounce? Watch These Gamma & Structure Levels Closely 🔥
🔹 GEX Insights for Options Trading (1H GEX Chart):
SPY currently sits at $635.43, hovering just above the highest negative GEX level at $635, which often acts as short-term PUT support or a reversal trigger when price reaches exhaustion.
The most concentrated CALL gamma cluster sits between $637 and $640, with the strongest resistance at $638 (50.47% GEX level) and $639 (2nd CALL Wall). These levels could magnetize price in a squeeze but also act as rejection zones if not broken with force.
Below, strong PUT gamma walls are stacked at:
* $633 (2nd PUT wall, -38.69%)
* $632 (3rd PUT wall, -30.49%)
* $630 (GEX10 level, -14.66%)
These act as liquidity targets for downside expansion if bears push through.
Options Oscillator:
* PUTS dominant at 66.1%
* IVR: 13.6 (low, potential for future expansion)
* GEX: Green, indicating slight bullish gamma tilt short-term
→ Watch for volatility expansion if this support zone fails.
📌 Gamma Summary:
* As long as SPY holds above $635, a bounce toward $638–640 remains on table.
* Below $635, a flush into $633–630 becomes the next logical destination.
* IV crush seems done—next move likely gets direction from a volatility expansion event.
🔹 1-Hour Intraday Technical Analysis (Price Action + SMC):
SPY shows clear structural weakness after the Break of Structure (BOS) to the downside followed by a Change of Character (ChOCH) confirming a shift to bearish order flow.
The most recent rally was capped at a supply zone (highlighted in purple) near $639–640, where we saw consistent selling and volume exhaustion.
Currently, price is:
* Resting on the ascending trendline from July 23rd
* Approaching a demand zone around $632–630, which aligns with GEX support zones.
What to watch:
* A clean reclaim above $636.94 (local BOS level) could open a path for bullish retest of $638.88.
* If SPY loses $634.50, we likely dive into the next demand zone at $630, then possibly $628.00 or even $626.19.
This structure sets up a binary setup:
* Either we bounce from here and reclaim $636+ or,
* We continue the breakdown toward lower liquidity zones.
🎯 Suggested Option Plays (based on TA + GEX):
Bullish Scenario:
* CALL entry: On break and hold above $637 with volume
* Target: $639.88 → $640
* Stop: Below $635.20
Bearish Scenario:
* PUT entry: If SPY rejects at $636.94 or fails $634
* Target: $632 → $630 → $628.00
* Stop: Above $637
Scalpers can play both sides using tight risk around the gamma pivot at $635.
Conclusion:
SPY is teetering at a high-confluence pivot zone where GEX support, structure demand, and trendline meet. Whichever side breaks first—above $637 or below $634—will likely dictate the next wave of directional momentum.
Stay reactive, not predictive. Use the GEX zones to frame your trade ideas and execute only on confirmation.
Disclaimer: This analysis is for educational purposes only and does not constitute financial advice. Always do your own research and manage your risk before trading.
NVDA Rejection From Supply! July 30NVDA Rejection From Supply! Will Gamma Walls Trap Bulls Below 178? 🔥
🧠 GEX-Based Options Outlook (1H GEX Chart)
NVDA currently trades around $176, just below the key Gamma Wall at $178, which aligns with the Highest Positive NETGEX zone and a Call Wall cluster between $178–$180. This setup suggests that any move above $178 will face strong gamma resistance, and market makers will likely hedge by shorting, making it harder for price to rally.
* GEX Zones Overview:
* Strongest Call Walls: $180, $182.5, $185
* Gamma Wall: $178 (Major resistance)
* PUT Walls: $170, $167.5, $165 (Defensive zones)
* IVR is very low at 11.5, and IVx is near average at 40.8 — implying premiums are cheap, and buyers of options may benefit if volatility spikes.
📉 Bias: Neutral-to-Bearish short-term unless NVDA cleanly reclaims $178 with volume.
💡 Options Suggestions:
* Put Debit Spread: Buy 175 Put / Sell 170 Put (limited risk, targeting a move to GEX7 zone)
* Call Credit Spread: Sell 178 Call / Buy 182.5 Call (fade the resistance zone with defined risk)
* Directional Put: Buy 175 Put for potential flush to 172 or lower if GEX support fails
📊 1-Hour Intraday Technical Analysis
Market Structure & Smart Money Concepts:
* A clear Change of Character (CHoCH) occurred after price failed to hold the ascending trendline from July 24–29.
* Break of Structure (BOS) at $176.75 confirmed the shift from bullish to corrective.
* Price is now under the order block rejection zone (highlighted pink) and has respected a bearish supply reaction.
Support/Resistance:
* 🔻 Resistance: $176.75 (previous BOS), $178 (Gamma Wall)
* 🟢 Support: $172.94 (FVG zone) and strong PUT wall at $170
* Critical liquidity zone sits between $165–$168 — this is a potential magnet if downside accelerates.
EMA 9/21 Status:
* Bearish crossover already triggered.
* Price now trades below both EMAs, reinforcing bearish short-term control.
Volume Analysis:
* Last few red candles show increasing sell volume — institutional exit or short entry likely occurred.
🔀 Scenarios to Watch
Bullish Intraday Setup:
* If NVDA reclaims $176.75 with strong momentum and breaks above $178 (Gamma Wall), potential to squeeze to $180 and $182.5.
* Entry: $177.20+ reclaim
* Stop: $175.90
* Target: $179.65 → $182.50
* ⚠️ Needs strong volume and VIX relief to work
Bearish Intraday Setup (High-Probability):
* Price stays below $176 → fade any retest of $176.75
* Entry: $175.90 or below
* Stop: $177.30
* Target 1: $172.94
* Target 2: $170
* Extended: $167.5 if GEX support collapses
📌 Final Thoughts
NVDA just triggered a bearish shift in structure after a strong run. With IV still low and GEX pressure mounting at the $178 level, the setup leans more toward bearish-to-sideways chop unless bulls reclaim key resistance. Ideal strategy is to fade into resistance and scale out near the lower GEX walls.
This analysis is for educational purposes only and does not constitute financial advice. Always do your own research and trade responsibly.

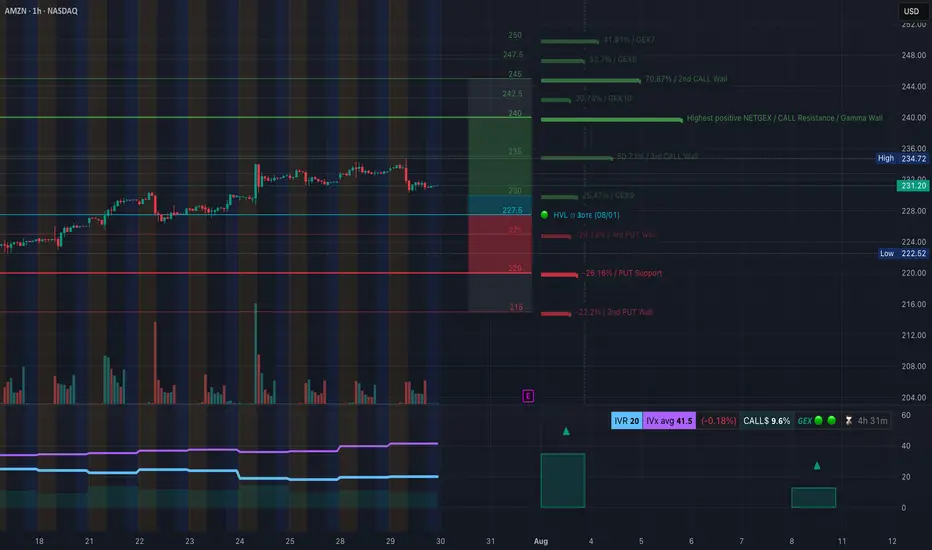
Will $222 Hold or Are We Heading for $215 Flush? July 30AMZN Breakdown in Progress!
🔍 GEX Insights & Options Trading Thoughts (1H Perspective)
Amazon (AMZN) is transitioning from a distribution phase into a potential gamma-driven selloff, and the current GEX setup confirms that bias. The GEX walls are sharply stacked on the downside, while call walls remain heavy above current price—creating strong overhead pressure.
🔸 Gamma Exposure Breakdown:
* Highest Positive GEX (Call Resistance):
* $236 → this is where market makers lean short, and we see strong rejection wicks from this zone.
* 3rd Call Wall: $236
* 2nd Call Wall: $242.5
* GEX Flip Zone / Transition Area: $231–227.5
* Below this = gamma turns negative, increasing downside velocity
* PUT Walls:
* $225 = 3rd PUT Wall (-20.13%)
* $220 = Major PUT Support (-26.16%)
* $215 = 2nd PUT Wall (-22.2%)
The positioning suggests a gamma gravity pull toward $225 → $222, with high risk of flush to $215 if $222 breaks.
🔸 Options Setup Suggestions:
* Bias: Bearish
* Ideal Option Play:
* Aug 2 / Aug 9 $225P or $220P
* Enter on failed retest of $231
* Exit partial at $225, full at $222 or $215
* Avoid chasing puts too late—look for retest rejection near $231–232
If you're conservative, watch for a break and close below $227.5 to confirm further drop before entering.
🧠 1H Intraday Technical Analysis (TA)
Market Structure:
* AMZN broke below the ascending trendline, showing a clean CHoCH (Change of Character) after price rejected $236 twice—clear sign of distribution.
* BOS → CHoCH sequence confirmed, showing the shift from bullish to bearish order flow.
* Price is now trapped below the former support zone ($231.5), which has turned into supply.
Supply & Demand Zones:
* Supply Zone (Resistance): $234.5–236
* Micro Supply (Retest Area): $231.5–232.5
* Demand Zone (Support): $223–222
* Next Key Demand: $215
* If $222 fails, there’s minimal liquidity support until $215
Volume & Confirmation:
* Volume profile shows declining participation on upside pushes, followed by heavy sell volume candles post-CHoCH.
* This supports the idea of institutional distribution above $234.
🧭 Trading Outlook
🔻 Bearish Intraday Play (Favored):
* Entry 1: Retest rejection at $231.5–232
* Entry 2: Breakdown below $227.5
* Target 1: $225
* Target 2: $222.5
* Target 3: $215 (if panic flush triggers)
* Stop Loss: Above $234
🔼 Bullish Reclaim (Less Likely):
* Needs to reclaim $234.5 with strength
* Would target $236, $240
* Not supported by GEX or volume—low probability
🧠 Final Take:
AMZN is now trapped beneath heavy call walls and has shifted structure with a confirmed CHoCH. GEX shows negative gamma territory below $227.5, creating a slippery slope toward $222. The option market is positioning for further downside while intraday structure aligns for a potential flush into lower demand zones. Unless bulls reclaim $234+ with volume, this setup remains bearish biased with favor to PUT side trading.
🛑 This breakdown is for educational purposes only and does not constitute financial advice. Trade at your own risk and always manage your positions carefully.
TSLA Rejection at Supply! Breakdown & Options Outlook. Jul 30🔍 Technical Analysis (1H Chart)
TSLA failed to hold above the mid-supply zone around 330–335, rejecting cleanly after forming what looks like a double top on the 1-hour chart — a bearish reversal pattern. Price has since made a CHoCH (Change of Character), confirming shift in market structure from bullish to short-term bearish.
We now see price hovering just above 320, which aligns with GEX and SMC support zones. Volume on the rejection candle was higher than average, confirming strong selling pressure.
A bearish BOS (Break of Structure) also aligns with the double top, adding conviction that bulls are weakening.
🧠 GEX & Options Sentiment (Options GEX Chart)
* Highest Gamma Wall (Call Resistance): 338.48
* Current Price: 325.78
* Gamma Weak Zone: 325–335
* PUT Wall (Support): 300
* IVX avg: 51.5 (neutral/low vol), IVR: 6.2
* Call/Put Sentiment: Balanced — Calls: 49.5%
GEX sentiment shows TSLA is pinned in a gamma transition zone, stuck between heavy resistance above and decent put support near 300–310. That’s your battlefield.
🎯 Trading Scenarios (1H View – Swing)
Bearish Setup
* Entry: Below 319 confirmation
* Target 1: 310
* Target 2: 300 (GEX put support)
* Stop: 326 (above CHoCH zone)
* Bias: 🔻 Until demand zone or reclaim of 330
Bullish Reclaim Scenario
* Entry: Above 330 with volume
* Target: 338 then 345
* Stop: 324
⚡ 15 Min Intraday Scalping Outlook
* Bias: Bearish unless reclaim 326+ with strong volume
* Expect short-term bounces off 315 or 310 for scalp CALLs
* VWAP resistance will be key intraday
* Keep an eye on MACD crossover + OB (Order Block) entries on micro pullbacks
🎯 Suggested Options Play
For Bearish Move (if 319 breaks):
* 🛑 Buy TSLA Aug 2 PUT 320 or 315
* 🎯 Target IV expansion near 305
* Tight stop — re-evaluate above 326
For Bounce from 310–315 Zone:
* 🎯 Buy TSLA Aug 2 CALL 320 if strong reversal + OB entry
* Scale out near 325–328
* Risk defined: below 310
🔚 Summary
TSLA shows weakness after forming a double top and CHoCH at the 330–335 level. Gamma levels suggest pressure toward 310–300 unless bulls defend fast. Watch the reaction at 319–320 for short entry, or at 310–315 for scalping bounce setups.
Disclaimer: This analysis is for educational purposes only. Always do your own research and manage risk accordingly.

GOOGL Approaching Inflection Point! Jul 30GOOGL Approaching Inflection Point! Will It Hold Above 195 or Break Down to 190? 🚨
GEX Options Sentiment Overview (1H Chart)
GOOGL's current price hovers around $195.30, right under a cluster of heavy Call Walls:
* 197.5 is the 3rd Call Wall (65.53%)
* 200 is the 2nd Call Wall (88.34%)
* 205-210 shows diminishing gamma influence but still has meaningful hedging overhead
Meanwhile, downside Put Support levels are more scattered:
* 190 marked as HVL and near a GEX neutral zone
* 187.5 sits on PUT Support (-22.57%)
* 180 aligns with the 3rd Put Wall
The GEX magnet appears strongest between 195–197.5, while 190 acts as a gamma floor and volatility trigger if breached. Overall GEX sentiment is neutral-to-bullish short-term, with dealers possibly pinned until a gamma release.
Options Strategy Thoughts:
* Bullish: Consider a short-term debit call spread (195C/200C), targeting a gamma squeeze above 197.5 if market flows support continuation.
* Neutral-leaning-bearish: Sell credit spreads like 200C/205C if GOOGL gets rejected at 197.5 zone and starts to compress below 194.50.
IVR is low at 16.7, while IVx is elevated near 31, suggesting buying premium could still pay off if price breaks key gamma levels fast.
Intraday Technical Analysis (1H Chart)
The 1-hour chart shows clear structure and breakout momentum:
* Break of Structure (BOS) confirmed above 194.70 on July 29
* Strong upside rally retested and held trendline support
* Price is consolidating in a tight box between 194.9–195.5, forming a potential bullish flag/channel
* Fair Value Gap (FVG) has formed near 192.5, unfilled — could serve as liquidity target if price dips
Key Support Levels:
* 194.03 (mid-level retest zone)
* 192.58–190.85 is a demand cluster and previous ChoCH zone
Key Resistance Levels:
* 197.5 is both a key psychological and GEX resistance level
* 200 is strong resistance based on Call Wall and prior swing highs
Price Action Outlook:
* As long as GOOGL holds above 194, the bullish bias remains intact.
* A breakout above 195.50 with volume opens the door toward 197.5 and potentially 200.
* A drop below 194 signals potential pullback to 192.5 or even deeper liquidity sweep toward 190.
My Thoughts for Tuesday's Setup:
* Scalpers: Watch for breakout retest at 194.90–195 zone. A strong 1H candle close above 195.50 with volume confirms scalp-long opportunity to 197.5.
* Swing traders: Risk-to-reward favors long above 194 with stops under 192. Targets: 197.5 → 200.
* Options: If GOOGL rejects 197.5 again, fading with cheap OTM puts targeting 190–192.5 could reward well, especially into August expiration.
Disclaimer: This analysis is for educational purposes only and does not constitute financial advice. Always conduct your own research and manage risk appropriately before trading.

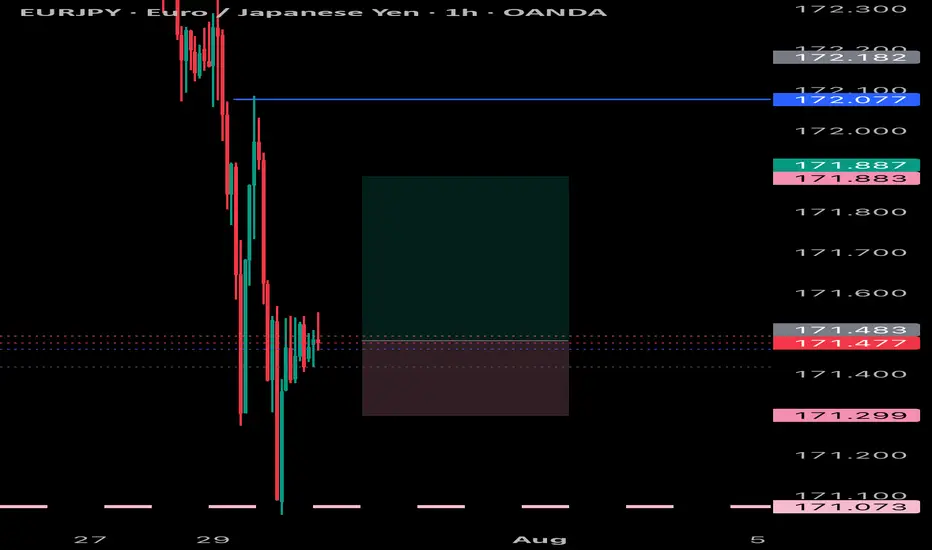
EUROYENEurjpy has shorter pullbacks within an ascending structure ,shall keep following it and expect it to reach a fair mount of highs or levels