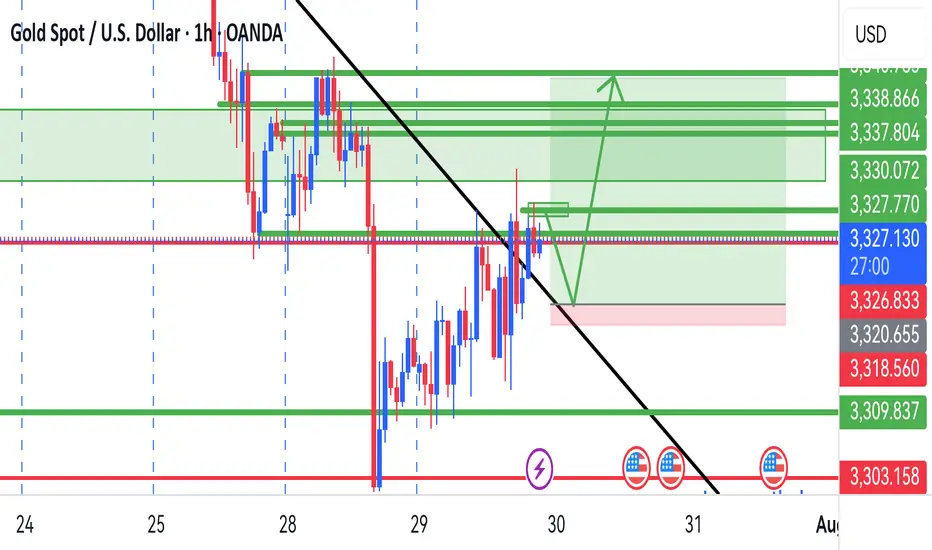
GOLD GOLDEN XauUsd is now still respecting the trend and will keep holding expecting an even stronger push to the up side
Beyond Technical Analysis
GOLD this snicky GuyTruth be told, im not a big fan of this scenario, its going up mssy but it still looking Bulish, i I have to make a call I will be tking the sell from 3370 and yeah mayb the buy with really, really small risk, but its is up to you
Levels labeled in the chart
GG
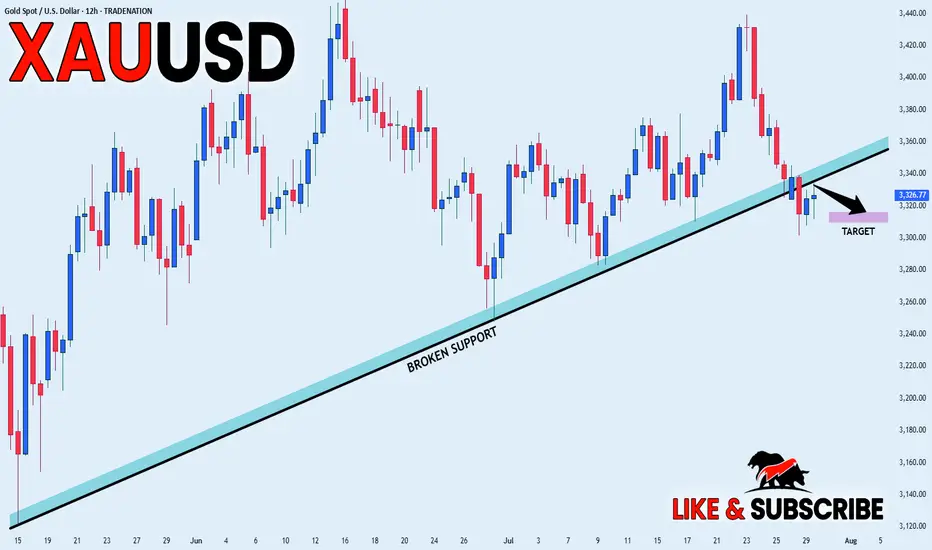
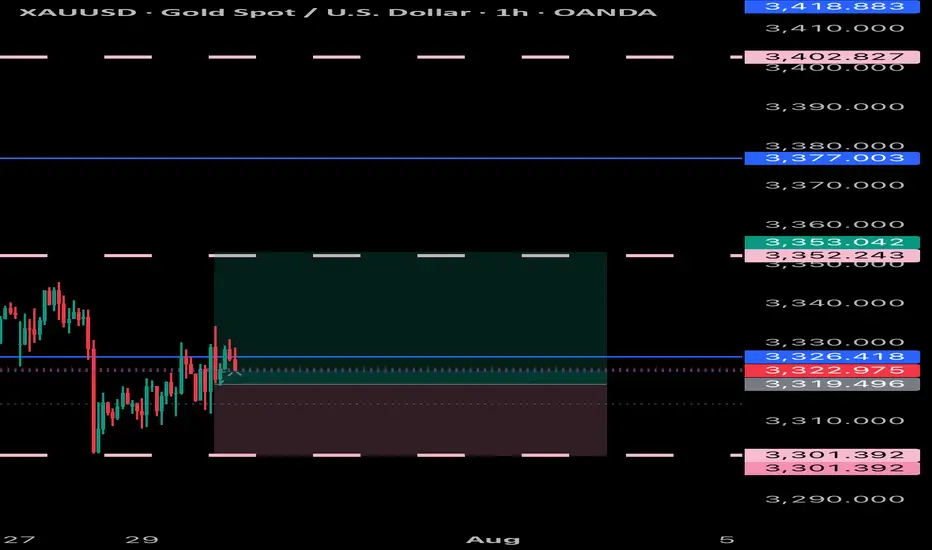
GOLD BEARISH BIAS|SHORT|
✅GOLD broke the rising
Support line which is now
A resistance and the price
Is retesting the line now so
We are locally bearish biased
And we will be expecting a
Local move down
SHORT🔥
✅Like and subscribe to never miss a new idea!✅
Disclosure: I am part of Trade Nation's Influencer program and receive a monthly fee for using their TradingView charts in my analysis.
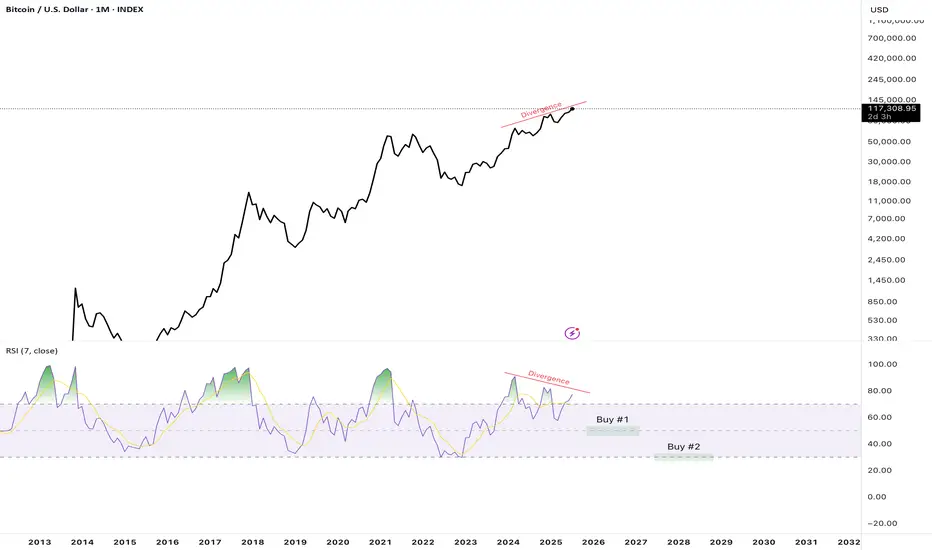
BTC getting ready to dump? Divergence like not yet seen on BTC MDivergence is one of the best indicators for potential price reversal... and BTC is building one like we've never seen before on monthly chart. Be extremely careful with your buy positions at this time, and make sure you save money for the next opportunities to get in big when the RSI hits lower. Good luck.
WING Earnings Play (2025-07-29)
**🍗 WING Earnings Play (2025-07-29)**
**🔥 Oversold Setup + 88% Beat Rate = Opportunity**
**🎯 Trade Plan**
• **Stock**: \ NASDAQ:WING
• **Type**: Call Option (LONG)
• **Strike**: \$290
• **Entry**: \$19.20
• **Target**: \$38.40
• **Stop**: \$9.60
• **Expiry**: Aug 15, 2025
• **Entry Time**: Before earnings (AMC 7/30)
• **Confidence**: 72%
• **Expected Move**: ±5%
• **IV Rank**: 75 (Elevated)
**📊 Why WING?**
✅ **RSI = 19** (deeply oversold)
✅ 88% earnings **beat rate** (last 8 Qs)
✅ 17.4% **YoY rev growth**
✅ Volume up 1.28x avg
📈 Setup for **volatility crush + upside surprise**
**⚠️ Risk/Reward = 2:1+**
Cut below 50% premium loss. Target double on upside earnings breakout.

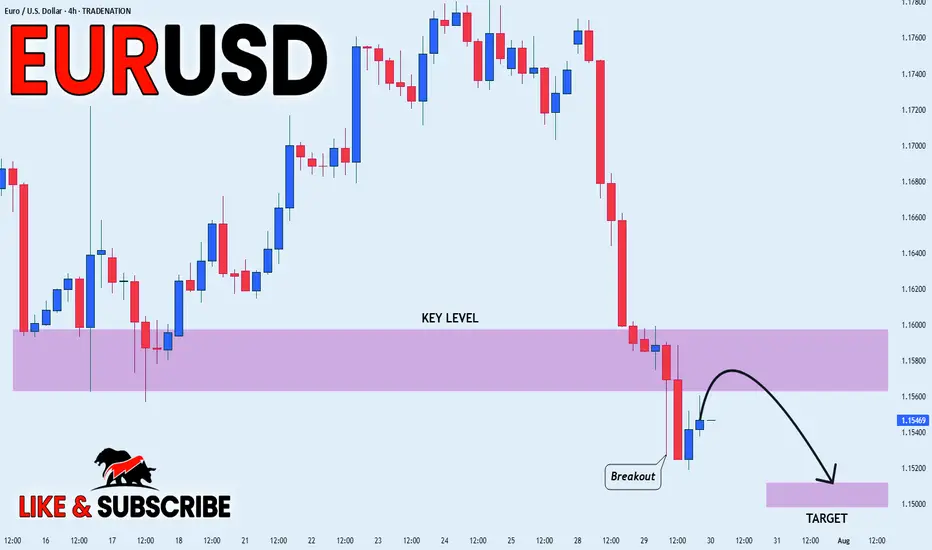
EUR_USD BEARISH BREAKOUT|SHORT|
✅EUR_USD broke the key
Structure level of 1.1580
While trading in an local downtrend
Which makes me bearish
And I think that after the retest of
The broken level is complete
A bearish continuation will follow
SHORT🔥
✅Like and subscribe to never miss a new idea!✅
Disclosure: I am part of Trade Nation's Influencer program and receive a monthly fee for using their TradingView charts in my analysis.
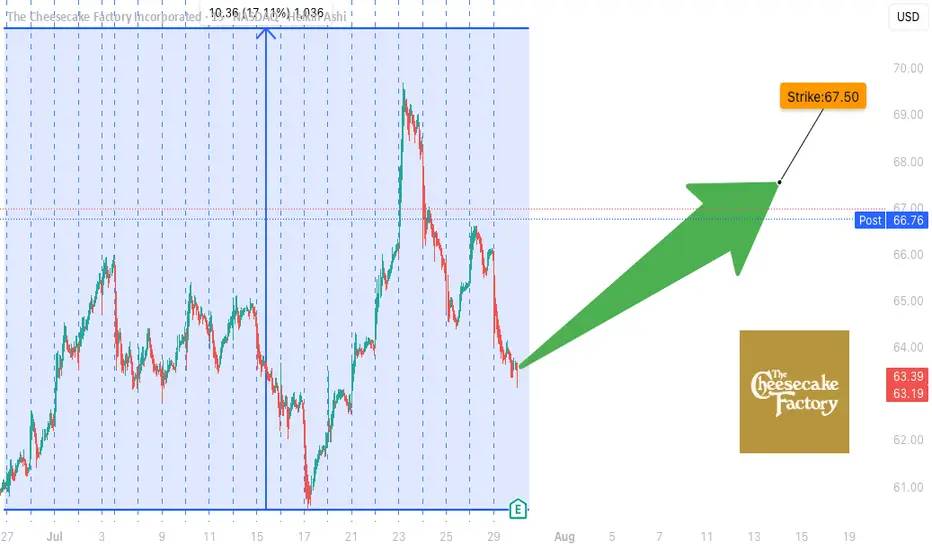
CAKE Earnings Trade Setup (2025-07-29)
**🍰 CAKE Earnings Trade Setup (2025-07-29)**
🎯 **Bullish Bias** | Confidence: **72%**
💡 **Historical Beat Rate: 88%** | Strong pre-earnings drift
**📊 TRADE DETAILS**
• **Instrument**: \ NASDAQ:CAKE
• **Strategy**: Buy CALL
• **Strike**: 67.50
• **Entry**: \$1.45
• **Target**: \$2.90+
• **Stop**: \$0.72
• **Expiry**: 2025-08-15
• **Timing**: Pre-earnings close (AMC)
**📈 Setup Rationale:**
✅ History of positive earnings surprises
✅ Stock above key MAs with room to run
⚠️ Margin pressure & mixed options flow = manage risk closely
**🔥 Risk/Reward: \~2:1+**
Cut early if earnings miss. Target 200%+ return on surprise beat.
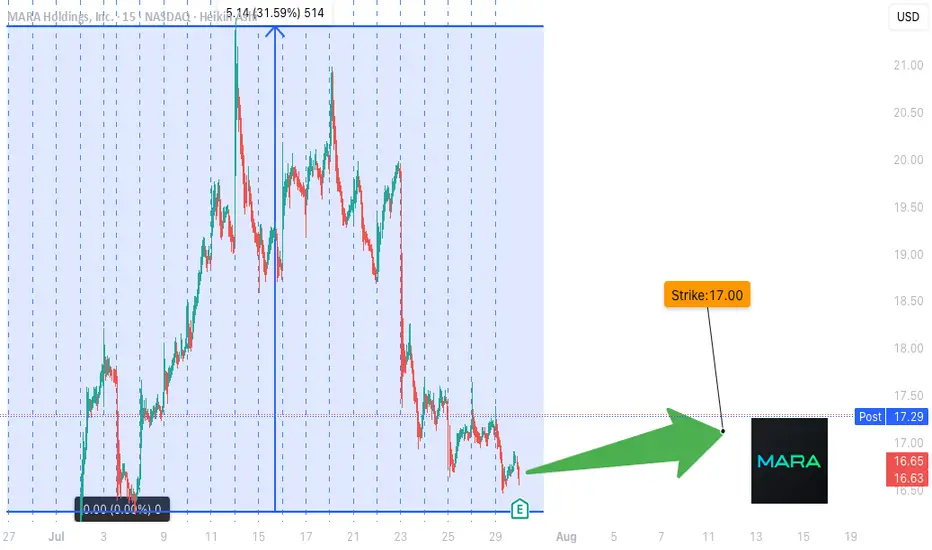
**MARA Earnings Setup – TradingView Breakdown**
🚨 **MARA Earnings Setup – TradingView Breakdown** 🚨
📅 *Earnings Play for 07/29/2025*
🎯 *Strike: \$17.00 Call | Exp: 08/01/2025*
💰 *Premium: \$0.59 | Target: \$1.18*
📈 *Conviction: 75% Bullish*
🔹
---
🧠 **What’s the Setup?**
MARA just raised \$950M to expand BTC holdings 💥
Revenue YoY growth: **+29.5%** 📊
Margins still rough: **-46.7% profit**, but potential catalyst is 🔥 if BTC pumps.
---
🧨 **Options Flow Is Heating Up**
👀 Massive open interest on **\$17 Calls**
🤏 Put/Call Skew slightly bullish
🧮 IV low despite high beta (6.55) = **cheap volatility play**
---
📉 **Oversold + Coiled Tight**
📉 RSI: 38.57 (Oversold)
📍 Support: \$16.50 | Resistance: \$17.50
💣 Sitting at key technical inflection pre-earnings.
---
🔮 **Trade Idea**
🎯 *Buy \$17C @ \$0.59*
🚀 Target: \$1.18 (2x gain)
🛑 Stop: \$0.30
📆 Exit within 2 hrs post-ER to avoid IV crush
---
📊 **Risk/Reward**
💰 Max Loss: \$59
📈 Potential Gain: \$118
⚖️ R\:R = 2:1
---
🔥 **Why It Could Go Viral**
✅ Bitcoin bullish narrative
✅ High beta + cheap IV = explosive setup
✅ Oversold technicals + earnings catalyst
---
🔁 **Like & Save this if you're playing MARA ER 🔥**
\#MARA #EarningsPlay #OptionsTrading #BitcoinStocks #TradingView #ShortSqueeze #CallOptions #HighBetaSetup #CryptoStocks #EarningsSeason #MARAAnalysis #TradingStrategy #Fintok #Finfluencer
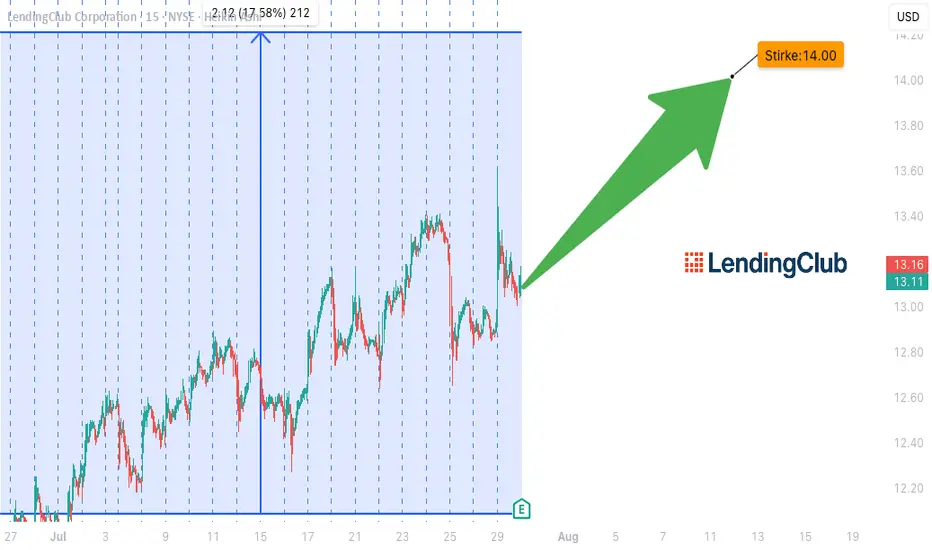
LC EARNINGS PLAY – STRIKE WHILE IT'S HOT!**
🚨 **LC EARNINGS PLAY – STRIKE WHILE IT'S HOT!** 🚨
📅 **Earnings Season Heat Check: LC | Jul 29**
💰 **Positioning for a Post-Earnings POP!**
---
🔥 **The Setup:**
LC’s earnings momentum is real –
📈 TTM Rev Growth: **+13.1%**
💹 EPS Surprise Rate: **150% avg**
📊 75% Beat Rate History
💵 Analyst Consensus: **Strong Buy (1.8/5)**
---
📉 **Technical Tailwind:**
✅ Price above 20D + 200D MA
✅ RSI: **60.07** – room to run
📈 Volume Spike: **+61% above 10-day avg**
🚀 Options flow targeting **\$14 CALLS** w/ OI: **864** / Vol: **737**
---
📌 **TRADE IDEA**
🎯 Buy: **\$14.00 Call @ \$0.70**
📆 Exp: **Aug 15, 2025**
🎯 Target: **\$2.10** (Risk/Reward = 1:3)
🛑 Stop: **\$0.35**
---
⚠️ **Earnings Risk:** IV crush real.
🎯 Exit within 2 hours **post-EPS** if no move.
Macro tailwinds + financial sector rotation = 🚀 fuel.
**Beta = 2.45** → Big move potential incoming!
---
🧠 Confidence Level: **75%**
⏰ Timing: Pre-Earnings Close
🧾 Model-Driven Strategy | No Hype, Just Edge.
---
💥 Let’s ride the LC earnings wave – \$15+ in sight! 💥
\#LendingClub #LC #EarningsPlay #OptionsTrading #TradingView #StocksToWatch #CallOption #Fintech #SwingTrade #EarningsHustle #BullishSetup #IVCrush #EarningsGamma #ShortTermTrade
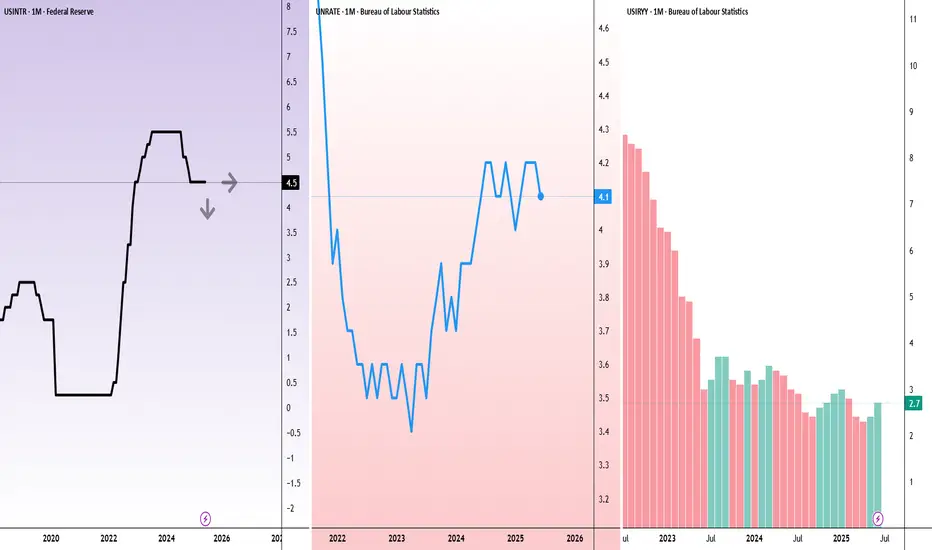
Latest on Fed rate cut debateThe Fed isn’t expected to cut rates this week, but this FOMC meeting should still be very interesting.
Powell will need to address growing pressure from board members Waller and Bowman, who’ve both called for cuts, citing limited inflation impact from tariffs.
Still, Powell is just one of 12 votes on the FOMC, and there’s little sign of broader support for a cut.
With the labour market steady and early signs of tariff-driven inflation, the Fed has reason to hold. The rate decision is due Wednesday at 2 p.m. ET, followed by Powell’s press conference at 2:30 p.m. ET.
This decision will further widen the rift between the Fed and President Trump, whose frustration has grown in recent weeks, with renewed attacks on Powell’s leadership.
The tension has drawn international attention. On Monday, the IMF issued a warning about political interference in central banks, which can pose a threat to global financial stability.
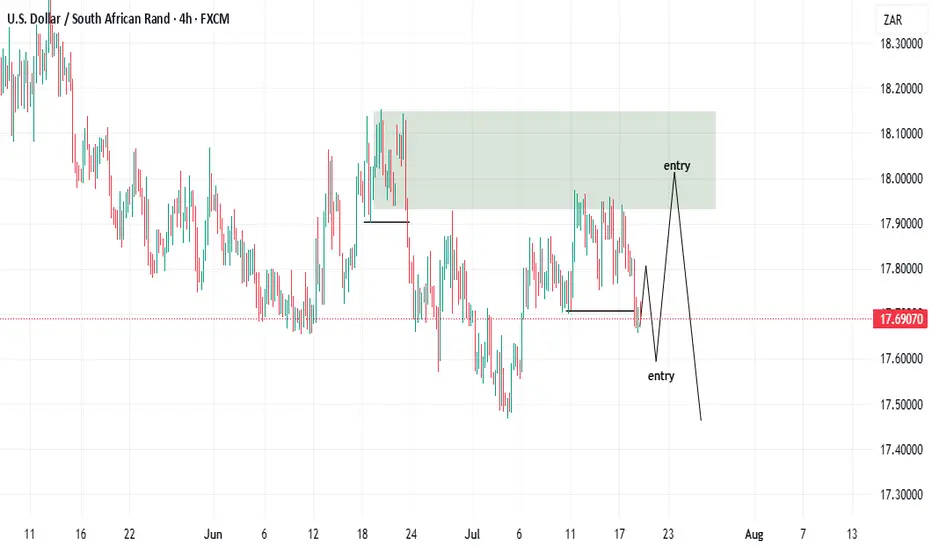
buy then sell!Hello all. I had a time to check some other pairs as USDZAR. I don't trade this pair but for who wants to trade, I think there is a very good OPP. to go buy and sell one after another. be happy(wink)
07/29/25 Trade Journal, and ES_F Stock Market analysis EOD accountability report: +734
Sleep: 5 hours
Overall health: Been struggling with sleep due to heat waves
VX Algo System Signals from (9:30am to 2pm)
— 8:00 AM Market Structure flipped bearish✅
— 9:30 AM VXAlgo NQ X3 Buy Signal✅
— 9:36 AM Market Structure flipped bullish on VX Algo X3! ❌
— 11:49 AM VXAlgo ES X1 Buy signal✅
— 11:59 AM VXAlgo NQ X1 Buy Signal❌
What’s are some news or takeaway from today? and What major news or event impacted the market today?
Today was one of the few short the resistance day and refreshing to see after we been grinding ATH (all time highs)
News
— 1:30 PM
🇺🇸🇨🇳 *CHINA SAYS IT AGREES WITH US TO EXTEND TARIFF TRUCE
What are the critical support levels to watch?
--> Above 6395= Bullish, Under 6374= Bearish

GOLD XAUUSD Gold moving as expected respecting our price and entries, will look for swinging opportunities ,and SL adjustments to BE
Gold Buy SetupHi everyone
Hope you all had a good trading week so far, this is our buy setup we looking to see for Wednesday
Let us know in the comments what you think.
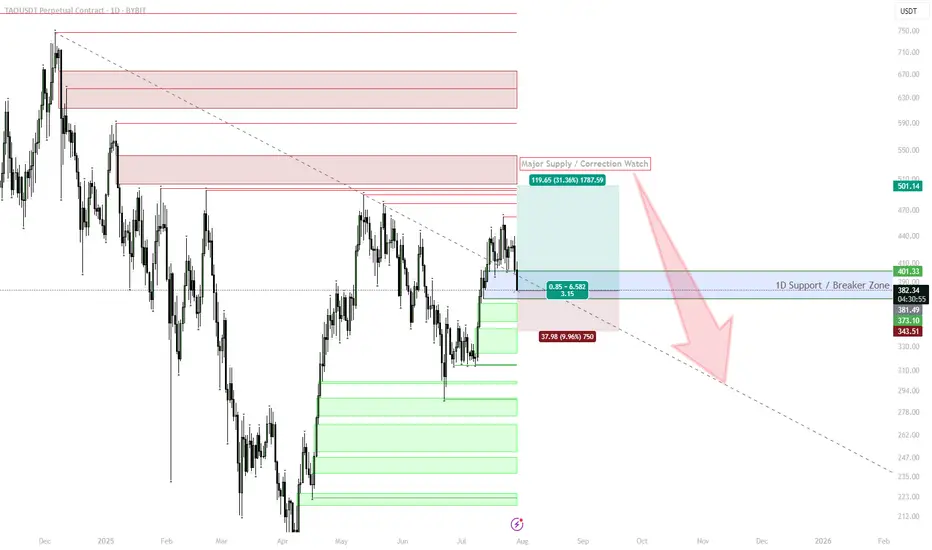
TAO | #1D — One More Leg Up Before Major CorrectionStep-by-Step Scenario:
Current Context:
Price is consolidating above the 373–382 support (blue box) after a strong impulse from June lows. This zone aligns with a major HTF demand and retest of the recent breakout.
Expected Move:
Base Case: Holding the 373–382 zone triggers a new leg higher toward the $500 supply area.
Upside Target: $500+ (main target), with interim resistance at $440–460.
Trigger: Look for strong 1D closes above 401 for confirmation, or a quick dip and reclaim of 382 for entries.
Timing:
Expect the final move up to play out into late August. Watch for momentum and trend exhaustion as we enter September.
Major Correction Risk:
If price stalls or forms an SFP at $500 or in upper supply, look to reduce exposure and prepare for a multi-week/month correction.
Breakdown below 373 (especially daily close) invalidates the bullish scenario and may accelerate a correction back to 320–260.
Why:
The market structure remains bullish above support.
Still running on strong narrative/momentum, but approaching key supply zones and cycle timing.
Macro risk: Many alts (including TAO) could top as Q3 ends, mirroring historical cycles.
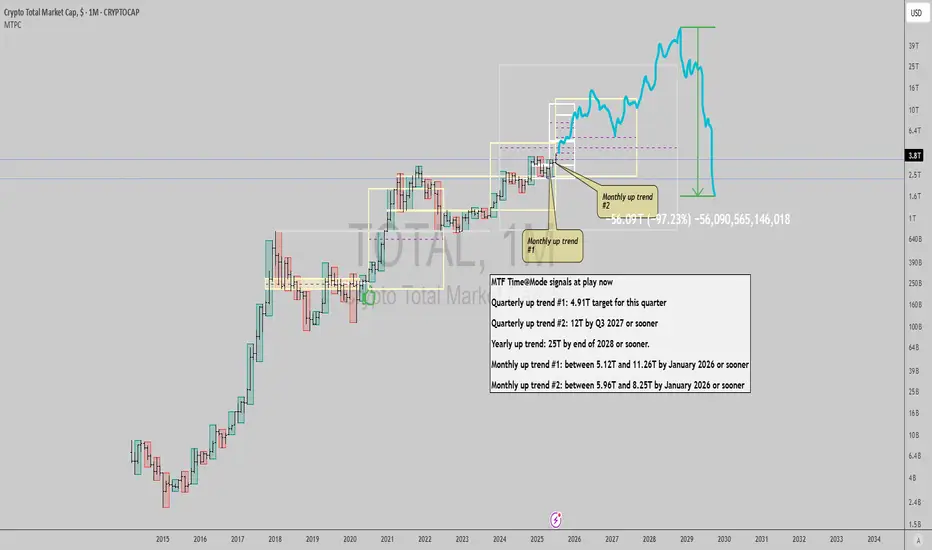
$TOTAL: Crypto market signals long term upside pendingGM gents, most people in crypto circles (Crypto Twitter sphere of influence and former Tradingview posters who evolved into influencers there) seem to have the consensus view that the market has little time to rise from here, and appear to signal a wall of worry sentiment.
This resonates with variables observed in Pendle Finance implied vs realized yields for many stablecoins (trading below current yield signals that people are pessimistic), for example.
The chart signals I show here clash with people's meme/beliefs about market cycles duration (most think there are fixed time cycles that accurately predict bullish and bearish trends in BTC and also the timing for altcoins to outperform Bitcoin, a ridiculous notion).
What actually happens is that there are cycles of boom and bust as a feature of the fiat currency paradigm and capitalism the way we know it, which in turn cause the bullish and bearish trends in Bitcoin and Altcoins. Market data supports the idea that trends have some correlation with periods of consolidation (what Time@Mode patterns show) and the importance of not forcing arbitrary parameters or beliefs into the market, as it is an affair destined for failure (a sin very common in different degrees of market specialization: going from people spotting some pattern in hindsight obvious enough for them to develop a belief and market adage, to the quant systems trader figuring out how to trade the past well in backtests by curve fitting their algorithm with a specific data sample, to then fail in real trading of the present and future).
In short: expect the unexpected regarding time cycles, fixed time cycles don't work, and better obtain data from new market information to adjust your views as time goes by, if you make a prediction, verify it with post-pattern behavior to determine if it's still valid else your results will suck.
As for the crypto market, it seems that there's more upside left, if current monthly signals are not erased from here onwards:
A drop under 3.12T would mean monthly trend is dead.
A drop under 2.82T would mean quarterly trend is dead.
A drop under 787B would mean yearly trend is dead and we're all gonna die.
Best of luck!
Cheers,
Ivan Labrie.
FARTCOIN | #3D — Swing Long from SupportFARTCOIN just tapped into a key 3D support zone after a sweep below prior range lows. The rejection from 1.65–1.45 weekly resistance has set up a fresh entry at demand, with risk well-defined.
Step-by-Step Price Scenario:
Support Confirmation: Price swept the range lows and rebounded from 1.12–1.22 demand. This area is now critical for bulls to hold.
Entry Logic: Accumulation within the blue box is favored for a swing long. Stop loss placed below $1.00 (invalidating the idea if broken).
First Objective: Look for price to reclaim 1.22, with a move toward the weekly S/R at 1.45 as first resistance.
Main Target: If momentum follows through, next key target is 1.65 (D3 SFP), with a possible extension to $2.74 (measured move).
Risk: Breakdown below $1.00 negates the idea and opens the door to much deeper downside (next demand block $0.60–0.80).
Why:
The setup offers a high R:R, with clear invalidation. Reclaiming 1.22 after a sweep typically triggers fast mean reversion, especially on volatile alts. Watch for signs of strength — strong candle closes above 1.22 or a quick retest.

XAUUSD ShortI am a beginner trader! This is just an analysis for educational purposes. I don't provide signals for trading.

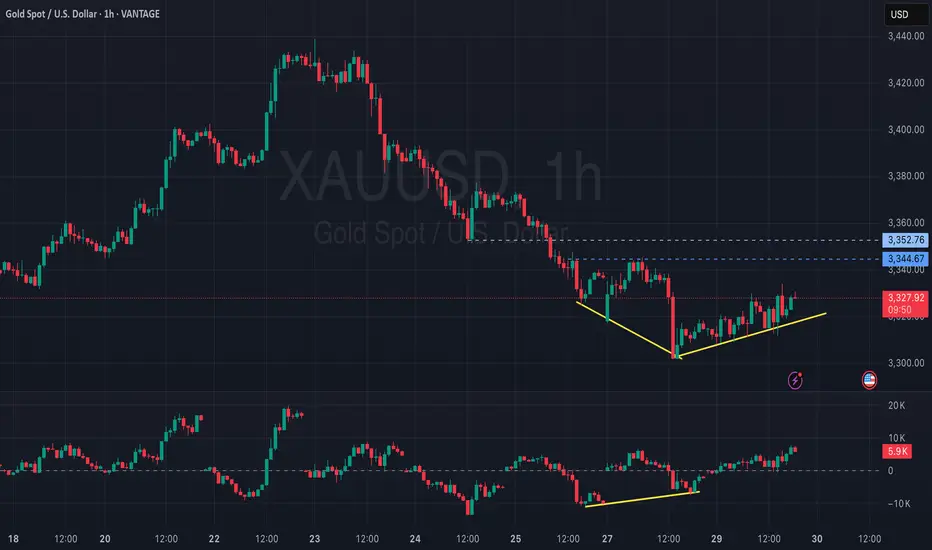
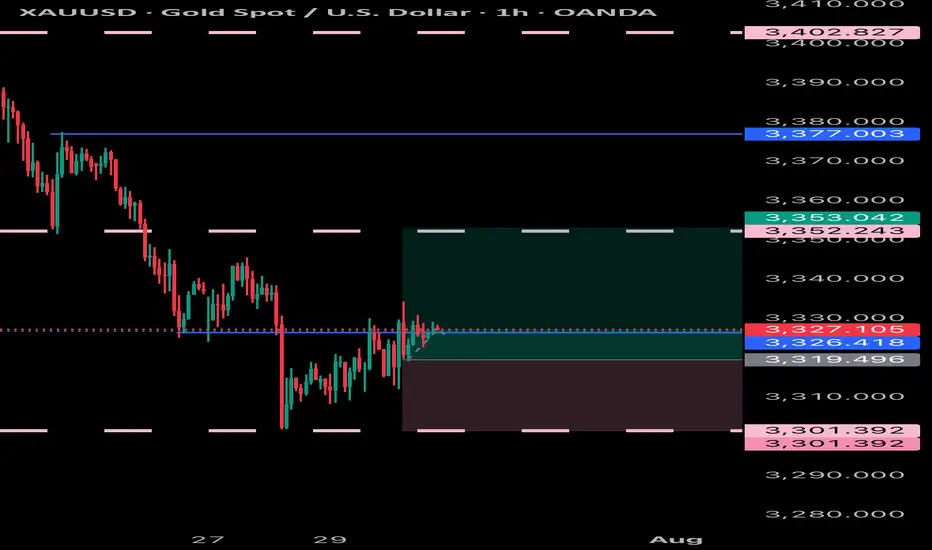
GOLD awaiting confirmation of a bullish zone formation.Gold has confirmed support at 3310, with the price rebounding and returning to the buying side. We are now awaiting confirmation of a bullish zone formation.
Gold remains under pressure ahead of key market-moving events, including the US GDP data release and the Federal Reserve’s interest rate decision. However, the pause in Dollar strength is offering some support to the gold price. As long as the price holds above this level, the bullish scenario remains valid. A sustained move above this zone may open the path toward the next resistances: 3360 / 3385 we can expect Growth more.
You May find more Details in the Chart.
Trade wisely best of Luck Buddies.
Ps: Support with like and comments for more insights Thanks for Supporting.

US30 - BUYStrong selling pressure today as price has grabbed a ton of buy side liquidity. As we approach FOMC news tomorrow, I am expecting buyers to take back control and price reach Sundays opening price.

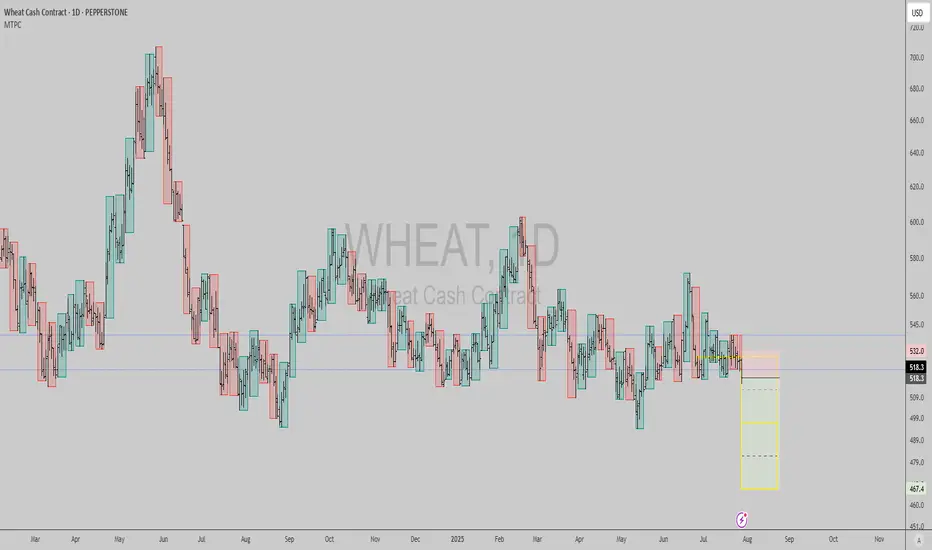
WHEAT: Short signal amidst Russia/Ukraine truce deadlineThe market seems to be pricing in a possible truce between Ukraine and Russia, since Trump gave Russia a 2 week deadline to achieve it or risk further sanctions. The technical chart has a picture perfect short signal in the daily timeframe with good reward to risk here.
Best of luck!
Cheers,
Ivan Labrie.
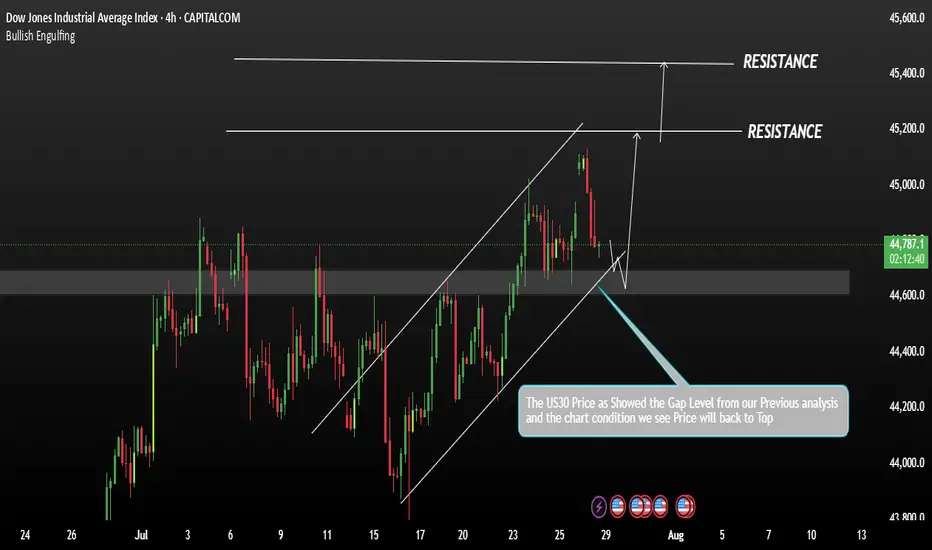
US30 Correction with in a Downtrend ChannelUS30 is currently in a consolidation phase within a broader bullish trend. From our previous analysis, the index has shown strong upward momentum. However, to confirm a potential bearish shift, the price would need to break back below key support levels, potentially leading to a deeper correction.
If the price stabilizes above 44,000 on the 4H timeframe, this would strengthen the bullish momentum. A sustained move above this level could open the path towards the next targets at 45,200 and 45,400.
You May find more details in the chart.
Ps: Support with like and comments for better analysis