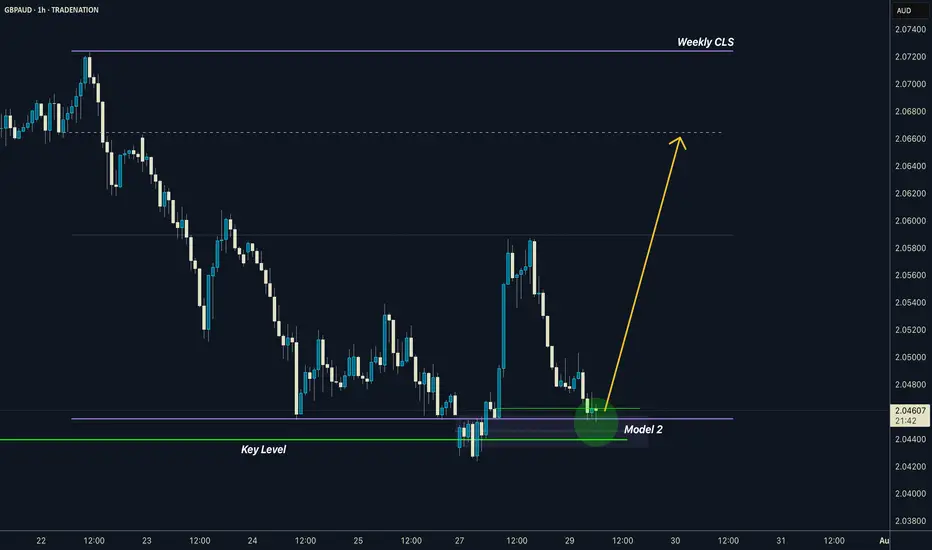
GBPAUD I Weekly CLS I Model 2 I Target 0B and full CLSYo Market Warriors ⚔️
Fresh outlook drop — if you’ve been riding with me, you already know:
🎯My system is 100% mechanical. No emotions. No trend lines. No subjective guessing. Just precision, structure, and sniper entries.
🧠 What’s CLS?
It’s the real smart money. The invisible hand behind $7T/day — banks, algos, central players.
📍Model 1:
HTF bias based on the daily and weekly candles closes,
Wait for CLS candle to be created and manipulated. Switch to correct LTF and spot CIOD. Enter and target 50% of the CLS candle.
Model 1 Done
Analysis done on the Tradenation Charts
Disclosure: I am part of Trade Nation's Influencer program and receive a monthly fee for using their TradingView charts in my analysis.
Trading is like a sport. If you consistently practice you can learn it.
“Adapt what is useful. Reject whats useless and add whats is specifically yours.”
David Perk aka Dave FX Hunter
💬 Don't hesitate to ask any questions or share your opinions
Beyond Technical Analysis
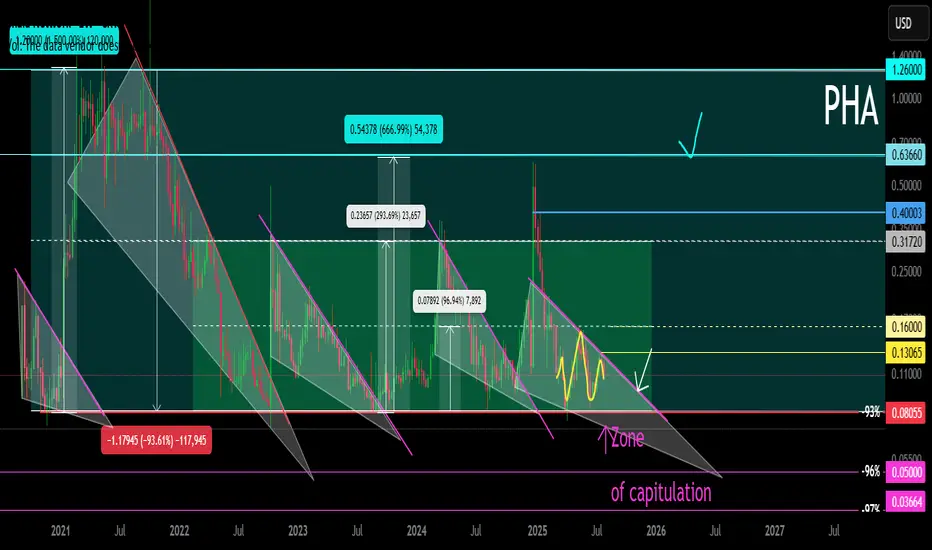
PHA Main trend since 2020. Hype Web3 AI 07 2025Cryptocurrency as an example. This applies to all similar assets by liquidity. Logarithm main trend. Time frame 1 week (smaller time frame, to understand the shown and described, is not necessary). Cryptocurrency is an imitation of utility with a good legend, which is traded on liquid exchanges (in the decline phase in the next cycle) most likely there will be delists, if they do not make a “restart” (rebranding). A big plus in the crypto legend of this project is that it is mentioned as the basis of the legend of Web3 and AI.
What is it. Phala Network is an execution layer for Web3 AI. By allowing AI to understand blockchains and interact with them, it removes the barrier for the first billion users joining Web3.
Phala Network's multi-security system is a solution to the problem of AI execution. Based on Phala Network, you can easily create hack-proof and unstoppable AI agents tightly integrated with on-chain smart contracts using AI-Agent Contract.
Agentize smart contracts: create AI agents for smart contracts using natural and programming languages.
End of participation phase. Created a project at the end of the participation phase in 2020 09 before entering the distribution zone of the last cycle with the highs of 2021.
Market distribution . Then, under the hype of alts, very aggressive convincing marketing and pumping over +1500%. Long distribution (more than 9 months) with price retention at a huge profit and publication of convincing fairy tales-news for “pouring” fresh fuel (mass pipel) through info wires in the market distribution zone of 2021.
Phase of decline to the recruitment zone. (partial change of hands, those who created, they do not need it). Phase of decline from the sales zone (advertisement is good), to the purchase zone (no advertising, no activity) -93%. That is, the “fresh fuel” money of investors turned into “dust” on the spot (conditionally $ 1000 of super promising next "shit", in $ 50-100), on futures still in the distribution zone “disappeared”.
Phase of accumulation (use of many short alt seasons to shake the price and “shake out”). Upon reaching the recruitment zone, — reverse. They made a reversal, pump-buyout of liquidity (their heavy orders) by a large % (+580%), which served as the starting points for the formation of the horizontal pump / dump channel range, that is, conditional accumulation.
Now another wedge is being formed locally in the horizontal channel — its breakthrough, the beginning of the pumping and another altseason, which can develop into the participation phase.
It is worth noting that they can enter the long stop loss and long liquidation zone when forming a wedge (this often happens). Take this into account in your money management in advance. Accept risks, or distribute entry money when implementing force majeure in advance, even if you do not lie that this is possible. The capitulation phase (part of accumulation, liquidity collection), that is, “dumping passengers” and the final liquidation of their faith, does not always happen, which is logical.
On weak assets (very old, low liquidity), outright scams that have "outlived their usefulness", the capitulation phase sometimes ends in a complete scam.
Alt-seasons of accumulation and capitulation zones . During this time, there were 3 average alt seasons, which naturally affected the price of this cryptocurrency (3 pumping waves in the channel +580%, +300%, +650% (average gain/drop conditionally in half), price movements in the median zone of a large trend channel.
Participation phase — most likely, there will be a series of pumps with sticks under the market trend as a whole, and most importantly, the hype of everything related to AI.
Distribution phase — most likely will be shorter in time than before, and still I would exit mostly under the mirror zone of the previous distribution, as the project is “old”, the hype "the chart remembers the deceived investors". Then two options, the development of the paths of which depends on the market as a whole, and not on this candy wrapper.
a) Consolidation and exit from it to the second zone of the final distribution ("the hamster is not scared", "it will grow forever").
b) Transition to the decline phase, then the fading of marketing, the final loss of liquidity (supporting the project with money), and a gradual (delists, regulation, norms) or sharp scam (hacking, etc.).
It does not matter which path we take in the distribution phase, the final path, like everything similar created under the hype, is the loss of liquidity, oblivion and scam. Therefore, do not forget to sell such (99.999% of the crypto market) at high prices, despite the positive news deception creeping into the mind through the ears and eyes.
Rebranding. Restart. Resetting price charts. If they do it like EOS and similar "old" scams — rebranding (preparing for a new market hype in advance), and remove all charts from exchanges, so that for the new market hype as a whole, the project would be “fresh” according to the chart, new, that is, the previous scam of "few experienced investors" would not be visible, then pumping up more than +1000% is possible, but this is irrational... As you need to spend a lot of money, it is easier to create a new imitation of something useful...
The market phases are clearly visible on the chart. I also described everything in detail.
VST | Long | Trend Continuation with Correction Setup (Aug 2025)VST | Long | Trend Continuation with Correction Setup (Aug 2025)
1️⃣ Quick Insight: Vistra Corp. has been in a strong uptrend, making new highs. We are now looking for a healthy correction to position for continuation, as "the trend is your friend."
2️⃣ Trade Parameters:
Bias: Long
Entry: $151 (waiting for a corrective pullback)
Stop Loss: $128
Take Profits:
TP1: $167
TP2: $197
TP3: $205
Extended Target: $206+ if momentum sustains through the trend channel
3️⃣ Key Notes:
Vistra is a leading U.S. integrated electricity and power generation company with ~41,000 MW of generation capacity. The stock has surged over 175% in the past year, currently near its 52‑week high of $207. Analysts’ 12‑month consensus price target is $185, though recent developments like the PJM capacity auction results and Perry nuclear plant extension could fuel more upside.
The company is heavily investing in renewables and storage ($700M+ in 2025), growing nuclear capacity, and expanding credit facilities. Despite its high P/E (~30× vs sector avg. 12–13×), its strong ROE (>80%), buybacks, and utility-scale investments support long-term upside.
4️⃣ What to Watch:
Q2 2025 earnings on Aug 7, 2025 for forward guidance
Progress in solar, battery storage, and nuclear expansions
Market reaction to any correction or consolidation near highs
Macro utility sector sentiment and commodity price trends
📊 Outlook: The near-term consensus suggests a pullback toward $185 is possible, but the longer-term uptrend remains intact, especially if growth momentum continues.
Please LIKE 👍, FOLLOW ✅, SHARE 🙌 and COMMENT ✍ if you enjoy this idea! Also share your ideas and charts in the comments section below! This is best way to keep it relevant, support us, keep the content here free and allow the idea to reach as many people as possible.
Disclaimer: This is not financial advice. Always do your own research.

SLA Moderate Bullish Setup – Weekly Play for 08/01 Expiry
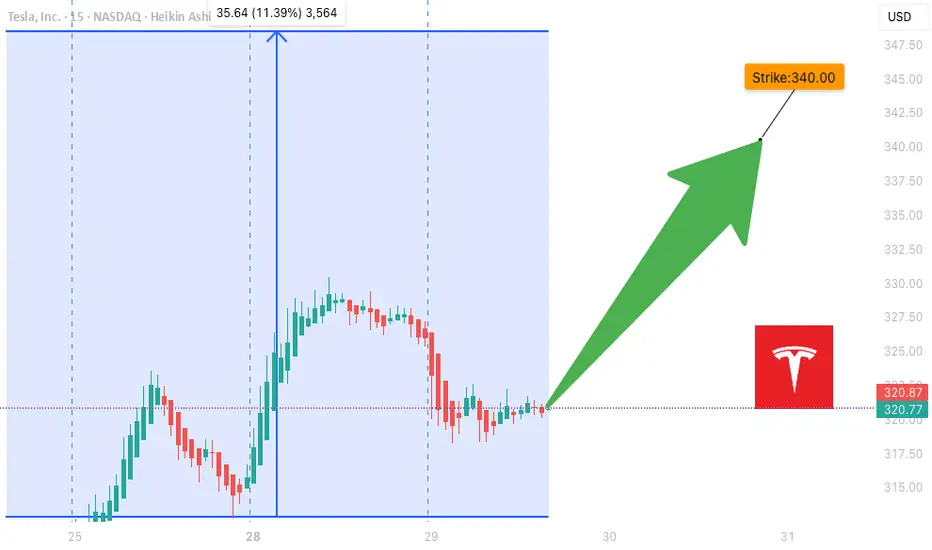
## ⚡ TSLA Moderate Bullish Setup – Weekly Play for 08/01 Expiry
🎯 *"Volume confirms it. RSI supports it. Time to strike—or stand by."*
---
### 🔍 Market Intelligence Snapshot:
📊 **Consensus**: Moderately Bullish
📈 **Weekly RSI**: Rising
📉 **Daily RSI**: Still Neutral (momentum building)
📉 **VIX**: Low → Great environment for call buying
📦 **Volume**: Strong institutional activity across models
---
### ✅ Recommended Trade Setup:
**TSLA \$340 CALL (Exp: Aug 1)**
💰 *Entry*: \~\$0.88
📈 *Target*: \$1.38
🛑 *Stop*: \$0.35
📆 *DTE*: 3 Days
🎯 *Entry*: Market Open
⚖️ *Confidence*: 65%
---
### 🔧 Model Blended Strategy Notes:
* Meta & Anthropic: Suggest ATM/ITM (\$327.50–\$330) → safer, higher cost
* Google & xAI: Prefer \$340–\$342.50 for a better risk/reward
* DeepSeek: Targets \$320 but with heavier premium
🧠 *Takeaway*: \$340 offers a balanced shot — affordable, but still responsive to upside flow.
---
### ⚠️ Risk Notes:
* ⏳ Time Decay → Quick exits = better outcomes
* 📰 External news or earnings reactions = watch for sudden volatility
* 🎯 Position size = keep light due to only 3 DTE
---
### 📊 TRADE SNAPSHOT (JSON):
```json
{
"instrument": "TSLA",
"direction": "call",
"strike": 340.0,
"expiry": "2025-08-01",
"confidence": 0.65,
"profit_target": 1.38,
"stop_loss": 0.35,
"size": 1,
"entry_price": 0.88,
"entry_timing": "open",
"signal_publish_time": "2025-07-29 10:16:14 UTC-04:00"
}
```
---
### 🧠 Quick Captions for Social:
* “TSLA bulls waking up? \$340C looks lit for the week 📈🔥”
* “Call volume surging. RSI rising. Low VIX. This \ NASDAQ:TSLA 340C might run 💥”
* “Risk-managed breakout shot — in and out fast 🎯”
NVDA Bullish Weekly Trade Setup** – 2025-07-29
📈 **NVDA Bullish Weekly Trade Setup** – 2025-07-29
🚀 *"Momentum meets money flow!"*
### 🔍 Market Snapshot:
* 💥 **Call/Put Ratio**: 2.47 → Bullish sentiment confirmed
* 🧠 **RSI**: Rising on Daily & Weekly → Momentum building
* 🔕 **Low VIX**: Favors call strategies (cheap premiums)
* ⚠️ **Caution**: Light volume = soft institutional backing
---
### 🔧 Recommended Options Trade:
**🟢 NVDA \$182.50 CALL (Exp: Aug 1)**
💰 *Entry*: \~\$0.53 (Mid)
📈 *Profit Target*: \$0.69 – \$1.06
🛑 *Stop Loss*: \$0.32
📆 *DTE*: 3 days
🔄 *Entry Timing*: Market Open
✅ *Confidence*: 75%
🔥 *Theta & Gamma Risk*: Elevated — manage position size!
---
### 💡 Why This Trade?
✅ RSI Strength across timeframes
✅ Flow favors upside
✅ Cheap premium in a low-volatility regime
🟡 Just watch that volume…
---
📊 **TRADE SNAPSHOT (JSON):**
```json
{
"instrument": "NVDA",
"direction": "call",
"strike": 182.50,
"expiry": "2025-08-01",
"confidence": 0.75,
"profit_target": 1.06,
"stop_loss": 0.32,
"size": 10,
"entry_price": 0.53,
"entry_timing": "open",
"signal_publish_time": "2025-07-29 11:59:10 UTC-04:00"
}
```
---
📣 **Taglines for Sharing:**
* "NVDA setup is 🔥—momentum + flow = GO!"
* "Gamma risk is real—but so is this profit window 💸"
* "Short-term sprint or fade? This call has range."

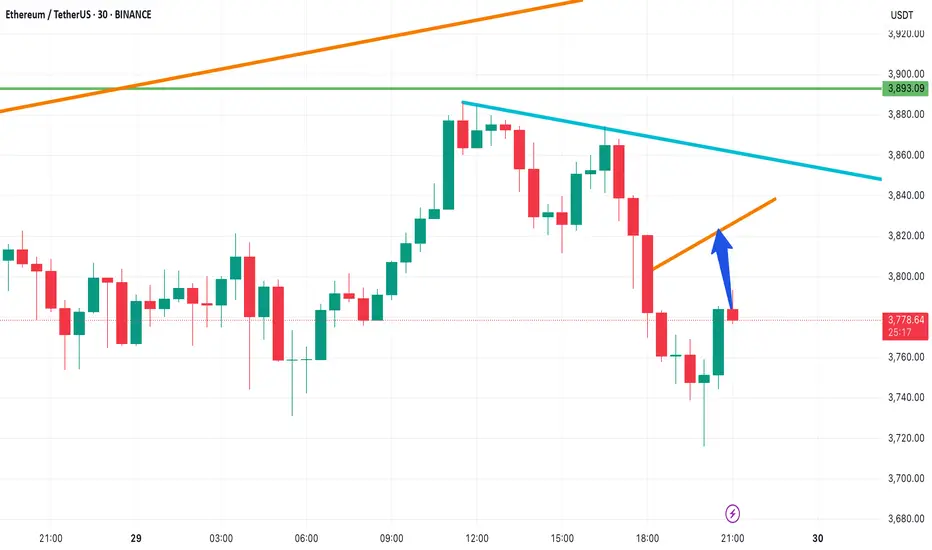
ETH Update – Eyes on the $3,820 Zone📈 ETH Update – Eyes on the $3,820 Zone
Ethereum is showing bullish momentum, and there’s a strong chance it could rally toward the orange resistance line around $3,820.
If price breaks above this level, the next target will be the blue trendline, marking the next key resistance.
🚀 Stay ready — momentum is building.
🔔 Follow for more clean setups and real-time analysis!
$WEEDIf I am to plant seeds, it would be WEED! WEED! WEED! And some more WEED! I’d sell the house, to lay some plots, to buy some seeds to plant some WEED!
$0.25 at best but anywhere at these lows seems safe.

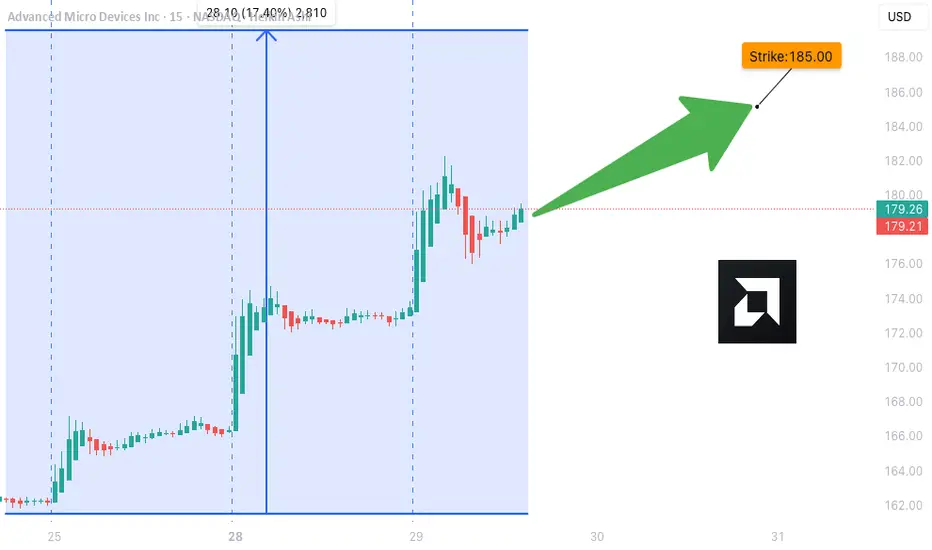
AMD Weekly Trade Alert (2025-07-29)
**🔥 AMD Weekly Trade Alert (2025-07-29) 🔥**
💹 *Momentum Confirmed. Calls Loaded. Let’s Ride.*
📈 **Key Bullish Signals**
✔️ Daily RSI: **83.2** (Rising)
✔️ Weekly RSI: **79.9** (Rising)
✔️ Call/Put Ratio: **2.03** 🧨
✔️ Volatility: Low (VIX = 15.2)
⚠️ Volume Weak (0.9x) – But not a dealbreaker.
---
**🎯 TRADE SETUP**
🔹 **Ticker**: \ NASDAQ:AMD
🔹 **Strategy**: Weekly Naked Call
🔹 **Strike**: \$185C
🔹 **Entry**: \$0.66
🔹 **Profit Target**: \$1.32 (100%)
🔹 **Stop Loss**: \$0.33
🔹 **Expiry**: 2025-08-01
🔹 **Size**: 3 Contracts
🔹 **Confidence**: 75%
---
**🧠 WHY THIS WORKS**
🔋 Momentum → STRONG
💰 Institutions are loading up calls
🧘 VIX = calm
⚡ Short gamma risk = fast payoff or cut
---
📢 **Watchlist it. Trade it. Exit fast.**
💬 Comment “🔥AMD” if you’re in.
🔁 Repost if you see \$190 coming.
\#AMD #OptionsTrading #CallOptions #TradingView #WeeklySetup #MomentumPlay #BullishSignal #MarketMomentum
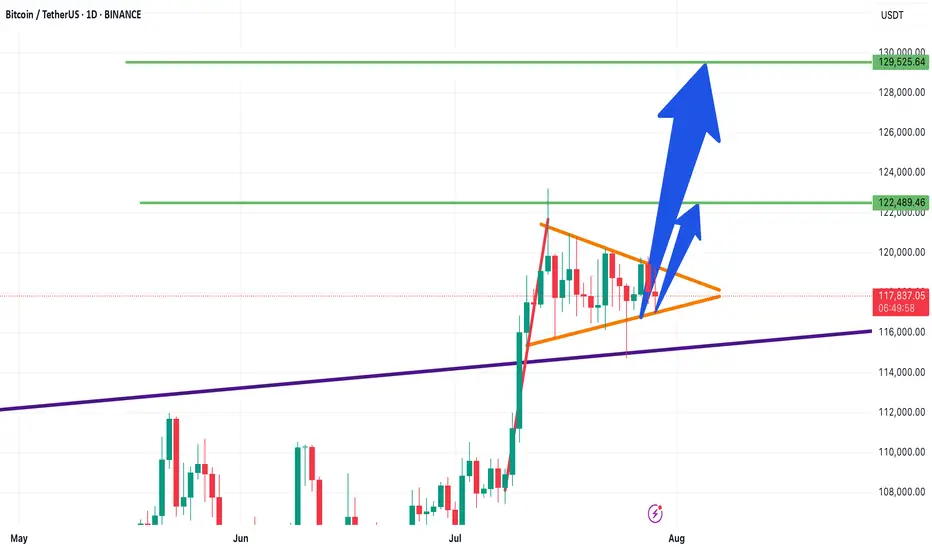
Bitcoin Technical Analysis – Bullish Flag- Symmetrical Triangle📊 Bitcoin Technical Analysis – Bullish Flag or Symmetrical Triangle?
📅 Analysis Date: July 29, 2025
As shown in the chart, Bitcoin appears to be forming a bullish flag or symmetrical triangle pattern—often seen after strong upward moves.
🔹 Bullish Scenario:
If the price breaks above the triangle, the first target is around $122,480, followed by a potential second target near $129,500, based on the length of the flagpole.
🔹 Bearish Scenario:
If the triangle breaks to the downside, the first support to watch is $115,230.
🧭 These key levels act as critical zones of supply and demand, so be sure to keep them on your chart!
🔥 Follow me for real-time setups, clear signals, and expert technical analysis!
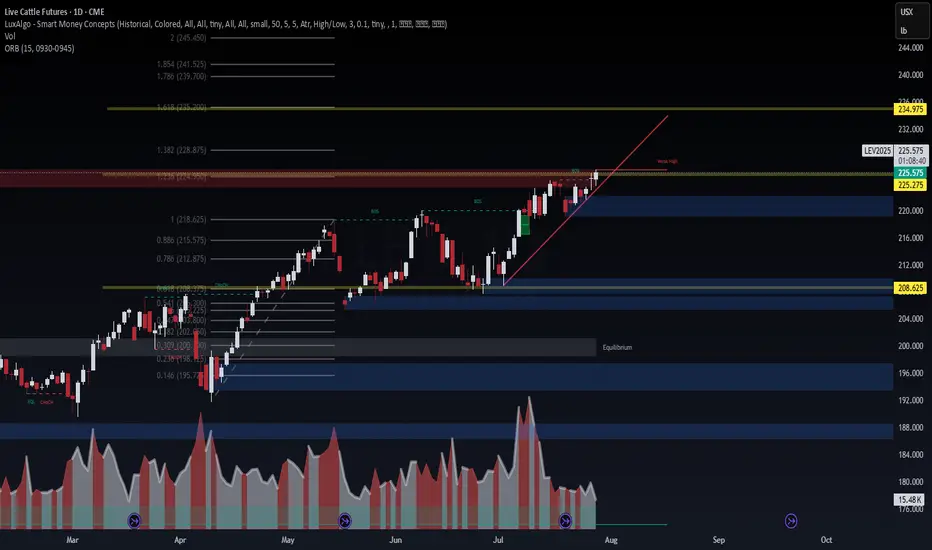
Live Cattle Futures (LEV2025) – Approaching Breakout Zone🐄 Live Cattle Futures (LEV2025) – Approaching Breakout Zone
WaverVanir DSS models show LEV2025 pushing into a key resistance band near 225.65–228.87 — the "weak high" zone where institutional sellers previously stepped in. Price remains in a clear bullish structure with clean BOS and rising demand.
🔍 Chart Structure Highlights:
📈 Trendline support holding since early June
🟨 Price sitting just below 1.382 Fib (228.87) – strong resistance
🟩 If broken, next fib extensions align at:
TP1: 234.97
TP2: 239.70
TP3: 245.45
🟦 Key downside structure support = 208.62 (CHoCH zone)
🧠 Options Flow (Aug–Dec 2025)
🟢 Call Buying: 224C, 225C, 226C, 242C – strong bullish pressure
🔴 Put Selling: 224P, 222P, 210P – income strategies defending downside
💡 Flow favors continuation higher, but many traders capping profits → suggests grind higher, not a parabolic run yet
📈 Strategy Insight
VolanX DSS bias: Bullish with caution
Break above 228.87 confirms squeeze toward 234–240 range
Failure to break = short-term fade back to 218–212 support band
🎯 Watch Levels
Breakout Confirm: Close above 229.00
Invalidation: Daily close below 218.62
Next Target Zone: 234.97 – 239.70 (1.618–1.786 extension)
#LEV2025 #LiveCattle #SMC #VolanXProtocol #CommodityFutures #OptionsFlow #FibStrategy #WaverVanir #DSS #Agriculture #MacroTrading #CMEFutures
Perfect Wicoff pattern..XRP is showing this structure with clear volume confirmation, strong support/resistance reactions, and a spring phase — it would be considered a “perfect” Wyckoff accumulation pattern.

Why Are Markets Rising Despite the Tariffs?Because of the
1) Set timeline on finalizing the tariff rates and
2) The ongoing negotiations,
They aimed at striking a balanced deal between the U.S. and its trading partners.
The Liberation Day tariffs were announced on 2nd April, and markets initially crashed in response. However, just seven days later, on 9th April, the U.S. postponed the higher tariff increases for most countries by 90 days. Since then, markets have rebounded and even broken above their all-time highs set in December last year.
Now that the dust is settling with the expiration of timeline and ongoing negotiations, the big question is:
Where will the markets head next?
Mirco Nasdaq Futures and Options
Ticker: MNQ
Minimum fluctuation:
0.25 index points = $0.50
Disclaimer:
• What presented here is not a recommendation, please consult your licensed broker.
• Our mission is to create lateral thinking skills for every investor and trader, knowing when to take a calculated risk with market uncertainty and a bolder risk when opportunity arises.
CME Real-time Market Data help identify trading set-ups in real-time and express my market views. If you have futures in your trading portfolio, you can check out on CME Group data plans available that suit your trading needs tradingview.sweetlogin.com

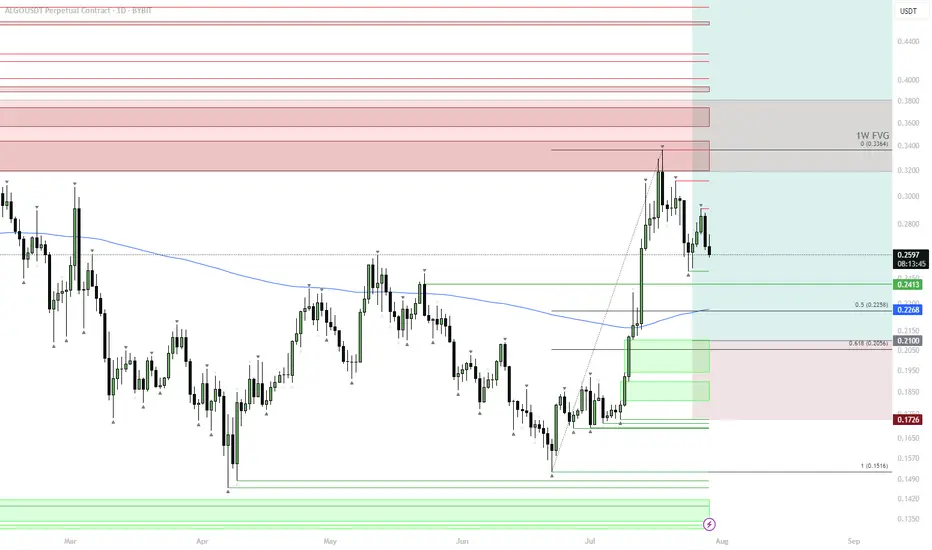
ALGO | #1D — Building the Spot Position LowerALGO has completed its first local move and is now retracing toward key support levels. The price remains under the 200DMA and is heading into the first cluster of demand zones.
Step-by-Step Price Scenario:
Initial Support: Watch the 0.2413–0.2268 zone — this is the first area to scale in spot buys.
Main Accumulation: If price drops deeper, the main spot buy window is $0.22–0.20 (0.5–0.618 retracement of the recent rally and the main demand block).
Invalidation: Breakdown below $0.1726 would invalidate the spot strategy and suggest deeper downside.
Bullish Confirmation: A strong reaction from either of these support levels, followed by reclaiming the 200DMA, would set up the next move toward $0.33–$0.35.
Why this plan:
Buying spot on pullbacks into HTF demand with clear invalidation below keeps risk defined, and the current market structure allows for compounding if the trend resumes.
DE40 Breakout Robbery – Bullish Setup Revealed!💣 DE40 / GER40 INDEX BREAKOUT RAID 🚨
🌟 Hi! Hola! Ola! Bonjour! Hallo! Marhaba! 🌟
Dear Market Robbers, Money Makers, and Chart Bandits 🕶️💰💣,
We’re rollin' out our latest Thief Trader Heist Plan based on laser-sharp technical + fundamental recon 🧠💼 on the Germany DE40 / GER40 Index. It’s time to gear up and break the resistance vault 🏦💥
🎯 THE MASTER HEIST SETUP: LONG ONLY 🎯
📈 Entry Setup:
"The heist is on! Wait for breakout & retest near 24600 🔓.
Once confirmed, GO BULLISH and snatch that market loot!"
✅ Use Buy Stop above resistance
✅ (OR) Buy Limit from pullback zones using 15m–30m swing lows/highs
🎯 DCA / Layered limit entries for optimal robbery!
🔔 Set Alerts: Don't sleep on this! Mark your alarms to catch the breakout.
🛑 STOP LOSS: PLAY IT SMART, NOT EMOTIONAL
🗣️ "Don’t drop your SL before the breakout—wait for the confirmation candle. Place it smart based on your entry lot size & risk."
📍Thief SL Plan: Below the recent 4H wick swing low – around 21700
🔒 Protect the loot once you're in the trade!
🏁 TARGET: TIME TO ESCAPE THE SCENE
🎯 Primary Profit Vault: 25500
🛫 Escape earlier if signs of resistance emerge. A clean get-away is the goal!
🔪 SCALPERS MODE: ONLY LONG SIDE
💰 Got the funds? Feel free to enter early.
💼 Otherwise, team up with swing traders. Use Trailing SL to guard your treasure.
🔎 FUNDAMENTALS BACKING THIS HEIST
📊 GER40 shows bullish momentum backed by:
Global macro optimism
Strong Eurozone data
Risk-on flows into European indices
Technical chart breakout formations
📰 Get full market breakdowns (COT, Macro, Intermarket, Sentiment, etc.) – Check your trusted sources and confirm your targets.
🚨 TRADING ALERT: STAY ALERT DURING NEWS
⚠️ Big news = high volatility! Follow the robbery code:
Avoid new trades during major news drops
Trail SLs on running positions
Stay glued to live updates!
❤️ SUPPORT THE THIEF CREW
If this plan helped you, hit that BOOST 🚀
Let’s keep raiding the charts, stacking profits like pros 🏆
Join the Thief Crew, where we rob the market... not dreams.
🎭 Until the next plan… stay sneaky, stay profitable. 🐱👤💸💥

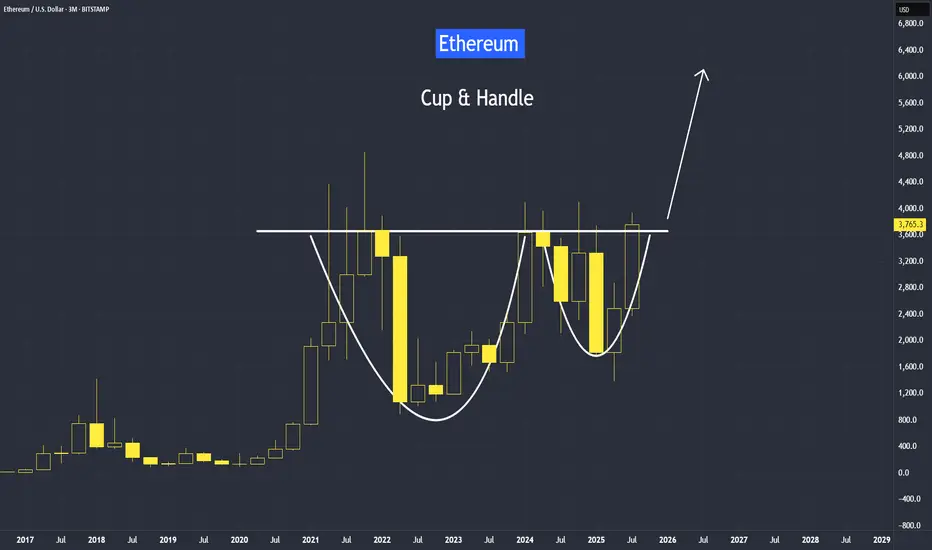
Cup and Handle Setup in Ethereum Since April trough, Ethereum has risen by 179%, delivering a higher rate of return than Bitcoin at 66%.
But most of our attention is on Bitcoin, breaking above the 120,000 level.
Why is Ethereum quietly gaining ground —and what does the future hold for Ethereum?
It's video version on its trading strategies:
Mirco Bitcoin Futures and Options
Ticker: MET
Minimum fluctuation:
$0.50 per ether = $0.05 per contract
Disclaimer:
• What presented here is not a recommendation, please consult your licensed broker.
• Our mission is to create lateral thinking skills for every investor and trader, knowing when to take a calculated risk with market uncertainty and a bolder risk when opportunity arises.
CME Real-time Market Data help identify trading set-ups in real-time and express my market views. If you have futures in your trading portfolio, you can check out on CME Group data plans available that suit your trading needs tradingview.sweetlogin.com
EURNZD Update: This short trigger could spark a waterfall dropYo traders, Skeptic from Skeptic Lab! 🩵 EURNZD just broke its daily upward trendline, setting up a sharp drop. Weekly shows a fading uptrend. Daily’s got a strong bearish candle, full body, no buyer fight. 4H trendline broke and... more on this video:)
👀Beware of fakeouts this week—volatility’s high! Trade smart, keep risk tight, and don’t FOMO. Share your thoughts in the comments, boost if it helps <3

USDT.D | Macro Breakdown on the Horizon?From a monthly perspective, CRYPTOCAP:USDT.D is showing a textbook bearish descending triangle at the top — right after a decade-long uptrend. Price has repeatedly failed to break above resistance, forming a series of lower highs and consistent support.
Scenario:
If the support gives way and this pattern confirms, we could see a multi-year unwind, with the next major target down at 1.9–2.0%.
The first zone to watch for a reaction is around 3.7–3.8%, but the main macro demand sits much lower.
Why this matters:
A breakdown in USDT dominance typically coincides with a massive rotation into risk-on assets and altcoins — the end of a cycle in stablecoins often sparks the next big phase of the crypto bull market.
Plan:
Watch for confirmation of the breakdown on a monthly close below 3.7%.
Until then, this is just a setup — not a trigger.

VIX Alarting !when VIX Reach Red Zone.
It consider as Extreeemeee Greeeed !!.
100% market will take U-Turn direction which will be Red in Up coming days !
although im day trading im good and never keep money in market after close.

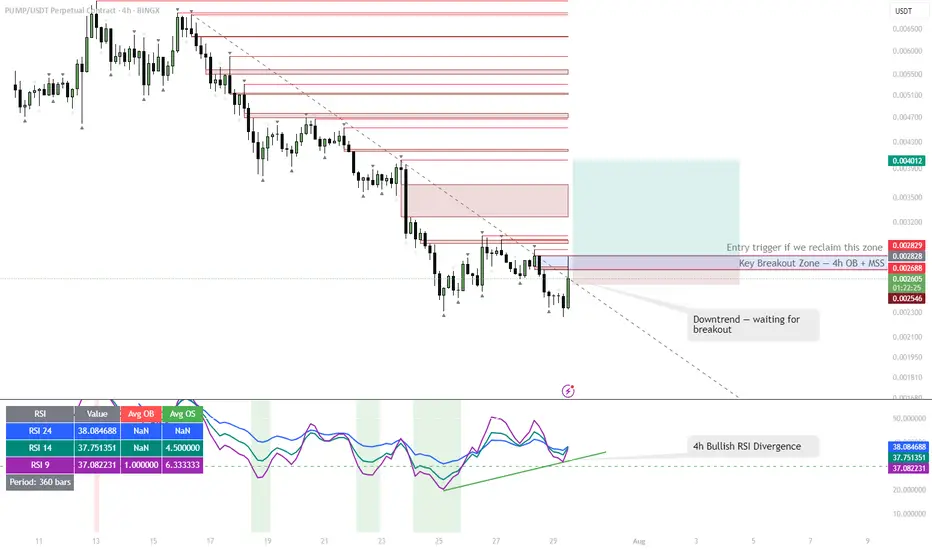
PUMP | #4h #long — Watching for Breakout Confirmation Early signals for a reversal, but not rushing in.
Some clear bullish divergence on the 4h RSI — first positive sign after an extended downtrend. Price can pop from here, but my plan is to wait for a break and hold above the 4h Order Block + MSS zone (red box) before taking any long entry.
Confirmation is key — I only want to get involved if we reclaim this area with momentum.
Scenario:
If we get a strong breakout and close above the red OB + MSS zone, that’s the first entry trigger for a potential trend reversal.
Until then — standing aside, letting the setup prove itself.
Reasoning:
Bullish RSI divergence often marks the beginning of a reversal, but without a structural breakout, the move can easily fail.
Patience pays off in these high-risk, low-liquidity coins.
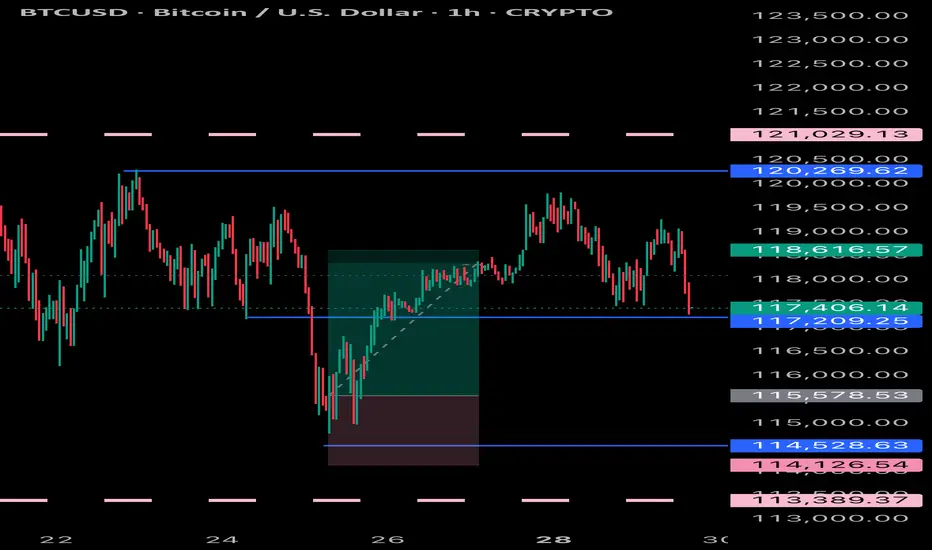
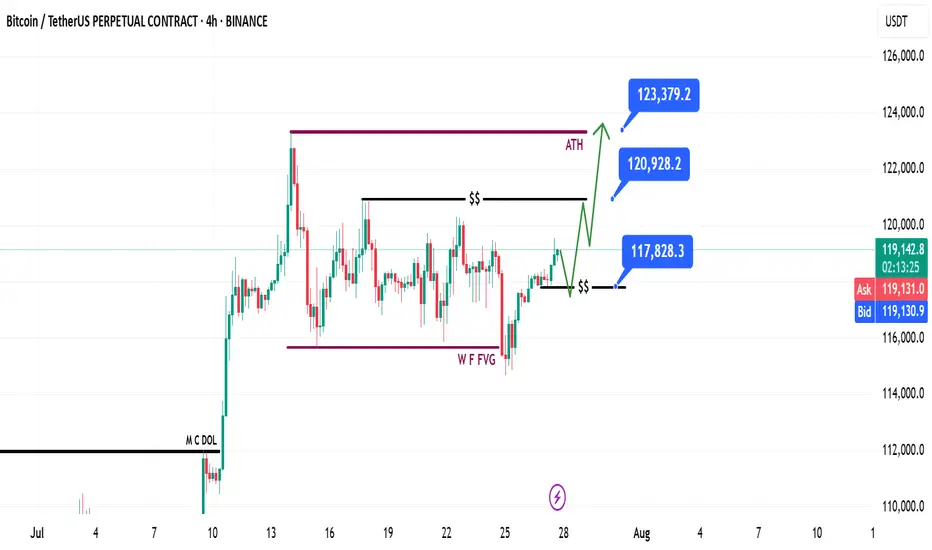
Bitcoin Weekly Recap & Gameplan | 27.07.2025📈 Market Context:
Bitcoin maintained its bullish momentum, driven by continued institutional demand and a supportive U.S. policy backdrop.
Last week’s gameplan played out well — solid profits were captured (see linked chart below).
🧾 Weekly Recap:
• Price made a bullish retracement into the Weekly FVG (purple line) exactly as projected in last week's post.
• From here, I expect continuation toward new all-time highs.
📌 Technical Outlook:
→ First, I expect a short retracement and a 4H swing liquidity grab at 117,828$.
→ Then, a strong continuation move toward ATH targets.
🎯 Setup Trigger:
Watch for:
✅ 4H liquidity sweep
✅ 15M–30M bullish break of structure (BOS)
This is the confirmation zone for potential long setups.
📋 Trade Management:
• Stoploss: Below confirmation swing low
• Targets:
– 120,938$
– 123,400$
💬 Like, follow, and drop a comment if this outlook helped — and stay tuned for more setups each week!
Bitcoin Decision Time Closing - Pump to $150K, or $100K Retest?Here we see a clear trendline that bitcoin must hold. A breakdown could lead to a retest of the 100-110K levels. If we can hold this trendline until August 15th, the odds of a bullish continuation will increase.
