Check if the second step-up trend can be maintained
Hello, traders.
If you "Follow" us, you'll always get the latest information quickly.
Have a great day.
-------------------------------------
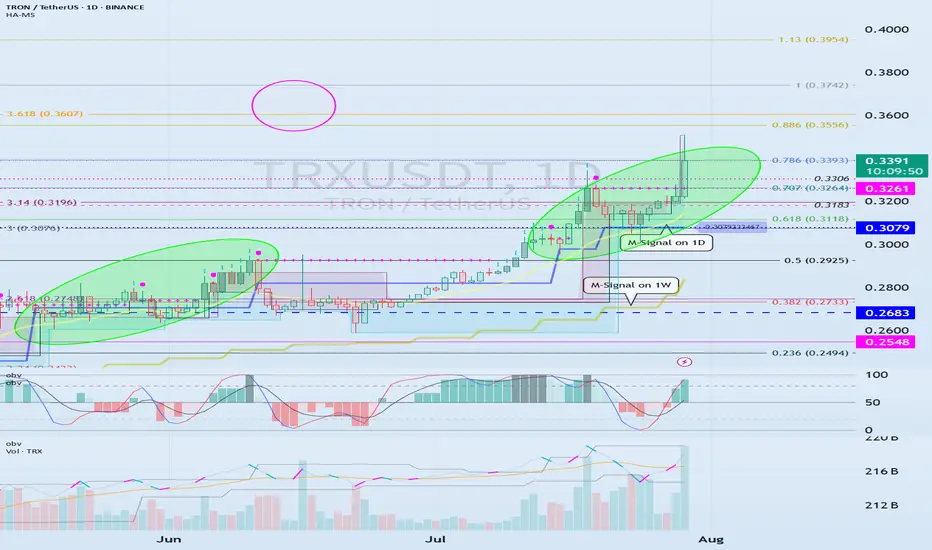
(TRXUSDT 1M Chart)
We need to see if the price can sustain itself by rising above the left Fibonacci level 3.618 (0.3607) and the right Fibonacci level 1 (0.3742).
When the next monthly candlestick is formed, we need to check the movements of the supporting indicators.
-
(1W Chart)
The DOM (60) indicator on the 1W chart is showing signs of forming a new trend.
Accordingly, we need to examine whether a rise above the left Fibonacci level of 3.618 (0.3607) will trigger a new wave.
The left Fibonacci level was created during the first rising wave.
Therefore, if the price rises above the left Fibonacci level of 3.618 (0.3607), a new wave is expected to form.
Since the HA-High indicator on the 1W chart is formed at 0.2683, if the price declines, support near 0.2683 will be crucial.
-
(1D chart)
If the price maintains above the 0.3079-0.3261 range, further upside is expected.
For the price to rise above the left Fibonacci ratio of 3.618 (0.3607) and the right Fibonacci ratio of 1 (0.3742), the OBV indicator of the Low Line ~ High Line channel must rise above the High Line and remain above it.
However, since the StochRSI indicator has entered an overbought zone, the upward movement may be limited.
Therefore, we need to consider how to reset the indicator.
-
The price is continuing a stepwise upward trend, rising above the HA-HIgh indicator.
It is currently in its second stepwise upward movement.
Therefore, the key is whether the price can sustain above the HA-High indicator.
Whether a third stepwise upward movement occurs will depend on whether the price can sustain itself around or above the 0.3079-0.3261 level.
-
Thank you for reading to the end.
I wish you successful trading.
--------------------------------------------------
- Here's an explanation of the big picture.
(3-year bull market, 1-year bear market pattern)
I'll explain more in detail when the bear market begins.
------------------------------------------------------
Beyond Technical Analysis
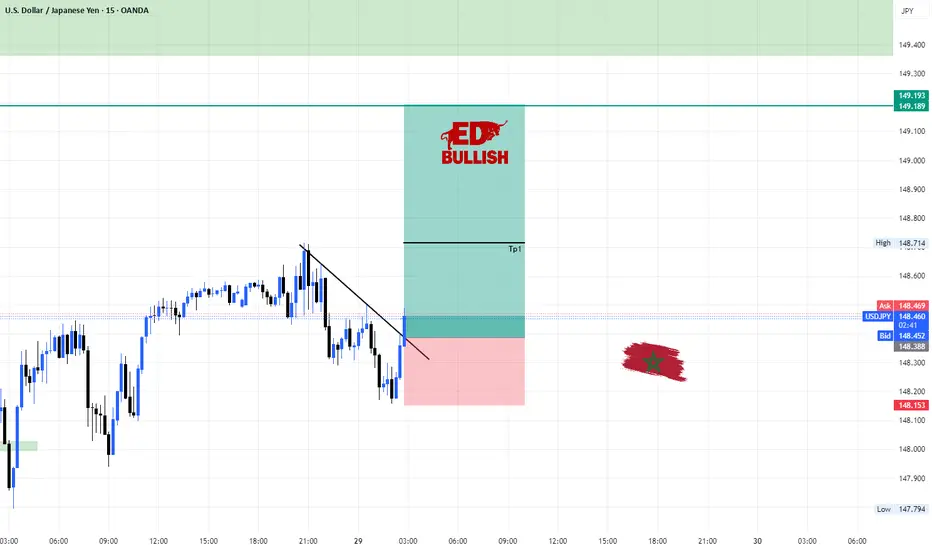
USDJPY long position 29/07/2025English : According to our analysis, we anticipate a bearish scenario.
Morocan Darija : kanchofo d'apres l'analyse dyalna antsanaw hboot
ATENTION : I only share my ideas, not signals
if TP1 hit i will move SL to BE
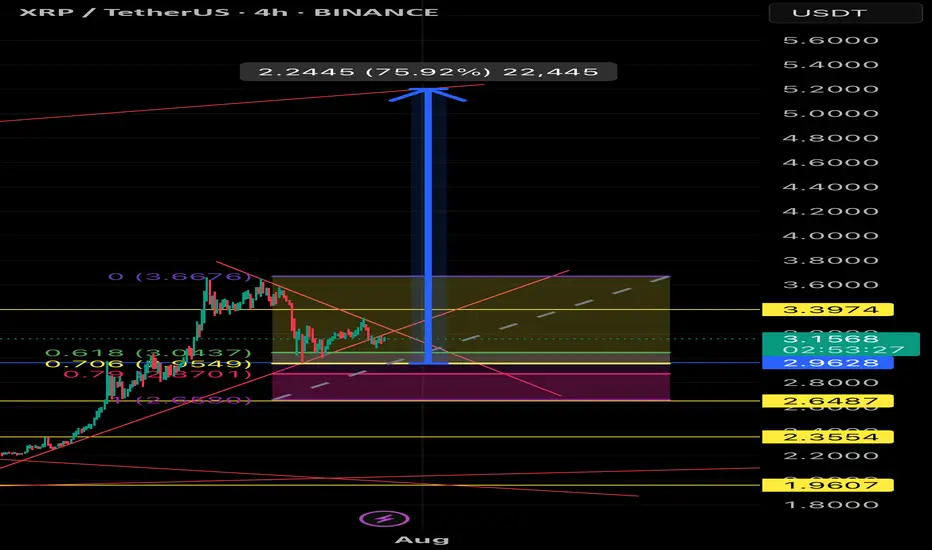
XRPUSDT Bullish Breakout Setup – 4H Chart, Fibonacci golden areaEntry: 3.16 (current level)
🛡️ Stop Loss: 2.9 (below range support)
🎯 Targets:
• TP1: 3.39 (local resistance)
• TP2: 4.50
• TP3: 5.40
• TP4: 5.90 (final target from wedge breakout – +75%)
🔍 Setup Details:
XRP is forming a bullish pennant after a strong rally. Price has held key Fibonacci retracement levels and is currently consolidating inside a wedge. A confirmed breakout could lead to a 75% move toward the $5.9 target. Volume confirmation and breakout candle close above $3.39 can accelerate the move.
⚠️ High volatility expected. Use proper risk management.
#XRPUSDT #CryptoAnalysis #Altcoins #TechnicalAnalysis #BreakoutAlert
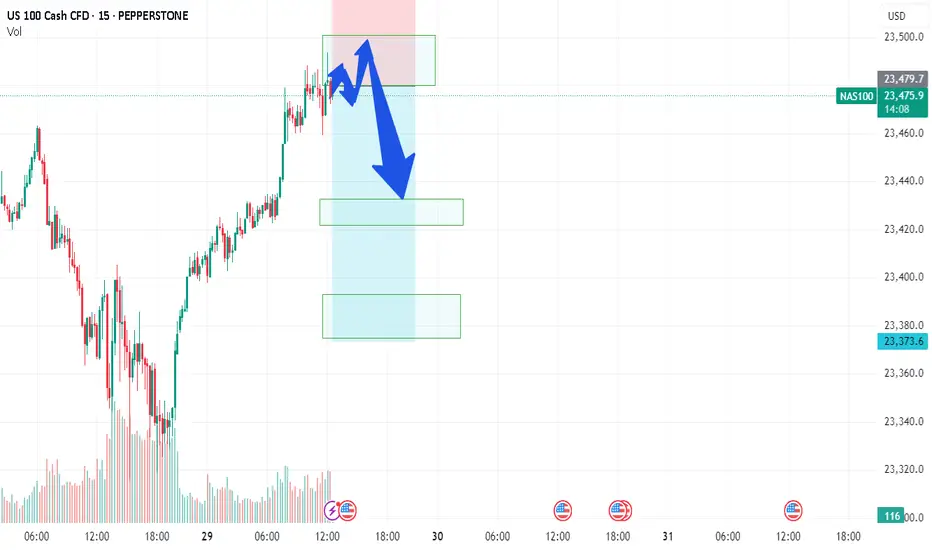
NAS/TEC100 - LETS GET NASTY ON NAS100Team, NAS currently sitting at 23480, before the US market open
however during the market open, please be aware of the volatility that may hit your stop loss
You have 2 options to trade on this NAS- NASTY
Option 1: wait for market open, if it hits 23500-23515 - then short with stop loss at 23580
Option 2: Short at the current market with small volume - and if the market open with volatile, you can take another advantage of shorting more volume as per option 1 instructed.
OK, pick your strategy! do NOT be shy.
I am going to have small short position and will consider adding more during US market opening after 5-10 minutes, much easier to see the direction of the market - we do LIVE trading everyday. Please note: if NAS fall below 23450-40 bring stop loss to BE (Break even)
1st TARGET range: 23435-23416 - make sure take 70% volume
2nd target at 23390 to 23376
Why do I short on NAS when tomorrow rate decision, i think this quarter report, market will not be the same as last quarter, even rate cut!
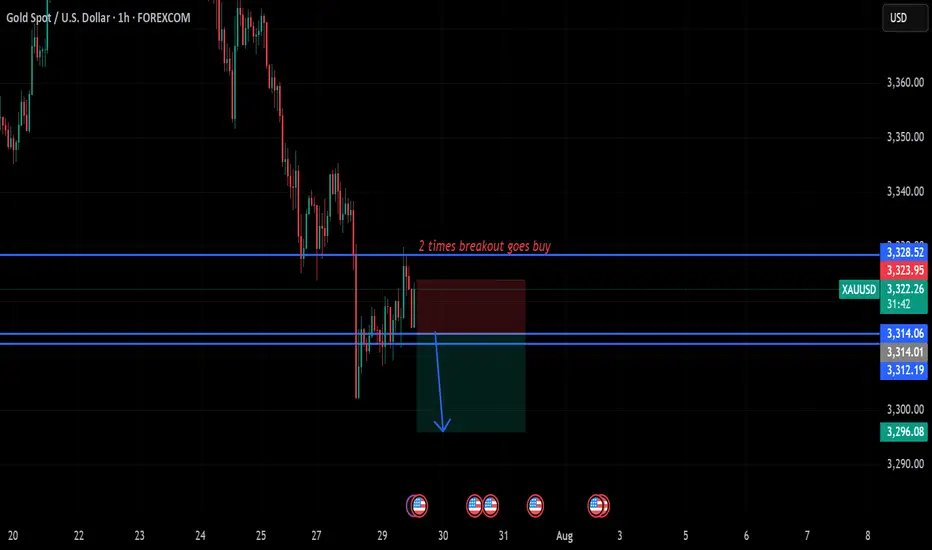
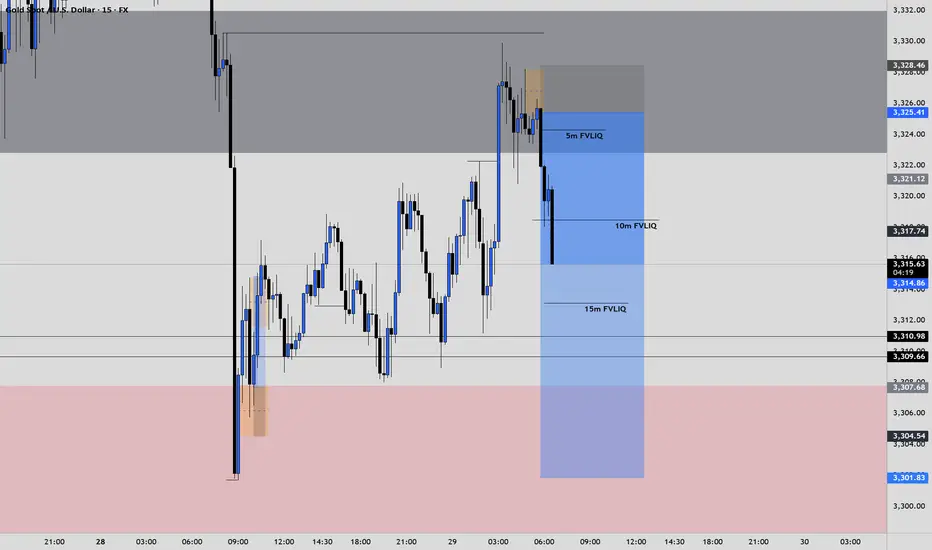
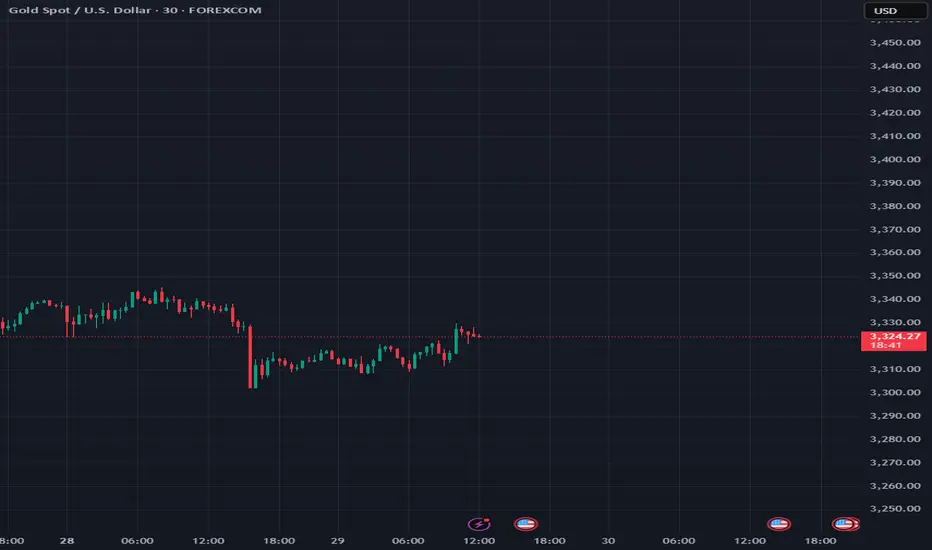
gold on sideways#XAUUSD price await double breakout above 3328.6 for bullish to take place. But now we await for any breakout to take trade.
Below 3314 holds sell continuation, target 3296, stop loss 3324.
Above 3328.6 on 2 times breakout will start bullish till 3340.
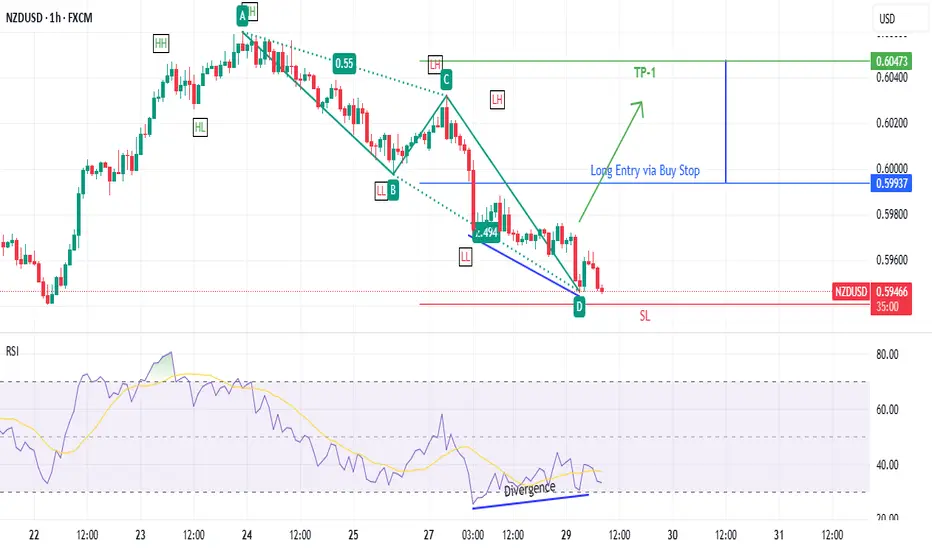
NZDUSD long trade dated 29 July 2025- Breakout of last LH will suggest that the odds are in favour of the long trade
- Presence of a bullish AB=CD pattern increases our chances. However entry set via Buy Stop after confirmed trend reversal
XUSDT Breakout Idea – High Risk, High Reward Entry: 0.00005790
🛡️ Stop Loss: 0.0000417 (support zone)
🎯 Target (TP):
• TP1: 0.00006718 (resistance)
• TP2: 0.00018580 (major resistance)
• TP3: 0.0008 (measured move, +1318%)
🔺 Setup: Falling wedge breakout with low-volume accumulation. Price has broken trendline resistance with bullish momentum. Risk-to-reward is strong for patient holders.
📌 Note: Highly speculative. Small cap. Only risk what you can afford to lose.
#XUSDT #CryptoTrading #BreakoutSetup #AltcoinGems

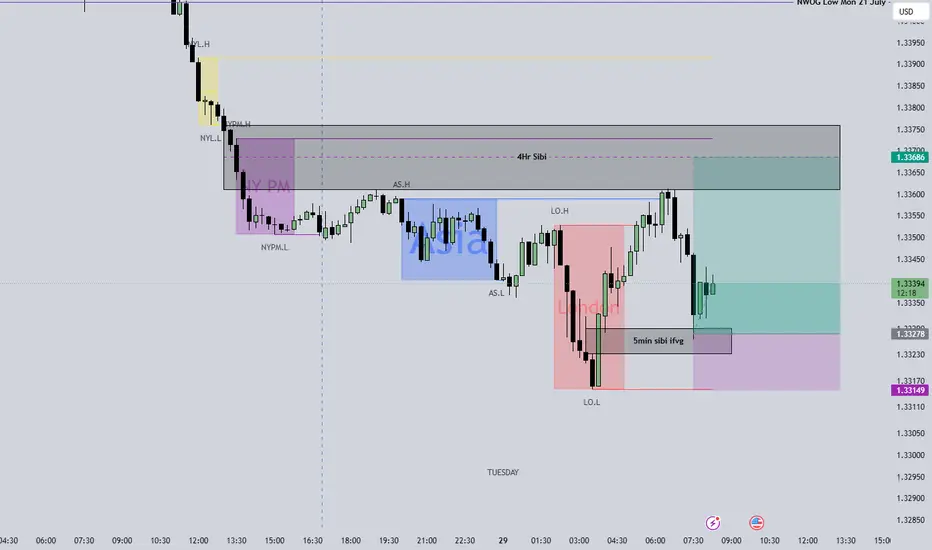
GBPUSD Bullish Retracement into NY KillzoneSetup Break above the Asian high (1.33600) leaves inverse SIBIs at:
4 h – 1.33610
1 h – 1.33440
15 m/5 m cluster – 1.33280
Entry & Stops
Primary: 1.33280–1.33320 (5 m/15 m cluster)
Alternate: 1.33440 retest (1 h SIBI)
Stop: below 1.33150 (Asian low)
Targets
1.33600 (Asian high)
1.33610 (4 h SIBI)
Trade Management
Move SL to breakeven at 1:1 R :R
Scale 20% at TP1
Trail SL beneath each lower‐timeframe SIBI
Watch for volume/VWAP confirmation into NY session
Chart markers: entry zone, SL line, TP levels, SIBI arrows. Trade your edge—let the killzone fuel it.
dogeusdtMy opinion is based on the Arti M strategy. Share your thoughts with me. Is your opinion right or wrong?
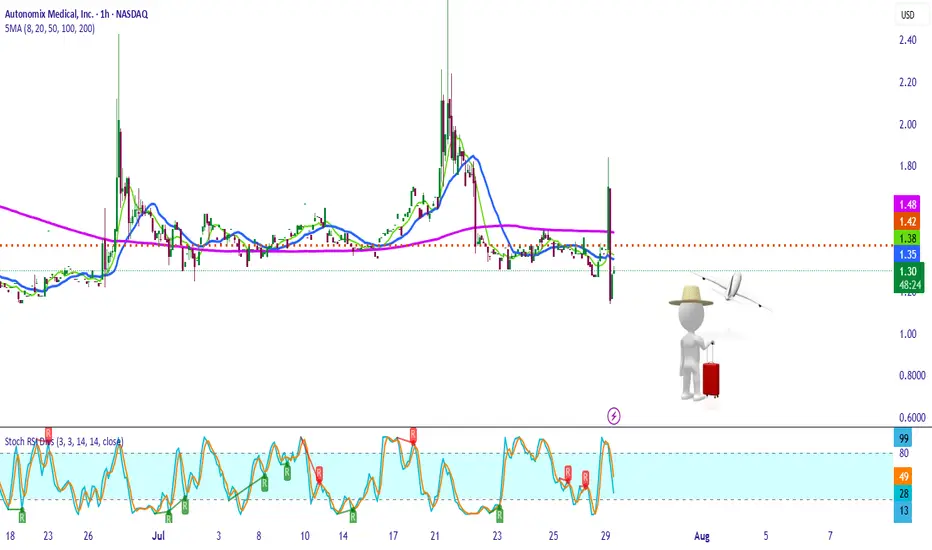
“Pack Your Bags… or Bail Out Fast”This is the “I’m just here for the pop” strategy — where we ride that violent engulfing candle like it owes us money… but keep one hand on the eject button. AMIX just flash-banged the chart with a surprise move from the graveyard, blowing past the 50MA like it saw its ex.
We’re targeting a scalp-to-swing depending on whether it holds above $1.36 (5MA) or rejects at $1.42–$1.48 (previous supply zone).
Tight stop under $1.29, because if this turns fake, you’ll be dragging that little red suitcase next to the cartoon dude — headed back to “Bagholder Island.”
Trading balanceTrading balance The price of the asset has rebounded from the balance zone. With the prospect of growth into the resistance zone.
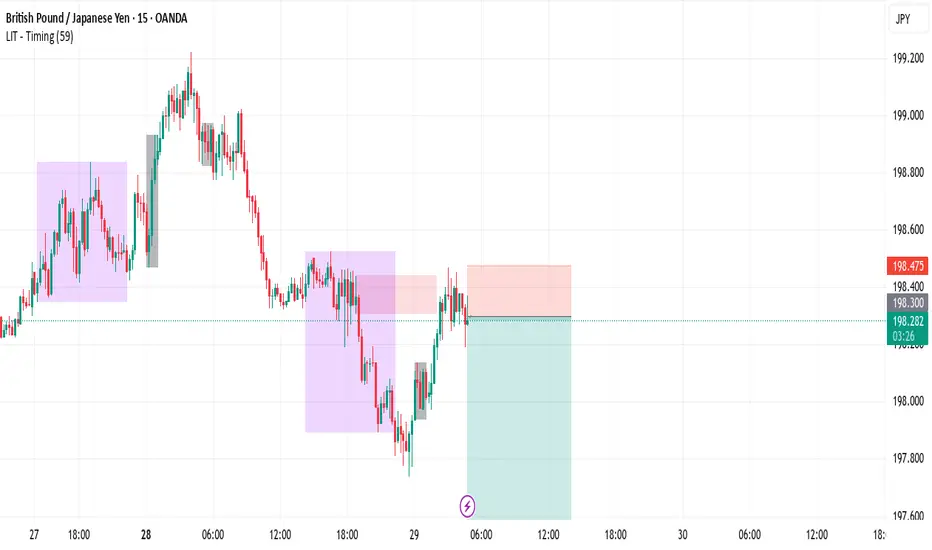
GBPJPY SellLIT cycle combined with Daily cycle. Price is overall bearish as it took liquidity on higher time-frames and we should be trading away from the inducement.
Eyes on the Break USDJPY Approaches Key Resistance with Bullish.USDJPY Technical Outlook Bullish Momentum Gaining Strength
USDJPY is currently displaying a strong bullish structure, having taken a clean bounce from the ascending trendline support. This upward movement was further validated as the pair successfully broke through a significant resistance level, triggering a Market Structure Shift (MSS) a clear signal that the prior trend has potentially reversed or evolved.
Following the MSS, a Break of Structure (BoS) to the upside has confirmed the continuation of this bullish momentum. The price action is now navigating above the previous demand zone, indicating strong buying interest in that area.
Notably, the market retraced slightly to retest the bullish engulfing zone, reinforcing the strength of buyers at that level. After this healthy retest, price action is once again pushing upward.
Now, all eyes are on the next key resistance zone. If USDJPY manages to decisively break above this level and prints a valid bullish confirmation (such as another structure break, strong candlestick pattern, or liquidity sweep followed by a reversal), it would open the door for an extended upside move, potentially targeting higher time frame liquidity pools.
Traders should closely monitor price behavior around this resistance zone. A confirmed breakout with volume or institutional candle formations could provide an excellent opportunity for continuation buys, in alignment with the prevailing bullish sentiment.

XAUUSD ShortElite Analysis
Noticed price came to structural liquidity
Obtain confirmations to short
Executed from 3m OB
Targeting Lower liquidity pools, main target London low
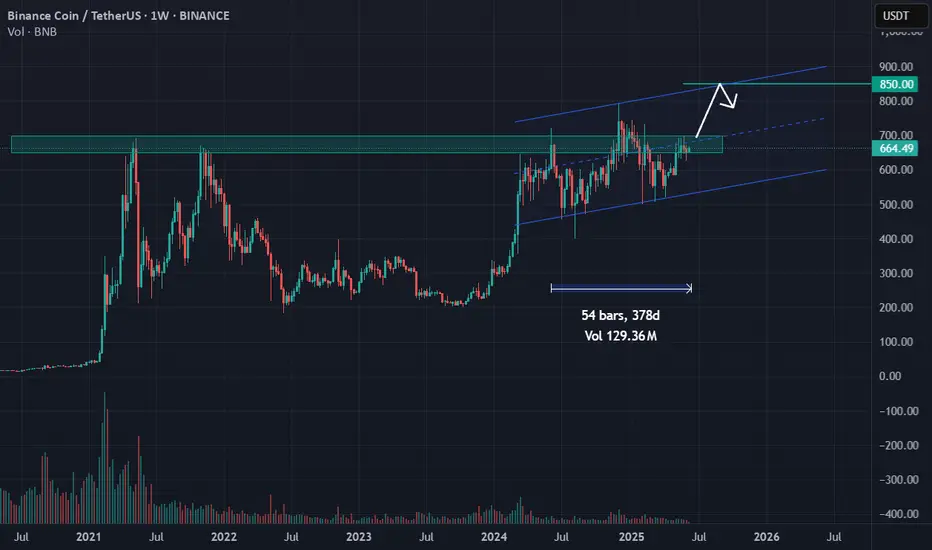
BNB - Challenging chart to analyzeBINANCE:BNBUSDT CRYPTOCAP:BNB CRYPTOCAP:BNB.D
Technical analysis :
BNB is one of the most challenging charts to analyze. I will try to decypher the hidden patterns.
The BNB was in accumulation range for more than 1 year. The blue parallele channel limits the price movement.
Today, BNB is trading in the historical distribution level presented by the green rectangle. This shows the solid accumulation.
Psychological analysis :
The BNB was holding very well during recent BTC decline, which make It very attractive for investors as the project and the platform are strong. BNB will always be holding good as the platform is still attracting more and more traders all around the world. If Binance is not OK , all crypto market will be impacted.
Risks :
- Gorvernment fighting the platform
- Hacking
Rewards :
The main target of BNB is $850. If this level is broken with big volume, the next target is $1,000.
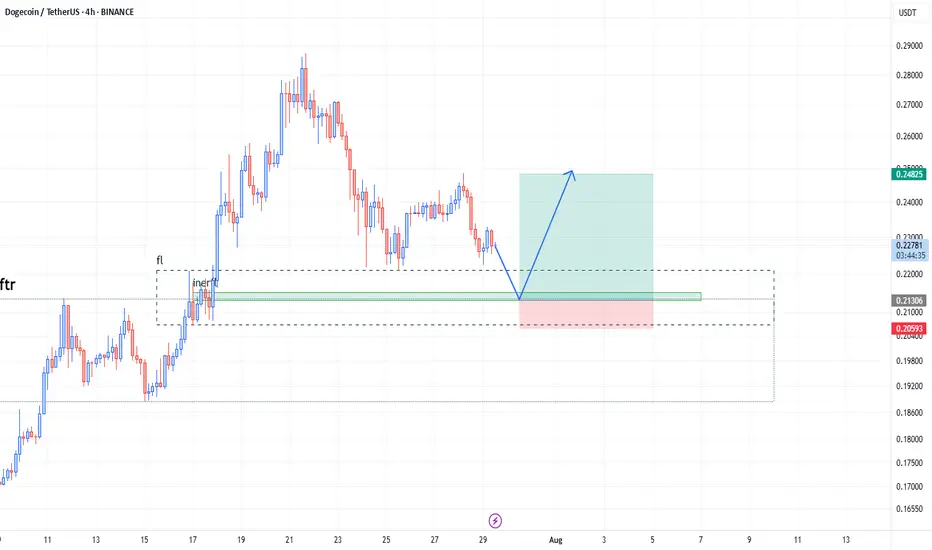
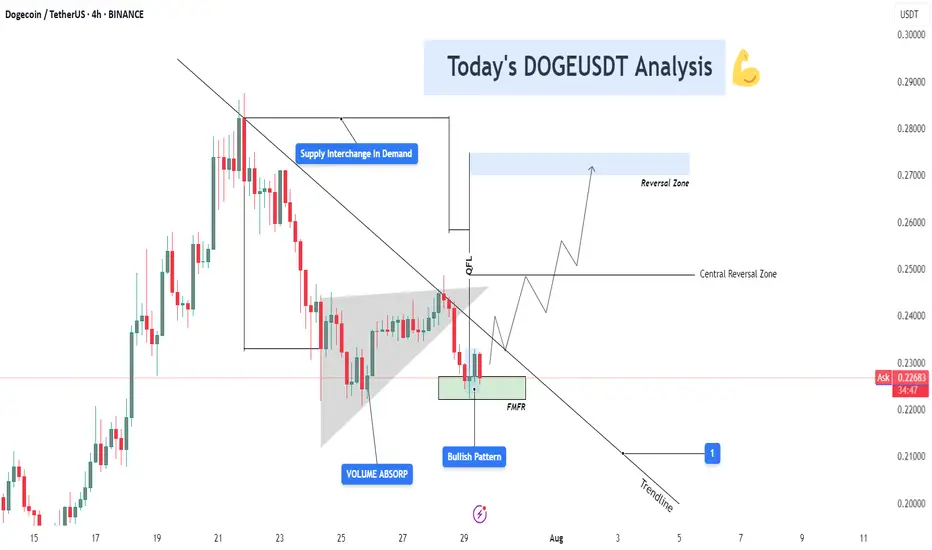
DOGEUSDT 4H – Bullish Reversal Building from FMFR Zone📊 Chart Context & Market Maker Concept Breakdown
DOGEUSDT on the 4H timeframe is setting up for a potential trend reversal, following a structured retracement into a strong demand zone that aligns with multiple smart money confirmations: QFL base, trendline break, volume absorption, and FMFR (Final Move Final Reaction). Let’s dive into the technical layers of this setup:
🔻 1. Downtrend Phase & Structure Setup
After peaking near $0.29, DOGE entered a controlled downtrend, respecting a descending trendline and forming a consistent lower-high structure.
Each rejection from the trendline reflects institutional distribution, gradually pushing price into lower demand levels where value buyers can step in.
🔄 2. Supply Flips into Demand (S/D Flip Zone)
A key level near $0.225 – $0.230 initially acted as a supply zone — but following QFL logic and smart money reaccumulation, it is now showing signs of demand activation.
The chart highlights “Supply Interchange in Demand”, which means that this zone has been repurposed — from distribution to accumulation — another MMC footprint.
📌 Interpretation: This is where large players flip their position bias and start loading for the next leg up.
🔵 3. Volume Absorption Confirmed
Prior to the current bounce, a strong volume absorption phase was detected within a falling wedge or triangular base, shown on the chart.
Despite sell-side pressure, buyers continued to absorb orders — a sign that selling is weakening, and accumulation is underway.
📌 Clue: Volume absorption often precedes an explosive breakout, especially when aligned with FMFR or QFL patterns.
🔁 4. Final Move Final Reaction (FMFR)
Price tapped into the green box zone one final time, marked as FMFR (Final Move Final Reaction) — a key MMC reversal signal.
This occurs when market makers fake a breakdown (creating panic) and then sharply reverse, trapping breakout sellers and scooping up liquidity.
A small bullish candle formation (Bullish Engulfing / Pin Bar) can be seen within this zone — the “Bullish Pattern” label marks this.
🧠 Smart Money Logic: Institutions want liquidity. FMFR fakes weakness to attract retail shorts, then reverses to ride liquidity to the upside.
🔗 5. QFL Base + Break of Structure Setup
A QFL (Quick Flip Level) pattern is forming. This represents a market structure flip, where price first drops from a base, reclaims it later, and continues in the opposite direction.
Breaking this base and confirming above it would mark a true reversal in structure.
🛠️ Technical Confluences at Work
Element Insight
🔹 QFL Structure Base level reclaim in play (structure shift)
🔹 Volume Absorption Smart money soaking up sell pressure
🔹 FMFR Reaction Final stop hunt before the rally begins
🔹 S/D Flip Supply turned to demand near $0.225 zone
🔹 Bullish Pattern Early confirmation of reversal
📈 Projection Path & Reversal Zones
Two projected zones are mapped for price behavior:
🔸 Central Reversal Zone (~$0.250):
First significant resistance where price may pause or react.
Ideal partial profit level or re-entry after pullback.
🔹 Main Reversal Zone (~$0.270–0.275):
Target area for a full liquidity sweep.
This was a previous high-volume supply zone.
If price reaches here, expect potential rejection or distribution unless momentum is strong.
🎯 Trade Setup Strategy (Based on Your Chart)
Entry Area: $0.225 – $0.229 (FMFR Reversal Zone)
Stop-Loss: Below $0.221 (beneath FMFR low)
Take Profit 1: $0.250 (central zone)
Take Profit 2: $0.270 – $0.275 (main reversal zone)
📐 Risk-to-Reward:
TP1: 1:2
TP2: 1:3+ depending on entry timing
🧠 Psychology Behind the Setup
This DOGE setup is engineered to trap emotional traders:
Retail sellers enter late near the bottom.
Smart money waits at FMFR zone, absorbing liquidity.
Volume builds quietly.
Market reverses explosively, catching retail off guard.
By recognizing this setup early, you’re aligned with Market Makers, not against them.
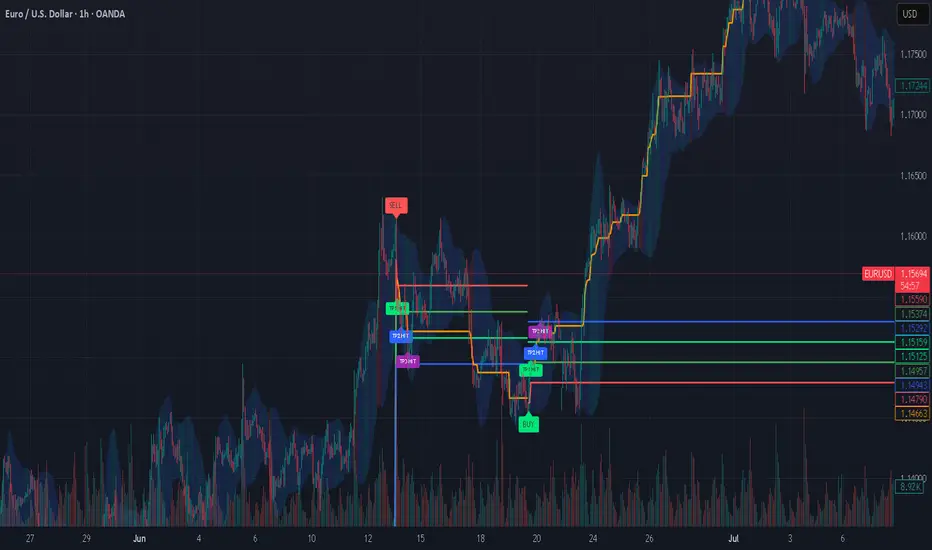
Should You Still Sell Your USD for EUR? A 2025 PerspectiveWith currency markets in constant flux, the decision to hold USD or convert to EUR carries major financial implications for investors, expatriates, businesses, and frequent travelers. As of July 29, 2025, the USD/EUR exchange rate is around 0.86–0.87, with $1 buying roughly €0.86. Is now the right time to sell your US dollars for euros? Here’s a balanced look at the latest data and forecasts.
Current Market Context: Dollar Weakness and Euro Stabilization
USD Slide in 2025: The US dollar has experienced its steepest decline in over three years, falling nearly 10% year-to-date. This sustained weakness is attributed to policy volatility, capital flowing out of the US, and narrowing interest rate differentials.
Key Exchange Rate: Recent rates hover between 0.85 and 0.87, representing moderate stability following a period of volatility.
Euro’s Resilience: While the euro has had its own struggles, from slower economic growth to political uncertainty in Germany and France, analysts forecast no major sustained fall for the euro through 2025.
2025 Forecasts: USD/EUR Direction—What Do the Experts Say?
Year-End 2025 Outlook: Major banks and forecasting firms expect the EUR/USD rate could climb even higher by year-end, meaning the euro could gain modestly versus the dollar if current trends continue.
Factors to Watch:
Fed Rate Cuts: Potential US rate cuts in Q3–Q4 remain a key driver for further USD weakness.
Trade & Tariff Uncertainty: Ongoing US tariff announcements and global trade tensions add volatility but also support safe haven flows to the dollar.
Eurozone Politics: Any resolution of political uncertainty in Europe could buoy the euro.
Most Important One: Fed's Money Printer...
Strategic Considerations: Should You Sell Now?
Locking in Current Rates: If you need euros to make payments, pay salaries, or make investments in the short term, converting a portion now could reduce your exposure to further USD downside.
If You Can Wait: Analysts see some chance for USD recovery in late Q3 or early 2026, but this is contingent on US policy stability and Fed decisions.
Averaging In: For larger transfers, consider splitting your transaction over time (also called dollar-cost averaging), which can help mitigate volatility.
Bottom Line
If you have an immediate need for euros, current rates present a reasonable opportunity. The dollar’s weakness throughout 2025 is well documented, but much of the pessimism may already be priced in. If you’re flexible with timing, monitor central bank policy signals throughout Q3/Q4, a more dovish Fed or unexpected eurozone stability could push rates further in your favor, but event risks remain elevated. Ultimately, a phased or hedged approach may offer both protection and potential upside
*not investment advice*
#forex #fx #dollar #usd #euro #eur #economy #trade #tariff #trading #indicator
TONUSDT Bullish Reversal from Demand with QFL Base | MMC Setup📊 Technical Breakdown – 4H Chart
✅ Overview
TON/USDT is exhibiting early signs of a bullish reversal after a structured decline into a key smart money demand zone. The setup reflects multiple layers of confirmation—QFL base, multi-supply absorption, liquidity inefficiencies, and a positive reversal pattern—suggesting a high-probability opportunity for upside.
🔹 1. Impulsive Move & Liquidity Sweep
Price rallied aggressively on July 22–23, pushing toward $3.60, breaking short-term highs and triggering liquidity grabs above recent consolidation zones.
This surge absorbed significant buy-side liquidity, leaving a supply zone behind, now marked as the Next Reversal Zone.
After liquidity was collected and orders filled, the market reversed sharply, consistent with institutional profit-taking or engineered liquidation traps.
🧠 Smart Money Insight: Institutions often push price into illiquid zones (above highs) to trap retail and fill large orders. This marks the first phase of the trap.
🔻 2. QFL Base and Multi-Supply Absorption
The price structure created a Quick Flip Level (QFL) — a smart money concept where price forms a base, drops, then rallies, leaving behind an institutional demand zone.
The current pullback has revisited this exact QFL base, now reinforced by 3x supply absorption, enhancing the zone's strength.
This confluence increases the probability of a strong reaction to the upside from this level.
📌 Note: The “If Cross 3x Supply” label shows that this zone has absorbed multiple attempts to break down. It's now acting as a demand pocket.
🔄 3. Reversal Area – The Engine Room of Smart Money
The Reversal Area is carefully marked at $3.20–$3.28 — the ideal discounted price zone where large buyers tend to step in.
This zone is structurally important:
Past breakout level
Aligned with QFL base
Beneath stop levels of breakout traders
A Positive Pattern has now formed within this area—likely a bullish engulfing, morning star, or pin bar, depending on candle confirmation.
📌 Psychology: This zone acts as a trap. Retail traders often panic sell here, while smart money accumulates quietly before launching price upward again.
🧭 4. Dual Scenario Structure – Projected Paths
You’ve beautifully mapped two valid future price scenarios based on reaction to the Central Reversal Zone (~$3.35):
🔵 Scenario 1 – Healthy Pullback Before Continuation
Price climbs toward the central zone, then pulls back slightly to retest support near $3.28–$3.30 (label 1).
This allows further accumulation before price breaks higher.
This is a safer re-entry scenario for patient traders looking for a retest.
🟢 Scenario 2 – Direct Impulsive Rally to Next Reversal Zone
Price continues with bullish momentum, slicing through $3.35 and aiming for the Next Reversal Zone at $3.52–$3.60 (label 2).
This zone contains remaining liquidity, left uncollected from the previous impulse.
Price is likely to reverse or pause at this level again due to heavy supply.
📌 Key Tip: If price reaches that zone without significant resistance or exhaustion, it may signal continuation potential with minor corrections.
💼 Strategic Trade Plan (High-Probability Setup)
Entry Zone: $3.20 – $3.28 (Reversal Area)
Stop-Loss: Below $3.15 (beneath structure + QFL base invalidation)
Target 1: $3.35 (Central Reversal Zone)
Target 2: $3.52–$3.60 (Liquidity Completion & Next Reversal Zone)
🧮 Risk-Reward Estimate:
Conservative: 1:1.8
Aggressive: 1:2.5 or better if price reaches high liquidity zone.
🔄 MMC Flow Summary – What the Market Makers Are Doing:
Create a trap at the top (collect liquidity and fake the trend)
Force price down into demand (scare retail + grab stops)
Absorb sell orders in bulk at QFL/demand zone
Form bullish reversal pattern (positive structure)
Push price upward again, aiming for uncollected liquidity above
📌 This is a classic MMC cycle — engineered by large players, and now you’re aligned with their strategy.
🧠 Why This Matters
This chart isn’t just about entry and exit; it’s about understanding the underlying psychology and structure. By aligning with the smart money footprint — QFL, supply absorption, and liquidity targeting — you're maximizing edge and minimizing guesswork.

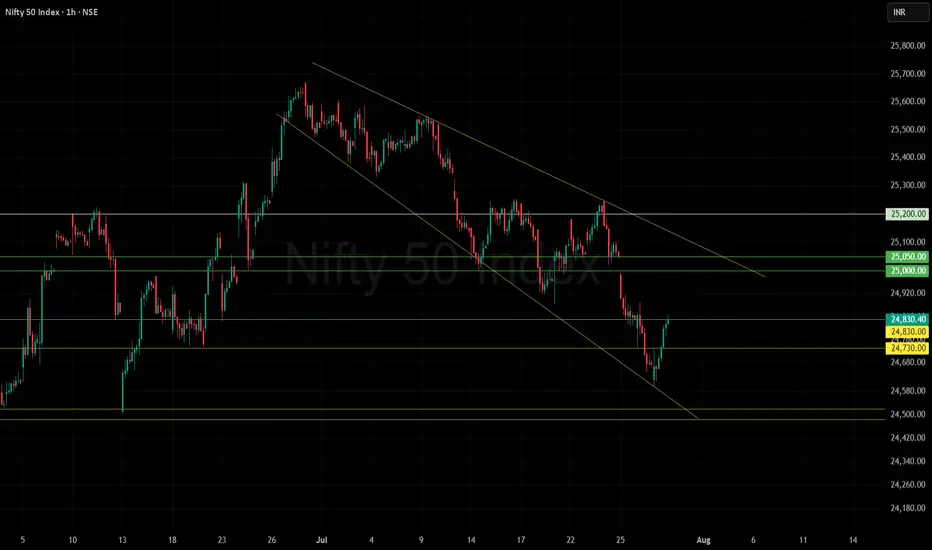
Nifty bounced backOur observation aligns well with the earlier analysis. The time cycle highlighted July 29 as a potential inflection point, and the strong short covering during the monthly expiry has clearly supported the 200+ point bounce today.
With NIFTY closing at 24,820, if it manages to cross the 24,850 level tomorrow, the path to 25,000 and possibly higher resistance levels should open up, signaling a stronger recovery.
Keep watching key supports around 24,700 as the base; sustained momentum above 24,850 will be crucial to confirm the bullish reversal. Stay nimble and monitor volumes and global cues for confirmation.
Report - 29 jully, 2025Summary
Initial optimism following the historic US–EU trade agreement has swiftly eroded as France and Germany openly criticized the deal, warning it undermines EU sovereignty and economic stability. The euro fell sharply, carmakers led equity declines, and political fractures within the bloc widened. While the deal averted a full-blown trade war, concerns over inflation, competitiveness, and regulatory submission have shifted sentiment. The perception of European capitulation under pressure from Trump has reignited transatlantic tensions and injected fresh volatility into global markets.
This retreat in EU support underscores the precarious nature of transatlantic cooperation under Trump’s economic nationalism. Meanwhile, signs of tech decoupling, tariff expansion beyond the EU, and deferred retaliation signal a fractured global trade order. European fiscal policy, particularly Germany’s defense-driven deficit expansion, is now under heightened scrutiny amid market volatility and FX pressure.
Market Reactions
Equity markets across the EU opened higher on tariff relief expectations but reversed course as Germany’s Chancellor Merz and France’s Prime Minister Bayrou denounced the deal. The DAX fell 1.1%, CAC 40 slipped 0.4%, and eurozone auto stocks plunged 1.8%. The euro lost over 1% against the dollar in its second-largest daily drop this year, reflecting concern over structural imbalance and political subordination.
In contrast, semiconductor stocks surged, with ASML and BE Semiconductor rising over 4% as the tech sector escaped tariffs. Wall Street remained relatively stable, buoyed by optimism around defense, energy, and tech sectors gaining from the deal. The dollar index (DXY) rose 0.9%, reflecting both euro weakness and expectations that inflationary tariffs could keep Fed rates elevated.
Fiscal and Political Implications
The backlash from Berlin and Paris lays bare deep fractures within the EU regarding its posture toward Washington. Chancellor Merz’s warning of "considerable damage" and Bayrou’s reference to EU “submission” cast doubt on Ursula von der Leyen’s negotiation strategy. The deal’s imposition of a 15% baseline tariff—triple the pre-deal weighted average—exposes Europe to substantial cost increases without achieving reciprocal liberalization.
Internally, the European Commission is accused of caving to U.S. pressure while undermining its own credibility. Documents and diplomatic leaks suggest that more aggressive retaliatory planning was watered down due to fears of a broader security rupture, particularly concerning NATO and U.S. arms support to Ukraine. This reinforces the EU’s strategic dependency, limiting its ability to resist U.S. economic coercion.
Germany’s effort to shield its auto industry via offset schemes largely failed, while Brussels’ “trade bazooka” was shelved in favor of “strategic patience.” This perceived capitulation may embolden further unilateral action from the U.S., especially as Trump eyes tariffs on pharmaceuticals and rest-of-world imports up to 20%.
Strategic Forecasts
Europe's short-term economic outlook has darkened. The tariff burden—especially on high-margin exporters like German autos—raises inflation risks while lowering competitiveness. Political backlash could destabilize Commission leadership and provoke calls for more aggressive economic sovereignty.
Expect further euro weakness, sectoral underperformance in autos and industrials, and possibly downgrades to GDP forecasts across the eurozone. On the U.S. side, Trump’s success with transatlantic leverage may embolden him to expand tariff threats to Asia and Latin America. The Fed will likely face a more inflationary policy environment, with fiscal and protectionist stimulus prolonging higher rate expectations.
Simultaneously, China's relief from U.S. tech export freezes—designed to secure a Xi-Trump summit—adds complexity to the strategic tech rivalry. The suspension of chip export controls could spur near-term capital inflows to Chinese AI firms while igniting concern in U.S. defense circles.
Risks and Opportunities
Risks
Breakdown in EU cohesion and trust in Commission leadership
Expansion of U.S. tariffs to rest of world (ROW), escalating global trade friction
Retaliation by China if U.S. chip diplomacy reverses
Drag on European industrial profits and inflation-driven ECB recalibration
Fed rate path upwardly skewed due to structural tariff-driven inflation
Opportunities
U.S. defense and energy sectors benefit from guaranteed EU purchases
Semiconductors remain shielded, with valuation support in ASML, TSMC, Nvidia
Dollar strength provides tactical trades in EURUSD, GBPUSD
Select EM exporters (e.g. Brazil) benefit from re-diversified trade flows
AI hardware and chip infrastructure (Samsung–Tesla deal) gains strategic momentum
Key Asset Impact – Outlook
XAUUSD (Gold):
Gold holding firm around $3,340. With fresh political discord and rising protectionist inflation, gold remains a hedge. If Fed signals rate hold, expect a push to $3,400.
Bias: Bullish
S&P 500:
Resilient, driven by defense, energy, and AI. But prolonged strong dollar and tariff-induced input cost pressures are risk factors.
Bias: Moderately Bullish
Dow Jones:
Benefiting from defense and dividend-heavy mix, but under pressure from industrial drag.
Bias: Neutral to Bullish
DXY (US Dollar Index):
Strengthening on euro weakness and policy divergence. However, long-term Fed autonomy concerns and political volatility could reverse trend.
Bias: Bullish short-term, Neutral longer-term
USDJPY:
Little movement today. BoJ still cautious, yen capped unless Fed shifts dovish or global risk-off resumes.
Bias: Range-bound
EURUSD:
Second-largest single-day drop YTD. Political backlash and export headwinds limit upside.
Bias: Bearish
Crude Oil (WTI):
Flat to slightly higher, supported by EU commitment to U.S. energy, but demand data remains soft.
Bias: Neutral
Stoxx Autos:
Heavy selloff (-1.8%) despite tariff reduction, reflecting margin pressure.
Bias: Bearish
ASML / BE Semiconductor:
Relief rally on tariff exclusion. Long-term tailwinds from open AI infrastructure and Samsung–Tesla chip deal.
Bias: Bullish
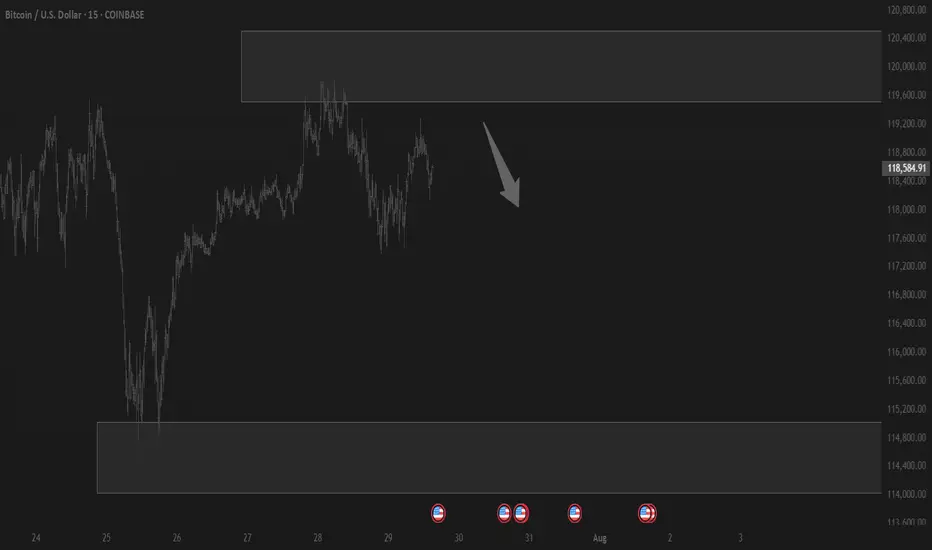
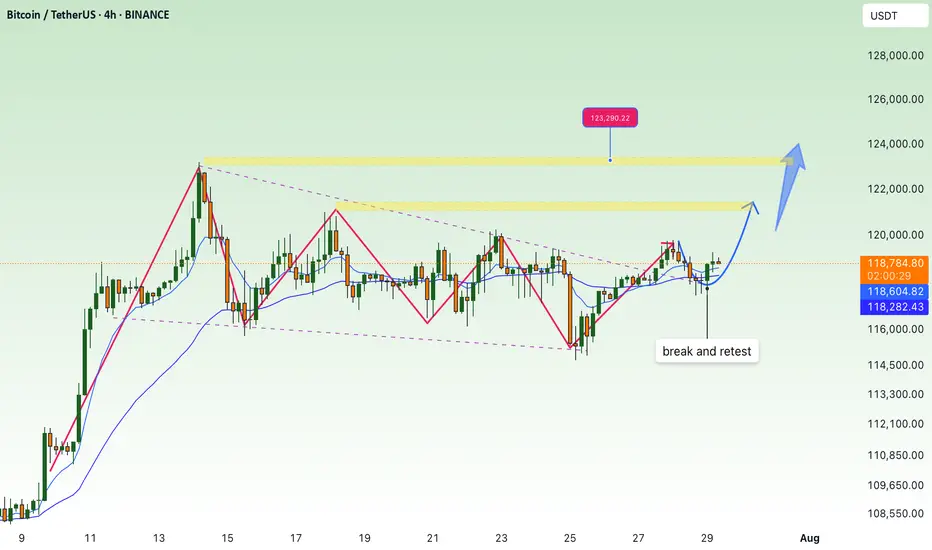
BTC Accumulation, Bullish Breakout Signs💎 BTC PLAN UPDATE
1. Key Chart Features:
Currently, the BTC/USD price is at $118,893.
The chart shows a strong upward trend recently, and we are seeing accumulation with short-term corrections.
2. Fibonacci Levels:
The Fibonacci retracement levels are drawn from the lowest point ($114,460) to the highest point ($119,809).
At the moment, the price is hovering near the 0.5 retracement level ($113,000), which is a key support level.
If the price holds above this level, a rebound is likely.
3. Trendlines and Price Patterns:
The trendlines (dashed blue lines) are indicating a descending triangle pattern, which could lead to a breakout if the price surpasses resistance levels.
A potential Head and Shoulders pattern might be forming, though it is not yet clear and needs confirmation by breaking key resistance.
4. Breakout and Retest Zone:
The breakout zone (red area) is around $119,000.
If the price breaks and holds above this level, we may see a continuation of the uptrend toward the next target around $122,792 (Fibonacci 1.618 level).
After the breakout, the price might retouch (retest) this support area before resuming the upward movement.
5. Technical Indicators:
• Moving Averages (MA):
• The red MA (long-term) is below the current price, indicating a strong uptrend.
• The yellow MA (medium-term) is near the current price, providing support for the uptrend if it holds.
• RSI Indicator:
The RSI has not yet reached overbought levels, suggesting that the market still has potential to rise without being overheated.
6. Conclusion:
If the price breaks above the $119,000 resistance and maintains that level, BTC/USD could continue its strong bullish trend, potentially targeting $122,792 or even $127,941.
Note: If the price fails to hold above $119,000 and drops back below, a pullback to the nearest support level at $114,460 may occur.
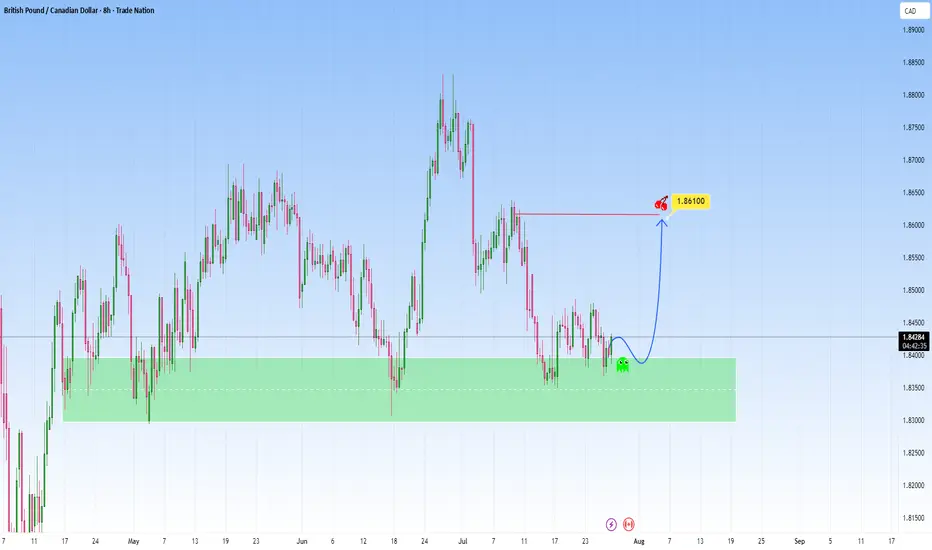
GBPCAD At Support - High probability reversalGBPCAD descended with strength, and has now reached a strong support zone.
Price now hovers above and this zone and is a great indication to use for possible reversal move, that could send price into the 1.86100 level.
But if price breaks below support with momentum, then I’ll back off this bullish bias and reassess, and consider the reversal idea invalidated, with potential for further downside.
Just sharing my thoughts for the charts, this isn’t financial advice. Always confirm your setups and manage your risk properly.
Disclosure: I am part of Trade Nation's Influencer program and receive a monthly fee for using their TradingView charts in my analysis.
BTC AI Prediction Dashboard - 6h Price Path (29.07.25)
Prediction made using Crypticorn AI Prediction Dashboard
Link in bio
BTCUSDT Forecast:
Crypticorn AI Prediction Dashboard Projects 6h Price Path (Forward-Only)
Forecast timestamp: ~09:00 UTC
Timeframe: 15m
Prediction horizon: 6 hours
Model output:
Central estimate (blue line): -118,729
Represents the AI’s best estimate of BTC’s near-term price direction.
80% confidence band (light blue): 118,724 – 119,346
The light blue zone marks the 80% confidence range — the most likely area for price to close
40% confidence band (dark blue): 118,151 – 119,894
The dark blue zone shows the narrower 40% confidence range, where price is expected to stay with higher concentration
Volume on signal bar: 95.57
This chart shows a short-term Bitcoin price forecast using AI-generated confidence zones.
Candlesticks reflect actual BTC/USDT price action in 15-minute intervals.
This helps visualize expected volatility and potential price zones in the short term.
