DCF VALUATION ANALYSIS OF BSEConclusion: OVERVALUED
:-OVERVIEW
BSE Limited has shown strong financial growth in recent years. Its revenue jumped from ₹924.84 crore in FY23 to ₹1,592.50 crore in FY24 (a 72% increase), and further surged to ₹3,212 crore in FY25, doubling year-on-year. EBITDA grew impressively to ₹1,779 crore in FY25 with a 60% increase, and EBIT reached ₹1,670 crore, up 56%. Net profit also rose significantly to ₹1,112 crore, with earnings per share increasing to ₹81. Dividend per share improved to ₹23, reflecting healthy returns
DCF:
-The valuation was performed using a Discounted Cash Flow (DCF) approach based purely on verified financial data and market risk parameters without relying on user-specific growth assumptions.
-The cost of equity was calculated using an adjusted risk-free rate plus equity risk premium multiplied by beta, resulting in a discount rate of approximately 13.58%. The terminal growth rate was conservatively taken as 4%. Using these reliable inputs and actual EBIT cash flows, the intrinsic enterprise value was estimated at around ₹36,839 crore, translating to an intrinsic value per share of approximately ₹1,364.
-Currently, BSE’s market price is around ₹2,480 per share, which is substantially higher than the intrinsic value derived from fundamentals, indicating the stock is trading at a significant premium. This valuation is grounded in audited company financials and globally accepted valuation methodologies, providing a trustworthy reference point for investors.
Beyond Technical Analysis

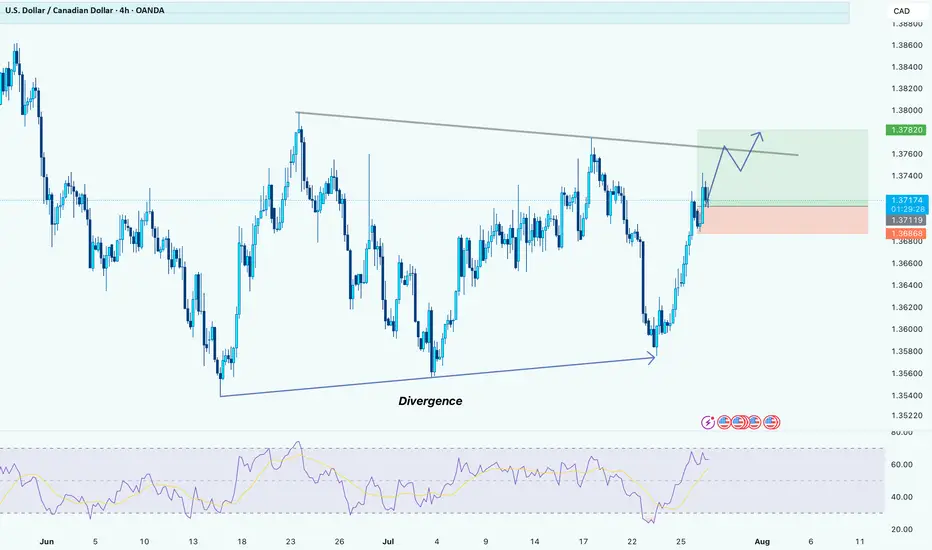
USDCAD: a long positionHello guys.
Divergence:
A bullish RSI divergence is noted, price made lower lows while RSI formed higher lows, signaling a potential bullish reversal.
Price Action:
Price has bounced strongly from around the 1.3570–1.3580 zone and is now approaching a descending trendline resistance.
Trade Setup:
Entry: 1.3718
Stop Loss: Below the breakout candle, near 1.3686
Take Profit: Around 1.3782
Risk-to-Reward: 1:3
SOLUSDT - Long Term Sell Cycle SOLUSDT
long term sell cycle
TP at 96.82
% bubble ratio
Solana entered into a positive bubble with fair value at 96… cycle term is long
Spot Trading plan:
No entry ⛔️ in positive bubbles

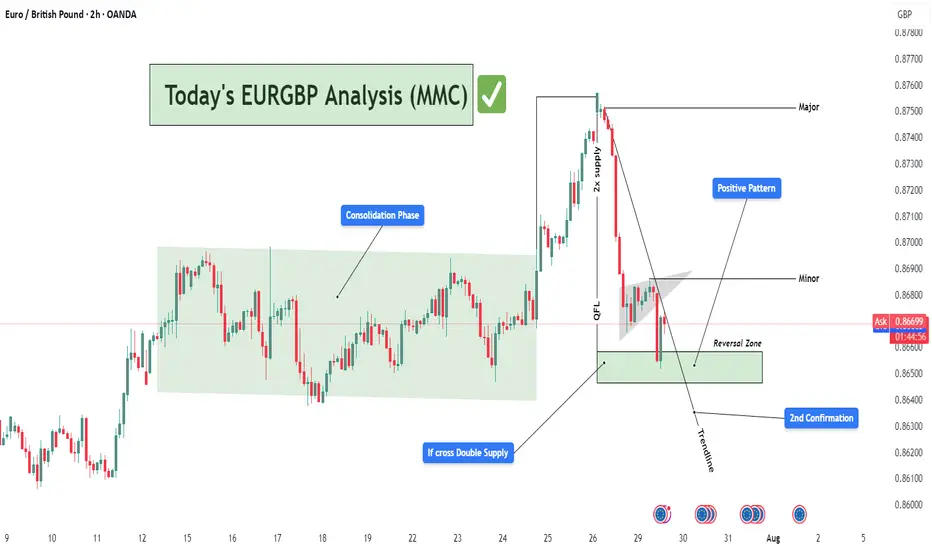
EURGBP Bullish Reversal Setup from Demand Zone (MMC Strategy)📊 Detailed Technical Analysis:
The EURGBP pair on the 2-hour chart is currently at a critical technical juncture, showing signs of a potential bullish reversal. This analysis follows Market Maker Concepts (MMC), which combines liquidity engineering, smart money movements, and structure shifts. Let’s break it down:
🔄 1. Consolidation Phase – Accumulation in Action (Smart Money Footprint)
Between July 15 to 24, the price moved within a tight range — classic consolidation behavior.
This phase suggests accumulation by institutional players, quietly building long positions while trapping retail shorts and longs.
This kind of sideways structure typically precedes a high-volume breakout, which happened right after.
📌 Lesson: Consolidation is often the calm before the storm — prepare for a breakout when this phase completes.
🚀 2. Breakout with QFL Pattern – Aggressive Bullish Shift
The price broke above the consolidation range and surged strongly.
This breakout followed a classic QFL (Quick Flip Level) structure — where price forms a base, drops temporarily, and then explodes upward.
The area of breakout aligns with a “2x Supply” zone — meaning this zone acted as a magnet for stop orders, and once breached, added more fuel to the rally.
📌 Why QFL Matters: It marks a shift in market sentiment — from balanced to strongly biased, in this case toward bulls.
📉 3. Pullback Phase – Structural Correction Begins
After reaching a high near 0.87500 (major resistance), price began to pull back sharply.
It formed a minor descending flag/channel, a classic corrective pattern, often a pause before resuming the larger trend.
A descending trendline has been drawn to capture this pullback structure.
📌 Important: Pullbacks are healthy — they allow for re-entries and provide better R:R setups.
📍 4. Reversal Zone – Key Demand Revisited
Price now sits within a Reversal Zone (Demand Area), marked in green on the chart.
This level previously served as the base for the breakout and aligns with institutional buying interest.
The area acts as a high-probability buy zone, supported by:
Trendline support
Price rejecting lower levels
Historical reaction at this zone
📌 Why It’s Crucial: If price respects this demand zone, it confirms bullish intent and creates a low-risk buying opportunity.
✅ 5. 2nd Confirmation – Price Action Support
The chart marks a "2nd Confirmation" label at a slightly lower level — this is a final support level, a safety net.
If price dips and bounces here again, it confirms buyer strength.
Strong price reaction at this level would validate a trend continuation setup back toward highs.
💹 6. Positive Pattern – Early Reversal Signs
Inside the demand zone, a bullish structure is forming.
This could be an inverted head & shoulders, or a double bottom pattern.
These patterns often act as launch pads for upward moves, especially when combined with institutional demand.
📌 MMC Insight: Market Makers engineer dips to induce panic, only to reverse aggressively once liquidity is absorbed.
🎯 Trade Plan Based on the Analysis:
Buy Zone: Between 0.86450 – 0.86700 (Reversal Zone)
Stop-Loss: Below 0.86250 (beneath 2nd confirmation)
Take Profits:
🎯 TP1: 0.86900 (Minor resistance)
🎯 TP2: 0.87500 (Major swing high)
Risk-to-Reward: 1:2 or higher depending on entry timing
🧠 MMC Strategy Summary for Minds:
This EURGBP 2H chart is a textbook example of MMC-based trading. We saw:
Institutional accumulation (consolidation phase)
QFL breakout (confirmation of bullish intent)
Return to demand (market maker’s discount area)
Early bullish signals (positive price action patterns)
Multiple confluences at the Reversal Zone (trendline, demand, confirmation zone)
Such a combination offers a high-probability swing trade setup. Patient traders can wait for the structure to break upward and join the trend with tight risk and clear targets.
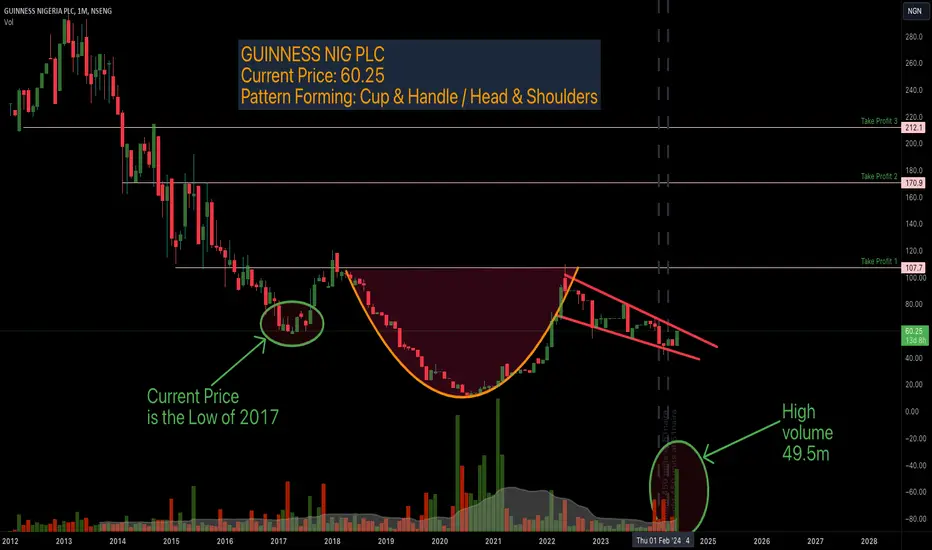
Guinness Nigeria PLC ... time to buy?So!
Guiness NIgeria PLC price action just formed a Cup and Handle pattern. The chart could also double for an inverse head and shoulder.
Current price: 60.25
Investment buy reasons:
1. Notably, a high volume buy of over 49.5m just entered into the market.
2. Current price is the low price of 2017 and hence Low Risk Buy
Profit taking areas if this analysis proves right: 107, 170, 212
Analysis invalidates below 49
One of the questions i get: "why you charting stocks?". Really? Isn't Price action involved in it's movements?
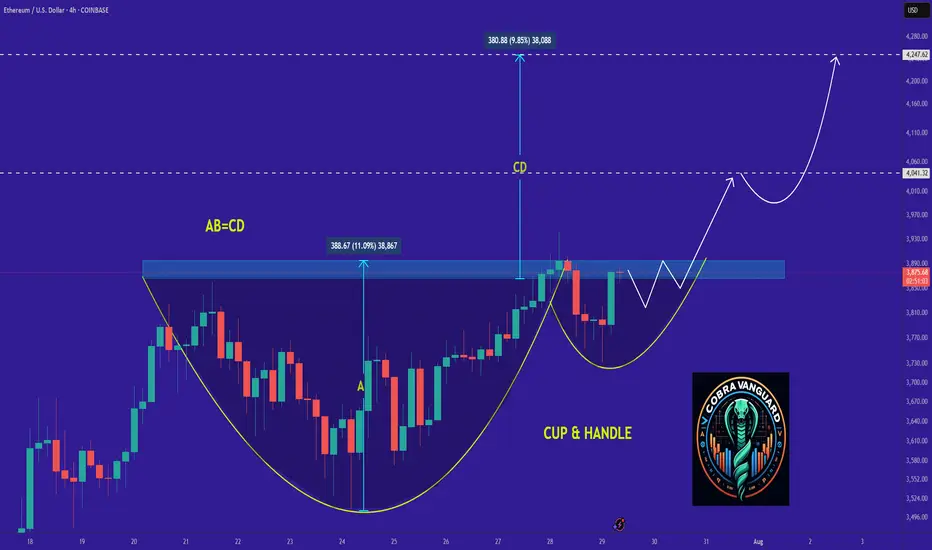
Ethereum - Time to buy again!It can be said that the price has formed a cup and handle pattern, which it is completing soon. If the price follows this pattern, it can be expected that Ethereum will reach its peak again.
Best regards CobraVanguard.💚
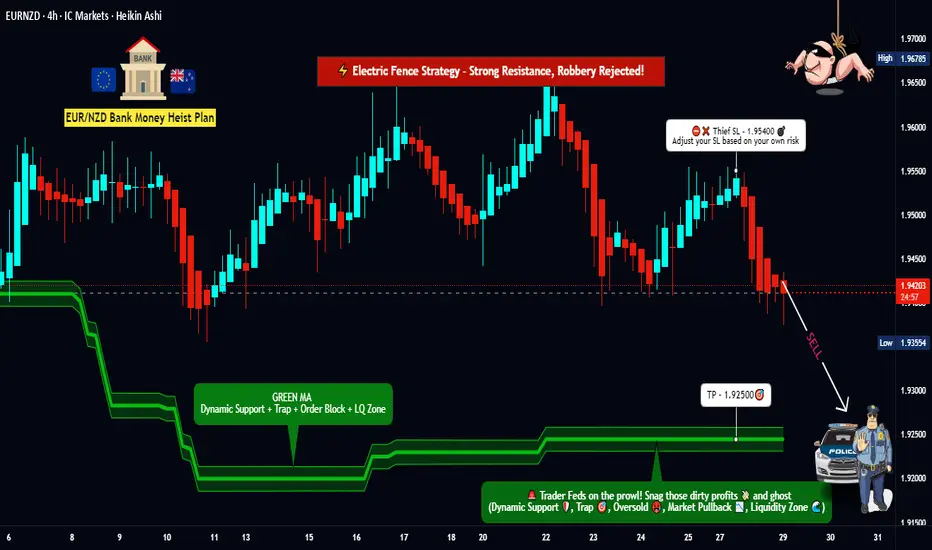
Dynamic Entry Alert – EUR/NZD Bearish Heist Execution!💣 EUR/NZD Robbery Blueprint: The Kiwi Vault Bearish Heist Plan 💰🕵️♂️
🌟Hi! Hola! Ola! Bonjour! Hallo! Marhaba!🌟
Dear Money Makers & Robbers, 🤑💰✈️
This ain't your usual trading tip — it’s a Thief Trading Masterstroke 🎯. We're gearing up for a high-stakes heist on the EUR/NZD forex market. Time to crack open the Kiwi vault and rob those bullish bandits blind! 😼💣
🧠 Strategic Mindset:
🔍 We're targeting the oversold consolidation zone. Bullish traders think they’re safe? Think again. This area is a trap — the perfect bait for our bearish ambush. Expect trend reversal vibes, layered with juicy liquidity grabs.
🕵️♂️ Entry Plan:
🎯 Sell Entry: The vault is wide open! Swipe the Bearish loot at any price - the heist is on!.
💣 Setup:
Sell Limit Orders at nearest swing highs (15m or 30m timeframe)
Use DCA / Layering Method for multiple entries (scalp or swing tactics)
📌 Set your Alert 🚨 — no breakout, no entry. Patience pays.
🛑 Stop Loss Strategy (SL):
No premature moves! Don’t place that SL till we get the confirmed break.
🔥 SL Recommendation:
Just above 1.95400 (4H candle wick swing high)
Adjust based on lot size and number of layers
📍 Remember, the market’s a jungle — stay sharp or get sliced.
🎯 Take Profit (TP):
💵 Target Zone: 1.92500
(But hey, escape early if the vault starts shaking. Protect your gains like a pro.)
📊 Macro Intel – Why This Works:
This isn’t random — it's backed by our 🔥 combo of:
COT Reports
Sentiment Analysis
Quant/Algo Bias
Intermarket Correlation
Fundamental + Technical Confirmation
📌 You can dig deeper — but trust me, this setup’s been scouted like a pro job.
⚠️ Risk Protocols:
Avoid entries during high-impact news
Use Trailing SLs to lock in the loot
Adjust position size to suit your personal bankroll & risk appetite
🔥 Final Word from the Thief:
Smash that 💥Boost Button💥 if you're vibing with the heist plan!
Support the squad, stay profitable, and rob the market — legally, of course.
We don’t trade, we infiltrate.
We don’t predict, we execute.
📡 Stay tuned… More robbery blueprints coming soon!
🤑🐱👤🚨💸💪 #ThiefTrader #ForexHeist #EURNZDShortPlan
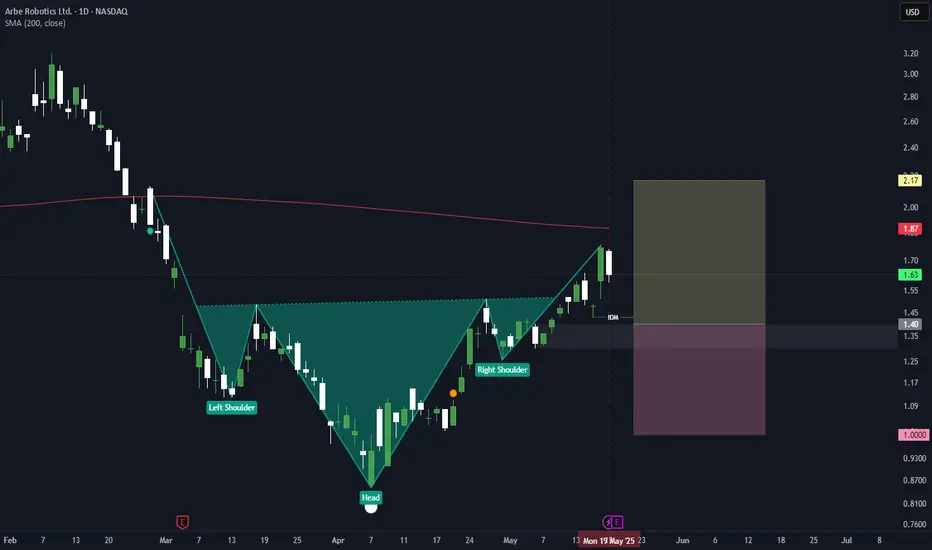
Head and ShouldersBullish move with breakout of neckline, it may have retested the neckline or will test again.
but now or wait for entry confirmation at shown level.
Not a financial advice.
Share your thoughts with me
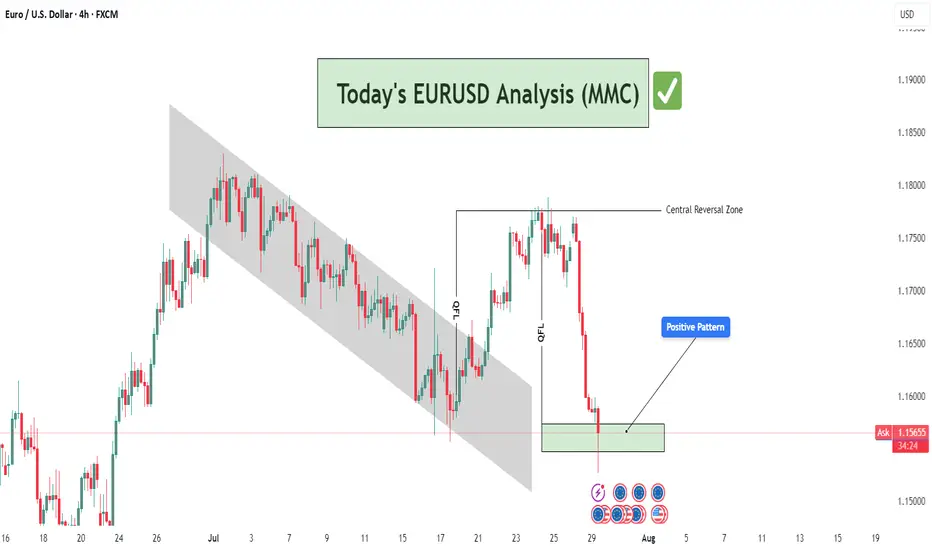
EURUSD Analysis : Rejection at Demand – Institutional Buy Setup🔍 Technical Storyline – What the Chart Tells Us:
🔸 1. Previous Bearish Structure – Descending Channel:
Price has been moving within a well-respected bearish channel, signifying structured sell-side liquidity control.
This channel served as a trap zone, where retail sellers were induced while institutions accumulated buy-side positions below the range.
The controlled movement inside the channel ended with a breakout to the upside, signaling a disruption in bearish control.
🔸 2. QFL Zone Formation – Manipulation & Liquidity Grab:
QFL (Quasimodo Failure Level) is evident in two phases here:
The first QFL acts as a reaction point where the market dropped to test demand and rallied aggressively.
The second QFL near the highs shows price swept previous liquidity before dumping, hinting at institutional profit-taking and possible redistribution into discount areas.
🔸 3. Central Reversal Zone (CRZ):
Price reversed sharply from this CRZ, which acted as a major supply level. The CRZ marks the top of the manipulation range.
This was a liquidity sweep targeting trapped long positions that entered too late at the highs.
🔸 4. Demand Revisit + Positive Rejection Pattern (Current Phase):
Price has now reached the MMC-validated demand zone, which previously launched a strong bullish move.
The long lower wick in the latest candle shows buyer absorption, suggesting early signs of a Positive Reversal Pattern.
This area is marked with high probability for bullish continuation, as it aligns with both technical support and smart money logic.
💡 Trading Plan & Market Mindset:
🔸 📈 Bullish Scenario (High-Probability Play):
Wait for bullish confirmation, such as:
Bullish engulfing on 1H/4H
Break of minor intraday structure (e.g., break of internal LH)
Strong volume surge from the zone
Entry zone: Within the demand block – 1.15500 to 1.15750
Stop-loss: Just below the demand zone (1.15250)
Target 1 (TP1): 1.16500 – minor intraday resistance
Target 2 (TP2): 1.17500–1.18000 – retest of QFL high and Central Reversal Zone
🔸 ❌ Bearish Invalidator:
A 4H candle close below 1.15250 would break the demand zone structure.
Invalidation of MMC reversal – move toward deeper liquidity (1.14500–1.14800)
🧠 Trader’s Psychology & Institutional Mindset:
Institutions often induce price spikes to trap both buyers and sellers.
This entire structure reflects classic accumulation → manipulation → distribution → reaccumulation.
The retest of the original demand zone allows institutions to re-enter at discount before pushing price back toward the highs.
“In MMC, patterns are not just shapes – they are footprints of institutional intent.”
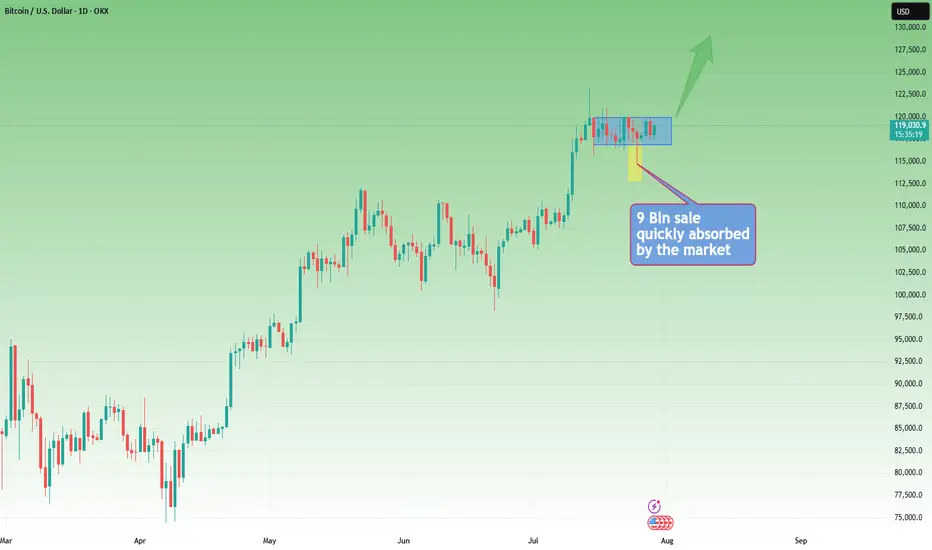
Rectangle Consolidation + Bull Trend = BTC Setup for ATHYesterday, Bitcoin dipped and recovered again, following last week's sharp spike down, triggered by the $9B Galaxy Digital sale on behalf of a Satoshi-era investor.
________________________________________
🧠 Why is this important?
Despite being one of the largest BTC sales in history, the move only caused a temporary spike down.
That’s a clear sign of market strength and strong interest on dips.
________________________________________
📉📈 Current Technical Context:
• If we ignore the spike, price is consolidating in a tight rectangle
• That’s typically a continuation pattern
• The broader trend remains strongly bullish
📌 Put all of that together, and we have at least 3 reasons to expect upside continuation
________________________________________
🎯 Key Levels:
• Break + daily close above $120K → likely leads to a new ATH and a potential test of $130K
• Invalidation only comes with a break below $114K
________________________________________
Conclusion:
BTC just absorbed a massive $9B sell without blinking.
As long as $114K holds, I'm bullish and expecting continuation.
Next leg could (and I hope it will) be explosive. 🚀
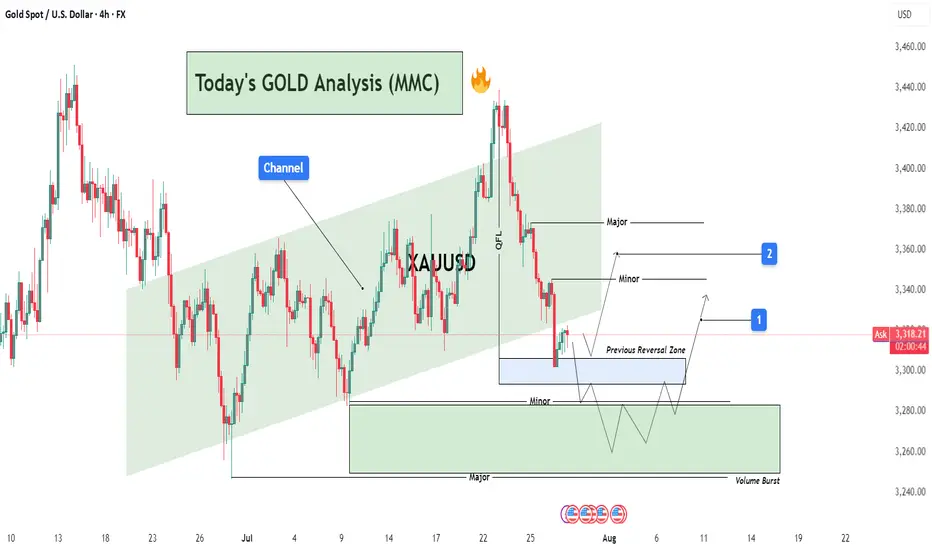
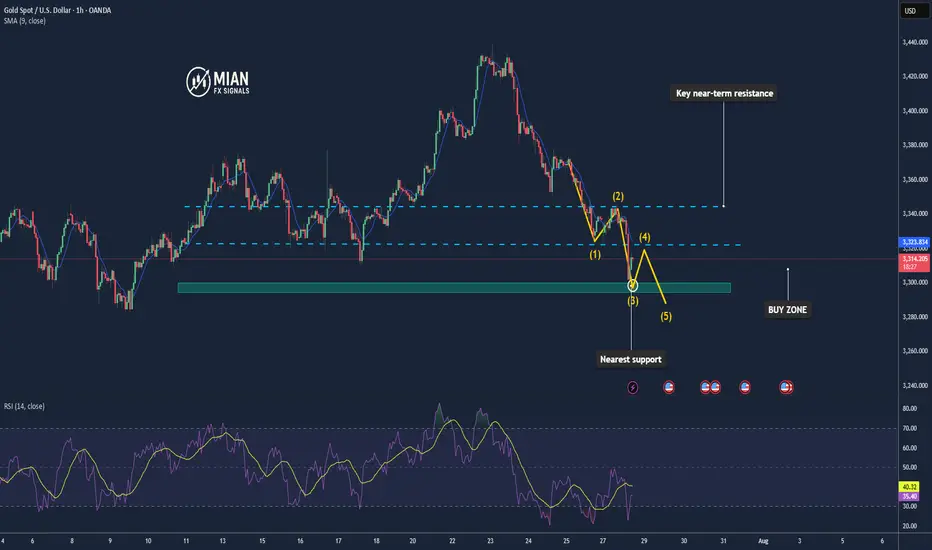
GOLD Analysis : XAUUSD Major Bullish Demand Zone🧠 Market Structure Context (MMC Framework)
Gold has recently shown a clean structural decline from its local highs within a well-defined ascending channel. This analysis highlights a reaction zone-based playbook, focusing on high-probability reversal scenarios guided by institutional footprints, volume reaction points, and MMC logic.
We’re currently trading near a previous reversal zone, where history tells us the market tends to shift behavior. Let’s dissect the key components.
📊 Key Technical Components
🔸 1. Ascending Channel Breakdown
The entire uptrend was respecting a well-established bullish channel until the recent drop violated the midline structure. This breakdown confirms a temporary bearish phase, with price breaking cleanly below a QFL base (Quick Flip Level)—a level where price reversed sharply before, which now acts as a major supply zone.
Psychological Insight: Channels give clues about momentum. Breaking below the lower band shows the market is preparing for a retest or a deeper liquidity hunt.
QFL Breakdown: Once broken, previous buyer confidence is shaken—inviting sellers to test demand zones.
🔸 2. Previous Reversal Zone (PRZ) Reaction
Currently, price is hovering inside the blue shaded Previous Reversal Zone, where bullish pressure previously kicked in. It’s a minor demand zone, but critical due to historical reaction. The projected structure shows a bounce from this area before deciding next direction.
MMC Insight: The first test of PRZ often leads to an initial reaction. But deeper liquidity lies just below in the major green demand zone.
🔸 3. Major Demand Zone + Volume Burst Area (The Real Magnet)
Below the PRZ lies the major reversal block—highlighted in green. This zone is significant because:
It aligns with a high-volume burst in the past, confirming institutional orders.
It's a cleaner structure level for smart money re-entry.
It also provides room for the “liquidity sweep” (stop hunt), collecting sell stops before a proper reversal.
💡 Expected Play: Price may fake out below PRZ, enter the major demand, and then initiate a multiple-leg bullish rally. Patience is key here.
🛠️ Trade Structure Outlook
✅ Scenario 1 – Aggressive Buyers (Marked "1"):
Buy from the current PRZ zone around $3,305–$3,315
Target: $3,340 (Minor Resistance)
Risk: Slippage into deeper demand zone
Stop-loss: Below $3,295
✅ Scenario 2 – Safer Entry from Major Demand (Marked "2"):
Let price dip into $3,270–$3,280 zone (green box)
Look for reversal candles or liquidity sweeps on lower timeframes
TP1: $3,330
TP2: $3,365 (Major Resistance)
📈 Resistance Levels to Watch:
Minor Resistance: $3,340 – Expect short-term pullbacks or hesitation.
Major Resistance: $3,365 – Key target for swing traders and potential reversal zone.
🔍 MMC Concepts in Action
✅ Channel Logic: Breakdown implies momentum shift—watch for retests.
✅ QFL: Previous bounce zone broken = supply now overhead.
✅ Volume Burst Zone: Strong historical reaction = institutional interest.
✅ Zone-to-Zone Trading: Instead of random entries, focus on logical zone interactions.
🧭 Conclusion – Path of Probability
Gold is currently in a transitional phase—shifting from bearish correction to potential bullish revival. Patience will reward those who wait for PRZ rejections or deeper liquidity taps. The MMC framework helps frame this market not as chaos, but a map of strategic reaction points.
Qualcomm: Beyond the Smartphone Storm?Qualcomm (NASDAQ:QCOM) navigates a dynamic landscape, demonstrating resilience despite smartphone market headwinds and geopolitical complexities. Bernstein SocGen Group recently reaffirmed its "Outperform" rating, setting a \$185.00 price target. This confidence stems from Qualcomm's robust financials, including a 16% revenue growth over the last year and strong liquidity. While concerns persist regarding potential Section 232 tariffs and Apple's diminishing contribution, the company's strategic diversification into high-growth "adjacency" markets like automotive and IoT promises significant value. Qualcomm currently trades at a substantial discount compared to the S&P 500 and the Philadelphia Semiconductor Index (SOX), signaling an attractive entry point for discerning investors.
Qualcomm's technological prowess underpins its long-term growth narrative, extending far beyond its core wireless chipmaking. The company aggressively pushes **on-device AI**, leveraging its Qualcomm AI Engine to enable power-efficient, private, and low-latency AI applications across various devices. Its Snapdragon platforms power advanced features in smartphones, PCs, and the burgeoning **automotive sector** with the Snapdragon Digital Chassis. Further expanding its reach, Qualcomm's recent acquisition of Alphawave IP Group PLC targets the data center market, enhancing its AI capabilities and high-speed connectivity solutions. These strategic moves position Qualcomm at the forefront of the **high-tech revolution**, capitalizing on the pervasive demand for intelligent and connected experiences.
The company's extensive **patent portfolio**, encompassing over 160,000 patents, forms a critical competitive moat. Qualcomm's lucrative Standard Essential Patent (SEP) licensing program generates substantial revenue and solidifies its influence across global wireless standards, from 3G to 5G and beyond. This intellectual property leadership, combined with a calculated pivot away from its historical reliance on a single major customer like Apple, empowers Qualcomm to pursue new revenue streams. By aiming for a 50/50 split between mobile and non-mobile revenues by 2029, Qualcomm strategically mitigates market risks and secures its position as a diversified technology powerhouse. This assertive expansion, alongside its commitment to dividends, underscores a confident long-term outlook for the semiconductor giant.

US05Y Bullish ideaWe can see we had rejection after taking out our sell side liquidity and balancing our daily fair value gap. We are still showing strength in the bond market as well with the dollar index. Our DOL is to the upside in the form of buyside liquidity and our daily volume imbalance at 4.073%.
* Fundamentals: We are having a rise in inflation and a stronger interest rate of the dollar against most of the major basket currency pairs, which in the longer term should potentially see us get a stronger dollar and an increase in our bond yields.

BTCUSD Analysis (MMC) – Breakout Confirmed + Target Next Zone⚙️ Chart Context (4H BTC/USD)
As part of our Mirror Market Concepts (MMC) strategy, today's BTCUSD 4H chart is a textbook representation of market structure shift, SR interchange, demand reaction, and target projection. After consolidating within a compressed range under a key descending structure, Bitcoin has successfully broken out of bearish control, signaling a fresh phase of bullish momentum.
🧩 Breakdown of Technical Structure
🔹 1. Demand Zone Reaction (July 13–14)
The initial impulse move originated from a well-defined demand zone, marked by a strong accumulation and breakout. This zone—highlighted on the chart—acted as the institutional demand base, where buyers stepped in with volume and aggression. Price respected this zone precisely, confirming it as a valid MMC "Power Base."
Why this matters: Demand zones like these reflect institutional footprints. Once price reacts from such zones, they often become foundational for future bullish legs.
🔹 2. SR Interchange Zone – Structure Flip Confirmed
The descending green channel acted as dynamic resistance for several sessions. Every touch along this zone resulted in a lower high, confirming bearish order flow. However, BTC has now closed decisively above this structure, transforming this zone from supply to support—this is our classic SR Interchange concept in MMC.
Interpretation: This structure flip implies a strong change in sentiment. What was once a zone of rejection now becomes a potential support for continuation.
Expect retests of this zone before price resumes to higher reversal levels.
🔹 3. Minor and Major Resistance Zones
Above current price, two critical zones have been mapped:
Minor Resistance (~$120,000):
Acts as the first liquidity grab area. This is where early sellers may place stops or where short-term traders could book profits. MMC logic expects minor resistance to either cause a pause or a fakeout to lure in shorts.
Major Resistance / Central Reversal Zone (CRZ):
Spanning roughly $121,000 to $121,800, this is a key zone where price will likely meet decision-making. This CRZ is derived from previous structure congestion, imbalance fills, and projected Fibonacci confluence.
Next Reversal Zone (Final Target Area):
Located near $123,000, this is the outer reversal box where the bullish wave may either end, consolidate, or reverse entirely. This is the final target for swing traders or MMC practitioners looking for exhaustion.
🧭 Price Forecast Structure – Predictive Pathway
The forecast path shown on the chart illustrates a stair-step rally, with bullish impulses followed by shallow pullbacks:
First, price may pull back slightly to retest the breakout zone (green SR area).
Then a leg upward to minor resistance (~$120K).
A healthy rejection or small correction before breaking into the CRZ (~$121.2K).
Final move toward the outer reversal zone at ~$123K.
This fractal progression is a common MMC pattern seen during structure shifts—not impulsive straight-line rallies, but controlled, zone-to-zone movements.
🔍 Strategic Insights & Trade Plan
📌 Conservative Entry:
Wait for a retest of the breakout zone (SR Interchange) around $118,200–$118,500.
Look for bullish rejection candles or order flow confirmation on LTF (lower timeframes).
📌 Aggressive Entry:
Break and close above $120,000, confirming liquidity clearance and path toward CRZ.
🎯 Target Zones:
TP1: $121,200 – Central Reversal Zone
TP2: $123,000 – Outer Reversal Zone
❌ Stop-Loss Ideas:
Below $117,000 (structure invalidation)
Below recent bullish impulse candle low
🧠 MMC Concepts in Action:
SR Flip: Strong indication of market shift
Demand Rejection: Institutional footprint detected
Zone Mapping: Controlled zone-to-zone movement
Liquidity Logic: Price moves where orders rest – CRZ = likely reaction
Reversal Framing: Structure analysis ahead of time, not after the move
📊 Conclusion:
This BTCUSD 4H analysis showcases a strong MMC-style breakout scenario. The reaction from demand, shift in SR structure, and projected reversal zones give us a clean roadmap. As long as the structure remains valid and price respects the new SR zone, this bullish move remains high-probability.
Trade with structure. Trust the zones. Mirror the Market.

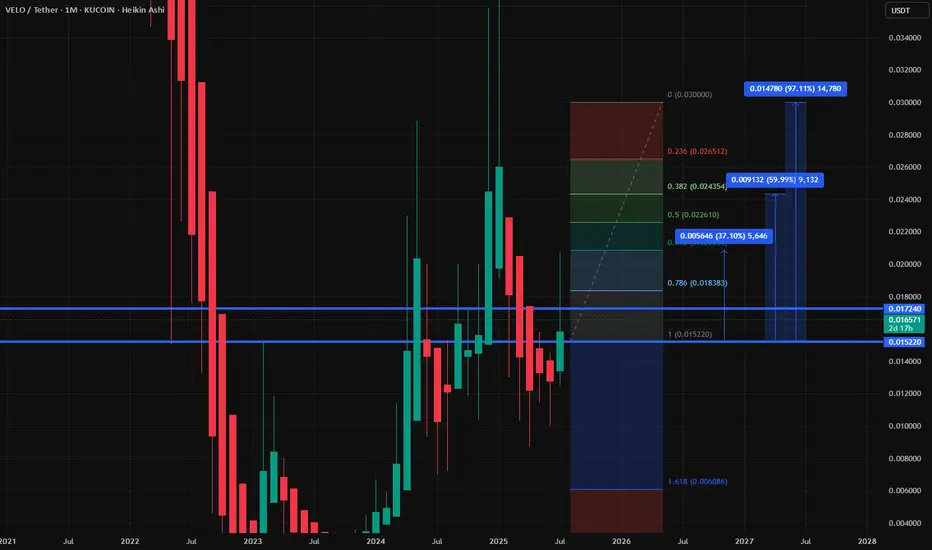
This is what I see this asset reaching at Macro level time frameNFA, please invest only what you can afford to lose and always use 1-3% stop loss as a rule! This trade can always go sideways. I will be buying some positions in spot soon...
XMRUSD - Monero And It's Warning-LinesToday we’re analyzing Monero, with a focus on a new aspect of Median Lines — the Warning Lines, or WL for short.
Warning Lines are simply extensions of the distance between the Center Line (CL) and one of the Median Line’s outer boundaries, either the Upper Median Line Parallel (U-MLH) or the Lower Median Line Parallel (L-MLH).
So why are they important for us in our trading?
As you can see, WL1 and WL2 mark important price levels. WL2 is where price reversed, while WL1 acts as resistance.
Just like with the standard lines, our full trading rule set applies to Warning Lines too. This includes scenarios like a Hagopian, a breakout or "Zoom Through," and the Test and Re-Test.
Now, looking at the current analysis:
The price was rejected at WL1 after falling from WL2. This shows strong resistance at WL1, and now the price is heading toward the U-MLH.
If the price breaks below the U-MLH and starts opening and closing within the Fork again, there’s a strong chance it will move back toward the Center Line in the near future.
That could be your signal to take more profits, close the position, or possibly even short Monero.
Personally, I find it difficult to short crypto due to the high risk of manipulation by whales in the market. I prefer not to get caught in a short position if the price suddenly gaps to the upside. So I probably look to take a new position or add to an existing one, since it is a fair level where price found it's center.
That’s it for today.
Did you learn something new?
Great. See you next time, and trade safe.

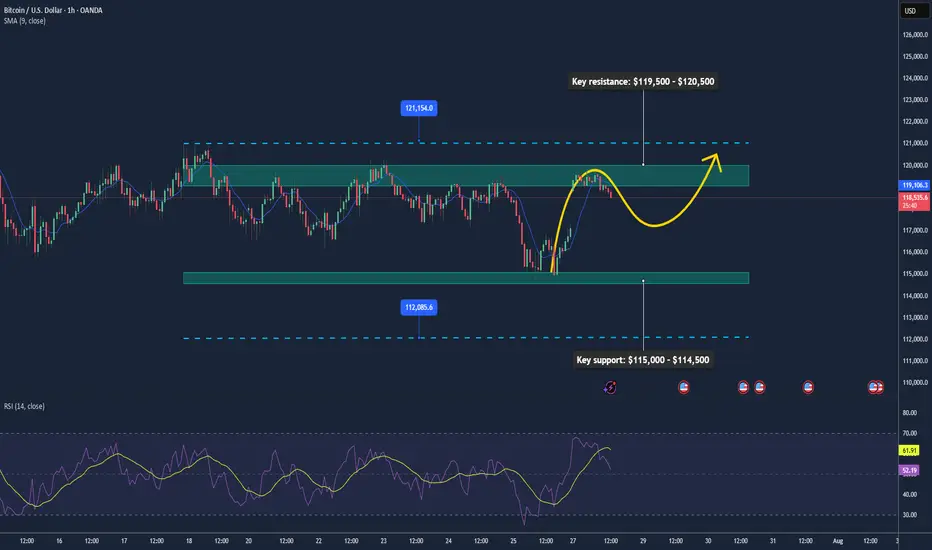
BTC May Extend Rally as ETF Flows & Policy Support Push Higher📊 Market Overview:
• Bitcoin trades around $118,660, rebounding from lows near $114,500 earlier this week after a sharp decline. Strong inflows into BTC and ETH ETFs are bolstering market sentiment
• Regulatory clarity via the Genius Act, Clarity Act, along with the U.S. Strategic Bitcoin Reserve, is fueling institutional interest
• High-profile corporate Bitcoin purchases, such as by Trump Media, underscore growing adoption and bullish sentiment in crypto treasuries ________________________________________
📉 Technical Analysis:
• Key resistance: $119,500 – $120,500
• Key support: $115,000 – $114,500
• EMA 09 (H1): Trading above EMA09, indicating short-term bullish bias
• Candlestick / Volume / Momentum:
• BTC is consolidating within a range of $115K–$119K, prepping for potential breakout
• Indicators like RSI and MACD show positive momentum
• At 1-hour chart, a double bottom around $118,950 signals buyer strength near dips
________________________________________
📌 Outlook:
Bitcoin is likely to continue rising in the short term, particularly on a push through $119,500–$120,500. ETF inflows and regulatory tailwinds remain supportive. However, a breakdown below $115,000 may indicate short-term bearish risk toward $112,000.
________________________________________
💡 Trade Setup
🟢 BUY BTC/USD: $115,500 – $116,500
🎯 TP: $119,200 → $120,000
❌ SL: $115,000
🔴 SELL BTC/USD: $120,500 – $121,000
🎯 TP: $119,000 → $118,000
❌ SL: $121,500
Risk Management in Options TradingTrading options can be exciting and rewarding—but it's also full of risks. Without proper risk management, even the best strategies can lead to heavy losses. In this comprehensive guide, we'll dive deep into how to manage risk in options trading, covering everything from the basics to advanced techniques.
1. Understanding Risk in Options Trading
Before we dive into managing risk, it’s crucial to understand where risk comes from in options trading. Options are complex instruments that behave differently than stocks. The key sources of risk include:
A. Price Movement (Delta Risk)
When the price of the underlying stock moves up or down, the value of the option changes. This is known as Delta risk. A call option gains value when the stock goes up, and a put gains value when it goes down.
B. Time Decay (Theta Risk)
Options lose value over time. Even if the stock price doesn’t move, the option could still lose value as the expiration date approaches. This is known as Theta decay or time decay.
C. Volatility (Vega Risk)
Volatility reflects how much a stock moves. High volatility increases an option's premium. But if implied volatility falls, the value of your option might drop—even if your price prediction is correct.
D. Interest Rates and Dividends (Rho and Dividend Risk)
Although less impactful, interest rates and dividend changes can also influence option prices. These are more important for longer-dated options.
2. Why Is Risk Management Critical in Options?
Options give traders leverage—a small investment can control a large position. While this magnifies profits, it also increases losses. Many beginners fall into the trap of chasing big gains, only to blow up their accounts when trades go wrong.
Good risk management doesn’t eliminate risk—it helps you survive bad trades and stay in the game long enough for your edge to work.
3. Core Principles of Options Risk Management
Here are the foundational principles every options trader should follow:
A. Never Risk More Than You Can Afford to Lose
It sounds obvious, but many traders ignore this. Only use disposable capital, not money meant for rent, bills, or emergencies.
B. Position Sizing
This is one of the most powerful tools in risk management. Don’t bet your entire capital on a single trade. A common rule is to risk 1-2% of your capital on any trade. That way, even a string of losing trades won’t wipe you out.
C. Diversify Your Trades
Avoid putting all your trades on the same stock or sector. Diversification can reduce risk from unexpected news events or market shocks.
D. Know Your Maximum Loss
Before entering any trade, calculate your maximum potential loss. With long calls and puts, your loss is limited to the premium paid. But with short options or complex strategies like spreads, losses can be higher or even unlimited.
4. Practical Risk Management Techniques
A. Use Stop-Loss Orders (Where Applicable)
While options don’t always behave like stocks, you can still set a mental or physical stop-loss based on:
Percentage loss (e.g., exit if the option loses 50%)
Underlying price level (e.g., exit if stock breaks below a key level)
Time decay (e.g., exit 5 days before expiration to avoid Theta crush)
❗ Note: Stop-losses can be tricky with options because of wide bid-ask spreads. It’s important to use limit orders or mental stops to avoid slippage.
B. Avoid Naked Options (Especially Selling)
Selling naked calls or puts can expose you to unlimited risk. Unless you have a large account and full understanding, stick to defined-risk strategies like:
Spreads (credit/debit)
Iron condors
Butterflies
Covered calls
Protective puts
C. Hedge Your Positions
Hedging is like buying insurance. You can reduce risk by combining options in a way that limits losses.
Example:
If you sell a naked put, you can turn it into a bull put spread by buying a lower strike put. This limits your downside if the stock crashes.
D. Use Probability and Greeks
Understanding the "Greeks" can help you analyze risk exposure:
Greek What it Measures Risk Managed
Delta Price sensitivity Directional risk
Theta Time decay Time-related loss
Vega Volatility impact Volatility exposure
Gamma Delta’s change rate Acceleration of price impact
Rho Interest rate impact (minor risk)
Knowing your Greeks allows you to adjust trades when risks become too high.
5. Options Strategies for Risk Management
Some strategies are naturally more “risky,” while others are designed to limit downside. Let’s look at popular risk-managed strategies:
A. Covered Call
You own 100 shares of a stock and sell a call option. This gives you income (premium) and limits upside risk.
Risk: Stock falls
Reward: Premium + upside to strike price
B. Protective Put
You buy a put while holding the stock. It protects you from downside losses, like insurance.
Risk: Cost of put (premium)
Reward: Unlimited upside; limited downside
C. Vertical Spreads (Credit and Debit)
These involve buying and selling options at different strikes.
Bull Call Spread: Buy call + sell higher call
Bear Put Spread: Buy put + sell lower put
Both strategies have limited risk and reward, making them ideal for risk-conscious traders.
D. Iron Condor
You sell a call spread and a put spread on the same stock. Profitable when the stock stays in a defined range.
Risk: Limited to width of spread minus premium
Reward: Net credit received
This is a great strategy for sideways markets and offers good risk/reward if managed well.
6. Managing Risk Over Time
A. Adjusting Trades
If a trade moves against you, you don’t always have to take the loss. You can:
Roll the option to a later expiration
Adjust strikes to collect more credit or redefine risk
Convert to a spread or different strategy
However, be careful not to over-manage trades, which can lead to complex and risky positions.
B. Avoid Trading Around Events
Earnings announcements, Fed meetings, and budget declarations can cause huge volatility spikes. Option premiums are often inflated before such events. If you trade them, keep position size small and use defined-risk trades only.
Gold Tests Key Support Near $3,300Gold held near $3,315 an ounce after a 0.7% drop, as investors awaited the Fed's rate decision, key US economic data, and developments in trade talks. A stronger dollar pressured the bullion, while the market remains on edge ahead of Trump's Aug. 1 tariff deadline. A possible 90-day extension in the US-China trade truce and upcoming jobs and inflation figures could drive volatility. Although gold is up over 25% this year due to geopolitical risks and trade uncertainty, prices have been rangebound since peaking above $3,500 in April.
From a technical point of view, the price of gold is currently testing the support level of the 100-day simple moving average just above the psychological level of $3,300. Even though the Bollinger bands are contracted, they started expanding slightly recently, showing volatility might be picking up, while the moving averages are validating the overall bullish trend in the market. The Stochastic oscillator is in the extreme oversold level, hinting that a bullish resumption of the trend might be seen in the upcoming sessions. Overall, the majority of the technical indicators are hinting at a bullish image in the near short term, so probably it might be a good idea to watch out for any candlestick formations this week that might give you the entry for a long position.
Disclaimer: The opinions in this article are personal to the writer and do not reflect those of Exness

Gold Recovers After Sharp Drop – Trend Not Yet Reversed📊 Market Overview:
Gold rebounded from a sharp fall earlier in the session, rising from $3301 to around $3315 as the U.S. dollar weakened slightly and sellers took partial profit. However, no strong fundamental catalyst confirms a trend reversal yet.
________________________________________
📉 Technical Analysis:
• Key Resistance: $3315 – $3322
• Nearest Support: $3300 – $3295
• EMA 09 (H1): Price is currently just below EMA09, indicating a slight bearish bias
• Candlestick / Volume / Momentum:
• H1 candle shows a long lower wick at $3301 → some buying interest
• No H1 candle has closed above $3315 yet → no confirmed reversal
• Volume remains weak, RSI still under 50 → limited bullish momentum
________________________________________
📌 Outlook:
Gold may continue to consolidate between $3300 and $3315 in the short term. If it fails to close above $3315, bearish pressure could return toward $3295–$3288.
________________________________________
💡 Suggested Trade Setups:
🔻 SELL XAU/USD: $3315 – $3318
🎯 TP: 40/80/200 pips
❌ SL: $3323
🔺 BUY XAU/USD: $3295 – $3300
🎯 TP: 40/80/200 pips
❌ SL: $3285
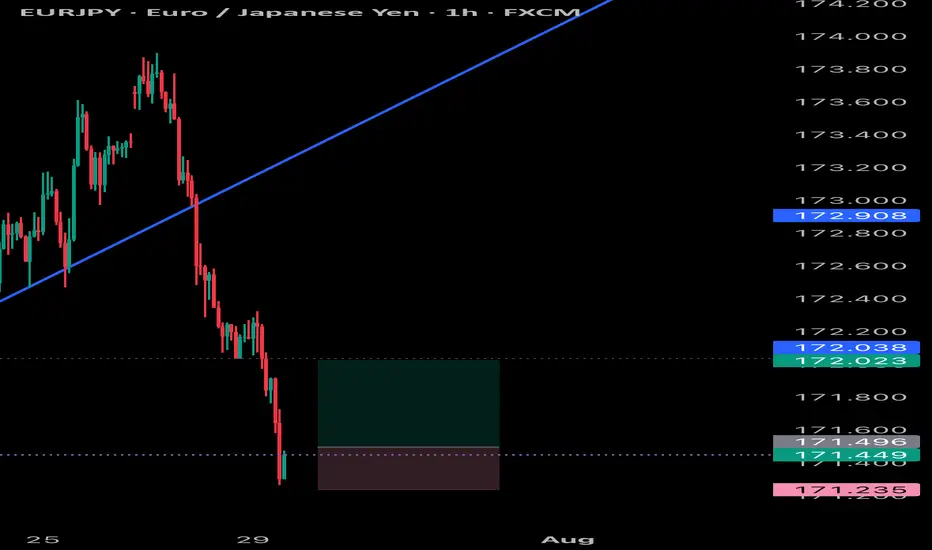
EURJPY SCALP Eurjpy quick scalp trade as it can still drop so it would be wise to not target higher than normal take profits , but will scalp it
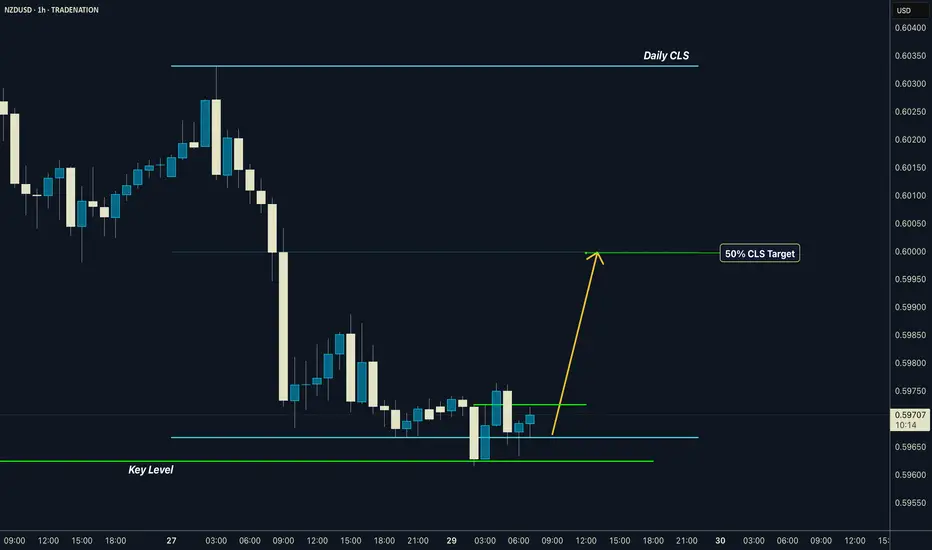
NZDUSD | Daily CLS I Model 1 I 50% CLS TargetHey, Market Warriors ⚔️
Fresh outlook drop — if you’ve been riding with me, you already know:
🎯My system is 100% mechanical. No emotions. No trend lines. No subjective guessing. Just precision, structure, and sniper entries.
🧠 What’s CLS?
It’s the real smart money. The invisible hand behind $7T/day — banks, algos, central players.
📍Model 1:
HTF bias based on the daily and weekly candles closes,
Wait for CLS candle to be created and manipulated. Switch to correct LTF and spot CIOD. Enter and target 50% of the CLS candle.
For high probability include Dealing Ranges, Weekly Profiles and CLS Timing.
Analysis done on the Tradenation Charts
Disclosure: I am part of Trade Nation's Influencer program and receive a monthly fee for using their TradingView charts in my analysis.
Trading is like a sport. If you consistently practice you can learn it.
“Adapt what is useful. Reject whats useless and add whats is specifically yours.”
David Perk aka Dave FX Hunter
💬 Don't hesitate to ask any questions or share your opinions
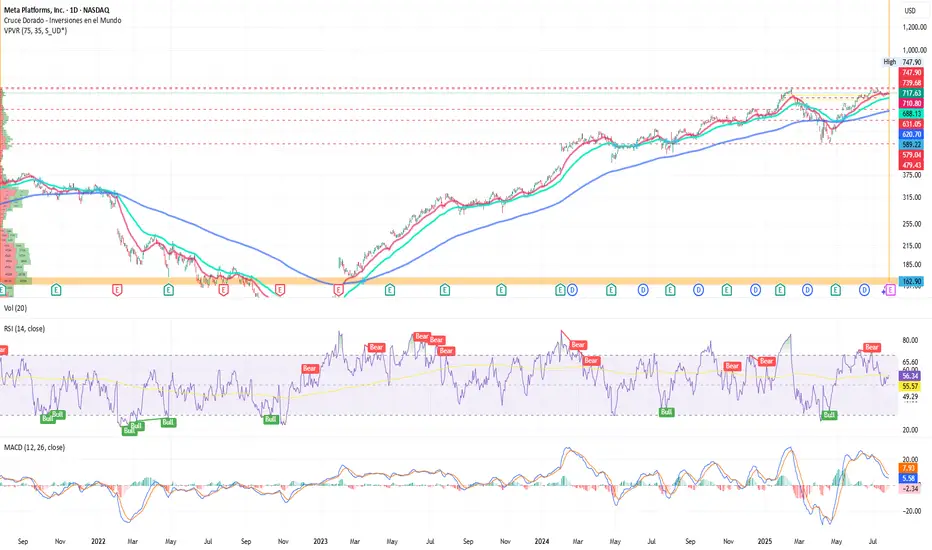
Meta surprises to the upside & strengthens its leadership in AIBy Ion Jauregui – Analyst at ActivTrades
Meta Platforms (TICKER AT: META.US) has posted strong quarterly results that significantly exceeded market expectations, driven by its solid positioning in artificial intelligence, advertising monetization, and the resilience of its digital ecosystem.
Key Financial Highlights
In the second quarter of 2025, Meta reported revenues of $38.72 billion, representing a 15% year-over-year increase, beating consensus estimates by over $1 billion. Net profit reached $13.46 billion, with an adjusted EPS of $5.22, reflecting strong operating leverage.
The advertising segment remains the main growth driver, but revenue gains from generative AI services and enterprise solutions powered by Meta AI and Llama 3, its proprietary language model, were also noteworthy. Meanwhile, Reality Labs, although still operating at a loss, managed to contain its deficits and improve efficiency, while preparing for upcoming product launches linked to the metaverse.
The company maintains a robust cash position with over $58 billion in liquidity, and announced a new $25 billion share buyback program, reinforcing its commitment to shareholder value creation.
Fundamental Analysis
Meta is solidifying its strategic transition into a tech conglomerate focused on AI, personalized advertising, and immersive environments. Despite ongoing regulatory challenges in the U.S. and Europe—having yielded this time to Brussels—the company has maintained strong growth in daily active users (DAUs) and monthly active users (MAUs) across its core platforms: Facebook, Instagram, and WhatsApp.
Consistent investment in AI infrastructure and data centers, coupled with an improved operating margin now at 39%, positions Meta among the most efficient players in the tech sector.
Technical Analysis
From a technical standpoint, Meta is currently trading around $717, following a near 50% rally since April. The daily chart shows a clear uptrend with higher lows in place since November 2022.
The RSI stands at approximately 56.34%, indicating strength without entering overbought territory.
The 50-, 100-, and 200-day moving averages remain aligned in a bullish formation.
The next resistance level is at the all-time high of $747.90; a breakout could pave the way toward $800 in the short term.
The key support level lies at $689, where the 100-day moving average and recent price action converge.
The Point of Control (POC) sits around $590, marking the base of the previous upward move and the recent golden cross that triggered the current rally.
Conclusion
Meta continues to affirm its leadership in the tech sector—not just as a social media powerhouse, but as a key player in the development and implementation of AI-based solutions. Revenue diversification, cost control, and a solid financial structure reinforce its position in an increasingly competitive market. While macroeconomic volatility and regulatory pressures remain, the combination of technical momentum and strong fundamentals suggests the bullish trend could continue.
*******************************************************************************************
La información facilitada no constituye un análisis de inversiones. El material no se ha elaborado de conformidad con los requisitos legales destinados a promover la independencia de los informes de inversiones y, como tal, debe considerarse una comunicación comercial.
Toda la información ha sido preparada por ActivTrades ("AT"). La información no contiene un registro de los precios de AT, o una oferta o solicitud de una transacción en cualquier instrumento financiero. Ninguna representación o garantía se da en cuanto a la exactitud o integridad de esta información.
Cualquier material proporcionado no tiene en cuenta el objetivo específico de inversión y la situación financiera de cualquier persona que pueda recibirlo. La rentabilidad pasada y las estimaciones no sinónimo ni un indicador fiable de la rentabilidad futura. AT presta un servicio exclusivamente de ejecución. En consecuencia, toda persona que actúe sobre la base de la información facilitada lo hace por su cuenta y riesgo. Los tipos de interés pueden cambiar. El riesgo político es impredecible. Las acciones de los bancos centrales pueden variar. Las herramientas de las plataformas no garantizan el éxito.