CAN SILVER RETURN TO ITS HISTORIC HIGH OF $50?In the world of precious metals, gold has already broken its all-time high in recent months, supported by solid fundamentals. Another precious metal is now catching up: silver. Unlike platinum and palladium, silver today combines all the necessary ingredients to revisit its historic peak. Its bullish potential stems from a unique blend of market volume, correlation with gold, supportive fundamentals, and favorable technical conditions. Silver isn’t just "gold’s little brother": it is currently the only precious metal with both the technical and structural setup to aim once again for the mythical $50 mark, last reached in 2011.
1) After GOLD, silver is the most liquid precious metal and has the highest positive correlation
The first key factor is liquidity. On the precious metals market, gold remains the clear leader, with hundreds of billions of dollars traded daily. Silver comes second, far ahead of platinum and palladium, with around $5 billion in daily volume. This level of activity is crucial—adequate liquidity allows speculative and institutional flows to fully express themselves. Conversely, the low volumes of platinum and palladium limit their upside, as their markets are too narrow to support the kind of momentum seen in gold or silver.
The second strength of silver lies in its natural correlation with gold. Historically, the two metals move in sync. This behavioral alignment is reflected in a correlation coefficient close to 1. Platinum and palladium, by contrast, respond to industrial demand, particularly from the auto sector and emissions technology. Silver, however, blends industrial uses (jewelry, electronics, solar panels, etc.) with a monetary and financial role similar to gold. This dual nature makes silver a hybrid asset, with both ETF-driven financial demand and jewelry-like industrial demand.
2) Technically, the SILVER/GOLD ratio remains in a short-term uptrend from a long-term support
Technical analysis reinforces this fundamental outlook. While gold appears to be losing steam after hitting $3,500, silver still shows a medium-term bullish setup—even though short-term corrections are always possible. The gold/silver ratio, historically useful to detect when silver outperforms gold, also suggests that silver is poised for further gains. Silver’s long-term trend remains bullish as long as the $34–$35 support zone holds. The $50 mark is the natural technical target of this trend.
The following chart shows the gold/silver ratio and indicates that silver is likely to outperform gold through year-end:
And here is the monthly candlestick chart of spot silver:
DISCLAIMER:
This content is intended for individuals who are familiar with financial markets and instruments and is for information purposes only. The presented idea (including market commentary, market data and observations) is not a work product of any research department of Swissquote or its affiliates. This material is intended to highlight market action and does not constitute investment, legal or tax advice. If you are a retail investor or lack experience in trading complex financial products, it is advisable to seek professional advice from licensed advisor before making any financial decisions.
This content is not intended to manipulate the market or encourage any specific financial behavior.
Swissquote makes no representation or warranty as to the quality, completeness, accuracy, comprehensiveness or non-infringement of such content. The views expressed are those of the consultant and are provided for educational purposes only. Any information provided relating to a product or market should not be construed as recommending an investment strategy or transaction. Past performance is not a guarantee of future results.
Swissquote and its employees and representatives shall in no event be held liable for any damages or losses arising directly or indirectly from decisions made on the basis of this content.
The use of any third-party brands or trademarks is for information only and does not imply endorsement by Swissquote, or that the trademark owner has authorised Swissquote to promote its products or services.
Swissquote is the marketing brand for the activities of Swissquote Bank Ltd (Switzerland) regulated by FINMA, Swissquote Capital Markets Limited regulated by CySEC (Cyprus), Swissquote Bank Europe SA (Luxembourg) regulated by the CSSF, Swissquote Ltd (UK) regulated by the FCA, Swissquote Financial Services (Malta) Ltd regulated by the Malta Financial Services Authority, Swissquote MEA Ltd. (UAE) regulated by the Dubai Financial Services Authority, Swissquote Pte Ltd (Singapore) regulated by the Monetary Authority of Singapore, Swissquote Asia Limited (Hong Kong) licensed by the Hong Kong Securities and Futures Commission (SFC) and Swissquote South Africa (Pty) Ltd supervised by the FSCA.
Products and services of Swissquote are only intended for those permitted to receive them under local law.
All investments carry a degree of risk. The risk of loss in trading or holding financial instruments can be substantial. The value of financial instruments, including but not limited to stocks, bonds, cryptocurrencies, and other assets, can fluctuate both upwards and downwards. There is a significant risk of financial loss when buying, selling, holding, staking, or investing in these instruments. SQBE makes no recommendations regarding any specific investment, transaction, or the use of any particular investment strategy.
CFDs are complex instruments and come with a high risk of losing money rapidly due to leverage. The vast majority of retail client accounts suffer capital losses when trading in CFDs. You should consider whether you understand how CFDs work and whether you can afford to take the high risk of losing your money.
Digital Assets are unregulated in most countries and consumer protection rules may not apply. As highly volatile speculative investments, Digital Assets are not suitable for investors without a high-risk tolerance. Make sure you understand each Digital Asset before you trade.
Cryptocurrencies are not considered legal tender in some jurisdictions and are subject to regulatory uncertainties.
The use of Internet-based systems can involve high risks, including, but not limited to, fraud, cyber-attacks, network and communication failures, as well as identity theft and phishing attacks related to crypto-assets.
Beyond Technical Analysis

GBPUSD Week 31 Swing Zone/LevelsPEPPERSTONE:GBPUSD keeps giving and simply does.
Strategy for this week is highlighted; sell at the zone and look for buy around 33683.
Zones/Levels are calculated based previous Week X's difference High & Low (dHL)
Trade Parameters:
sl: 10-15pips
dTP: dynamic TP means because momentum can push fast past say 33683, TP is a soft target. However typically 5-10x
As always price action determines trades.

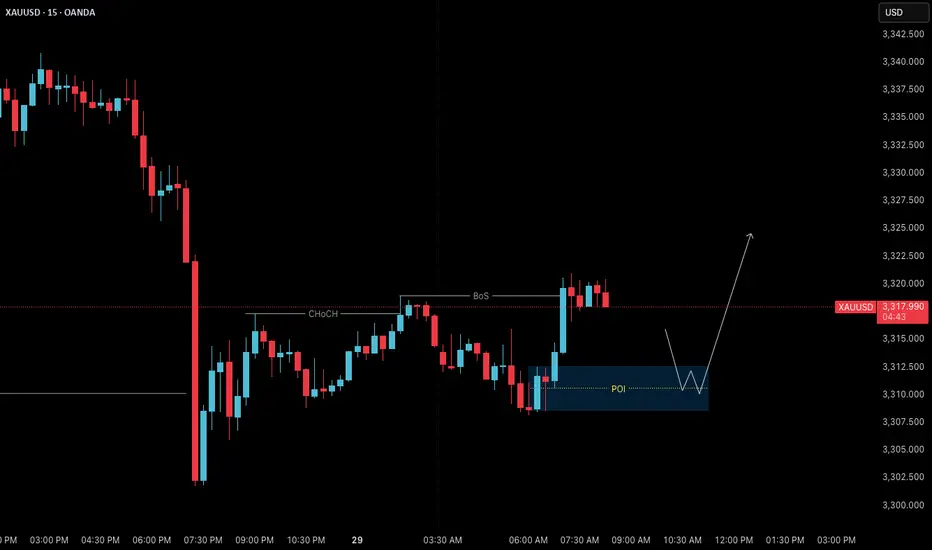
Gold 29 July – H4 Demand Holds, M15 Structure ShiftsGold (XAUUSD) Analysis – 29 July
The Mirror is Forming at 3310: Structure + Reaction in Focus
The market has successfully held the H4 demand zone, particularly near the critical level around 3310. This level is not just another number on the chart — it’s an inflection point. A possible first higher low or swing low, from which the next directional leg in gold could emerge.
Yesterday’s price action swept liquidity beneath this zone and then showed a strong bullish reaction. This isn’t just a bounce. It’s a behavioral shift — one that hints at absorption of selling pressure and the re-entry of aggressive buyers.
🔍 Structure Alignment: H4 + M15
On the H4 timeframe, price has stabilized within the demand zone.
Zooming into M15, we now see internal price action beginning to shift:
• First, a Change of Character (ChoCH) — the earliest clue that momentum is starting to turn.
• Then, a Break of Structure (BoS) to the upside — signaling potential bullish intent.
This multi-timeframe alignment — H4 support holding + M15 structure shifting — builds a strong case for a potential reversal and continuation of the uptrend.
📍 What Next?
The next step is to mark a refined M15 Point of Interest (POI) — a zone where price may pull back before making its next move upward.
We don’t chase price. We let it come to us.
✅ Look for Lower Timeframe Confirmation
Once price returns to your POI, it’s time to observe.
You’re not looking for obvious signals. You’re watching for subtle behavior —
a sharp reaction, a psychological flush, or a precise candle footprint that reveals intent.
The deeper signals aren’t always visible to the untrained eye — but they’re there for those who’ve studied the mirror.
( For those who know what to look for — this is where the sniper entry reveals itself. )
🎯 Summary
• Bias: Bullish — structure and reaction support long setups
• Plan: Wait for price to retest the M15 POI
• Execution: Only enter on confirmed lower timeframe intent and confluence
• Target: 120 pips (fixed, as per system)
• Stop Loss: 40 pips (always 1:3 R:R minimum)
📚 This is the kind of structure-based clarity we teach in The Chart is the Mirror .
Let the chart speak.
Let the structure guide you — not your emotion.
📘 Shared by @ChartIsMirror
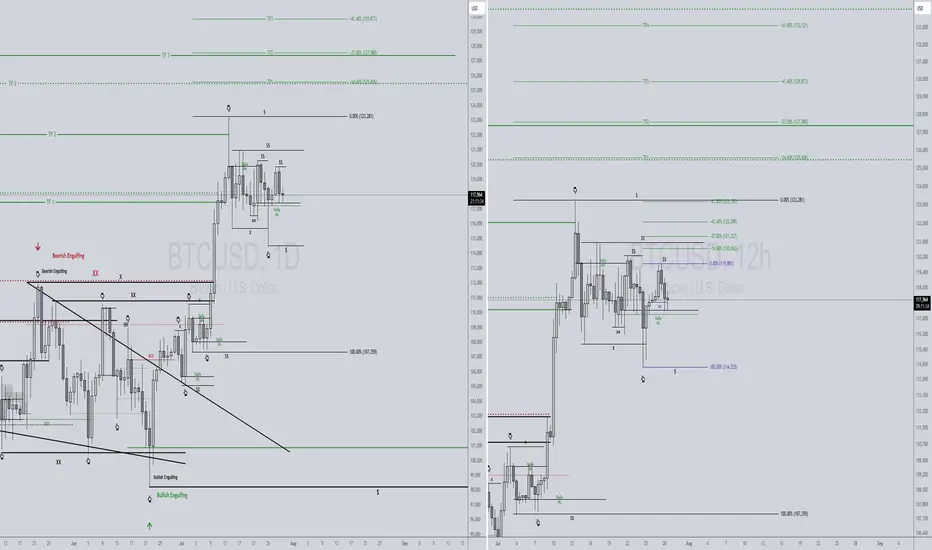
BTCUSD 7/28/2025Just so you can see what I see... We read Candles over here!
_SnipeGoat_
_TheeCandleReadingGURU_
#PriceAction #MarketStructure #TechnicalAnalysis #Bearish #Bullish #Bitcoin #Crypto #BTCUSD #Forex #NakedChartReader #ZEROindicators #PreciseLevels #ProperTiming #PerfectDirection #ScalpingTrader #IntradayTrader #DayTrader #SwingTrader #PositionalTrader #HighLevelTrader #MambaMentality #GodMode #UltraInstinct #TheeBibleStrategy
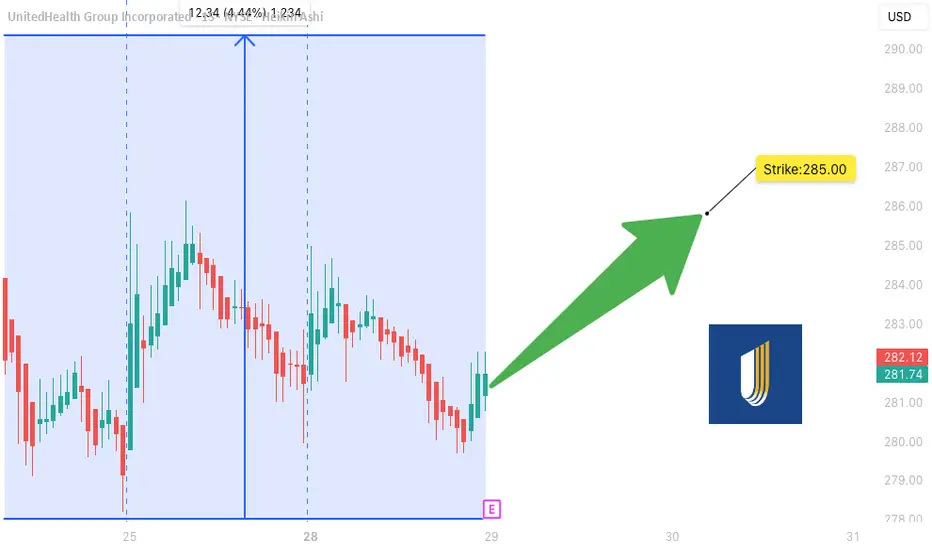
UNH Earnings Lotto Setup** (2025-07-28)
📊 **UNH Earnings Lotto Setup** (2025-07-28)
🎯 **Targeting a 2x return on post-earnings upside move**
---
### 💡 Trade Thesis:
**UnitedHealth (UNH)** is primed for a potential bounce on earnings:
* ✅ **Revenue Growth**: +9.8% YoY
* 🔥 **EPS Beat Rate**: 88% over last 8 quarters
* ⚠️ Margin compression risk from increased utilization
* 🧠 **Analyst Upgrades** trending positive
* 📉 RSI = **30.06** → Oversold territory
---
### 🔎 Options Flow & Technicals
* 🧲 Max Pain: **\$290**
* 🟢 Bullish call OI stacking at **\$285**
* ⚖️ IV Rank: **0.75** → Still has juice
* 🔻 Trading below 20D/50D MAs → Room for reversal
---
### 💰 Trade Setup
```json
{
"Instrument": "UNH",
"Direction": "Call (Long)",
"Strike": "$285",
"Entry Price": "$10.30",
"Profit Target": "$20.60 (2x)",
"Stop Loss": "$5.15 (50%)",
"Size": "1 contract",
"Expiry": "2025-08-01",
"Entry Timing": "Pre-Earnings Close (July 28)",
"Earnings Date": "2025-07-29 BMO",
"Expected Move": "±5%",
"Confidence": "70%"
}
```
---
### ⚖️ Risk/Reward
* Max Risk: 💸 \$1,030
* Max Gain: 🚀 \$1,030
* R/R Ratio: **1:2**
* Lotto-style with tight SL post-ER
---
### 🧭 Execution Plan
* 📅 Buy before close on **July 28**
* ⏰ Close same-day post ER **if target or SL hits**
* ❌ Exit manually if theta crush hits hard
---
### 🗣️ Final Note:
> “Oversold + Strong fundamentals + Positive consensus = Earnings bounce in the making.”
---
📌 Tag your UNH trades
💬 Drop your lotto setups
❤️ Like & repost if you're playing UNH this week!
\#UNH #EarningsPlay #OptionsTrading #TradingView #UNHEarnings #LottoTrade #CallOptions #HealthcareStocks #SwingTrade #RSI #IVRank #MaxPain
TLRY Earnings Play: Lotto-Style PUT Setup
📉 **TLRY Earnings Play: Lotto-Style PUT Setup**
*Tilray Brands (TLRY) - Earnings Due July 30 (AMC)*
🔻High risk. High reward. Possibly… nothing. But here's the setup:
---
### 🔬 Fundamental Breakdown:
* 💸 **TTM Revenue Growth**: -1.4% (🚩 declining)
* 📉 **Profit Margin**: -114.4%
* 🧾 **Operating Margin**: -16.8%
* 🧠 **EPS Surprise (avg 8Q)**: **-89.4%**, with only **12% beat rate**
* 🧯 **Sector Risk**: Cannabis = Over-regulated + Overcrowded
🧮 **Fundamental Score**: 2/10 → Broken business model.
---
### 📊 Technicals:
* 🔺 Above 20D MA (\$0.61) and 50D MA (\$0.49)
* 🔻 Well below 200D MA (\$0.91)
* 📉 Volume 0.72x = Weak institutional interest
* 📏 RSI: 57.69 (neutral drift)
**Technical Score**: 4/10 → Weak drift, low conviction.
---
### ⚠️ No Options Flow. No Big Bets Seen.
(But that’s exactly what makes this a clean lotto...)
---
## 🎯 Lotto Trade Idea:
```json
{
"Type": "PUT",
"Strike": "$0.70",
"Expiry": "Aug 1, 2025",
"Entry": "$0.10",
"Profit Target": "$0.50",
"Stop Loss": "$0.035",
"Confidence": "30%",
"Size": "2% portfolio max",
"Timing": "Pre-earnings close"
}
```
---
### 🧠 Strategy:
This is not a trade based on strength. It’s based on **TLRY’s consistent failure to deliver** — and if it disappoints again, we ride the downside. If not? Risk tightly capped.
---
⚖️ **Conviction**: 35%
💀 **Risk**: Total loss possible
🚀 **Reward**: 400%+ possible
---
📝 *Not financial advice — just one degenerate’s earnings notebook.*
💬 Drop your TLRY lotto plans below👇

CLS Earnings Play - Bullish Setup (07/28)
📈 **CLS Earnings Play - Bullish Setup (07/28)** 💥
💡 *Earnings Confidence: 75% | Sector: Tech/AI Hardware*
🚀 **THESIS**:
* 🔋 19.9% TTM revenue growth
* ✅ 8-quarter beat streak (avg. +11.5%)
* 📈 RSI > 50D/200D MA → Strong momentum
* 🧠 Sector tailwinds from AI/data infra
* 💬 Analysts lagging price → potential upgrades
📊 **OPTIONS FLOW**:
* 🟢 Calls piling at \$175 (institutions leaning bullish)
* 🛑 Some downside puts at \$170 (hedging only)
* 🧮 IV Rank: 0.65 | Expected Move: ±\$11
🔥 **TRADE PLAN**
> 🎯 **Buy CLS \$175 Call (08/01 Exp)**
> 💵 **Entry**: \$8.80
> 📈 **Profit Target**: \$26.40 (+200%)
> 🛑 **Stop Loss**: \$4.40
> ⏰ **Entry Timing**: *Just before earnings close* (07/30 AMC)
> 💼 **Size**: 2% of portfolio
📉 **Risk**: Moderate IV, downside if earnings miss.
📊 **Reward**: Strong beat history + AI trend = possible upside surprise.
🔔 **Watchlist it now. Execute near close 07/30.**

Gold setupGold us just broken to the downside from the previous uptrend and now we expect the prices to continue pushing towards the downside. the prices are likely to reject from the the current order block but if not, they will probably do on the smaller upper order block as you can see via the analysis

Daily Analysis- XAUUSD (Tuesday, 29th July 2025)Bias: No Bias
USD News(Red Folder):
-JOLTS Job Openings
Notes:
- Strong bearish closure
- Uncertainty on fundamentals
- Potential BUY/SELL if there's
confirmation on lower timeframe
- Pivot point: -
Disclaimer:
This analysis is from a personal point of view, always conduct on your own research before making any trading decisions as the analysis do not guarantee complete accuracy.
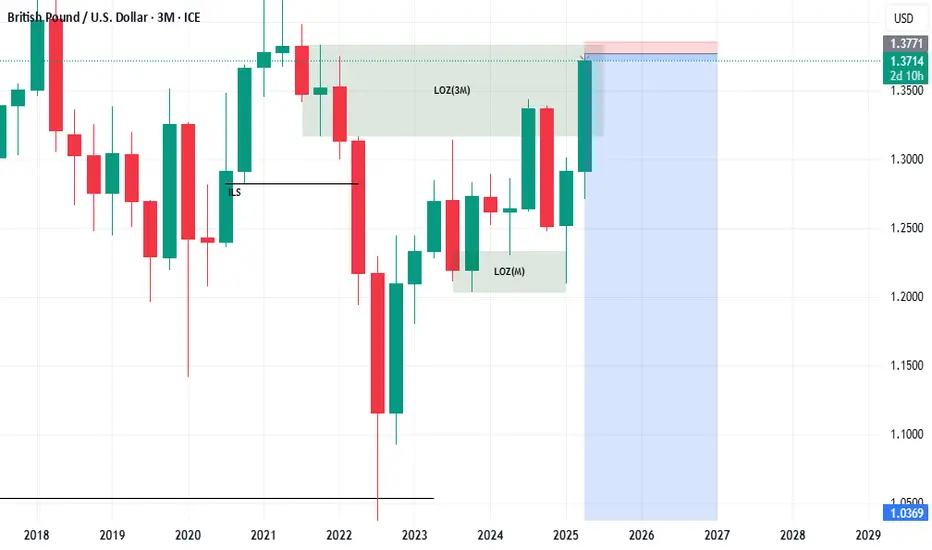
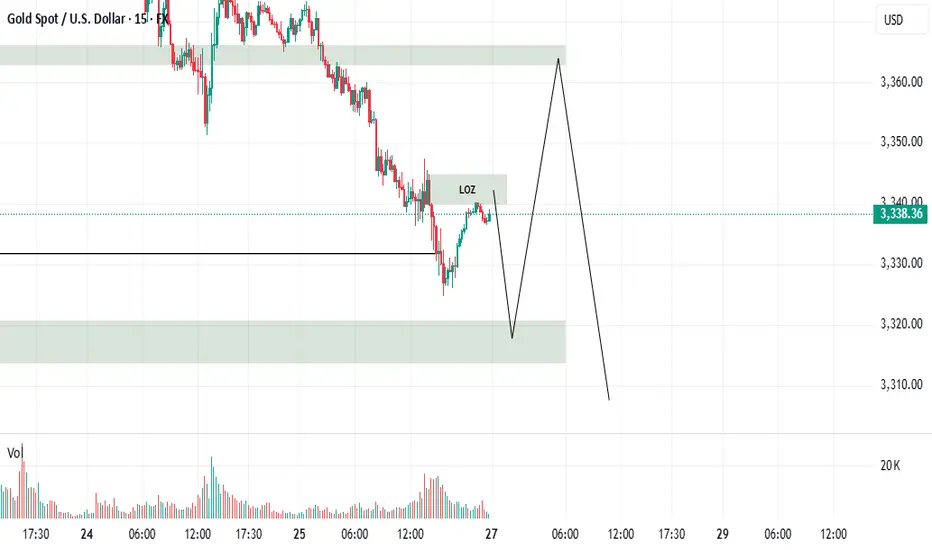
Super Sell!Hello all. as you see market reaches to an LOZ and it needs a historical low. As DXY will increasing, it it will falling. Effect of tariff started. be happy and have a super great week(wink)
Ready to go short?!Hello all. I was thinking on GBPUSD. then I found that a Node is left behind. is it possible to left sth. behind at market? I will tell you no. then it is a good Opp to start going short. huge R/R is important here. be happy and have a wealthy life (wink).
and let me tell you sth. """"BE PATIENT""". Today I lose 1.4% of my account just for having no patience.

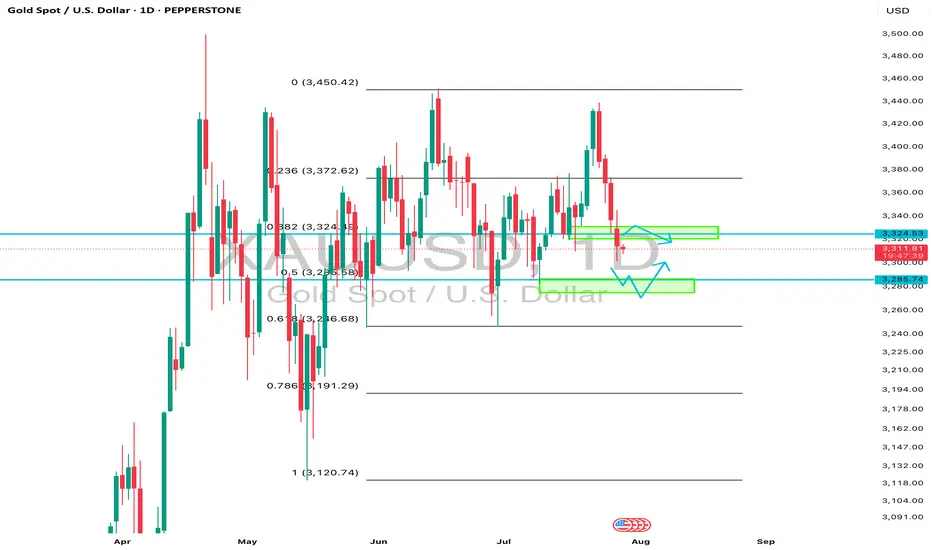
XAUUSD approaches a strong buy zoneGold is approaching a strong buy area. Aggressive traders set pending orders whereas cautious ones wait for some confirmation signals in the range of such zones. I expect buyers to push price back up for atleast half day today Follow risk management to enjoy your trading journey.
Target1 3374

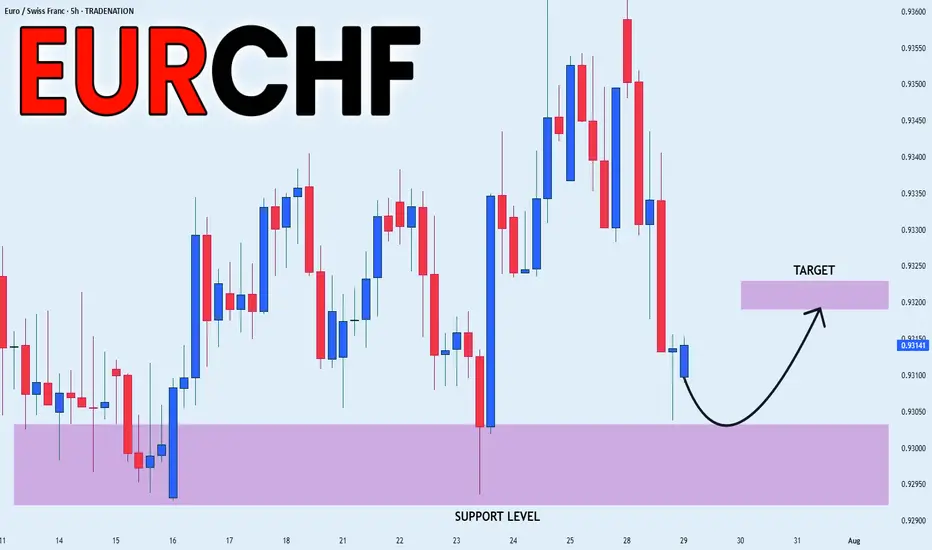
EUR_CHF RISKY LONG|
✅EUR_CHF is set to retest a
Strong support level below at 0.9300
After trading in a local downtrend for some time
Which makes a bullish rebound a likely scenario
With the target being a local resistance above at 0.9320
LONG🚀
✅Like and subscribe to never miss a new idea!✅
Disclosure: I am part of Trade Nation's Influencer program and receive a monthly fee for using their TradingView charts in my analysis.
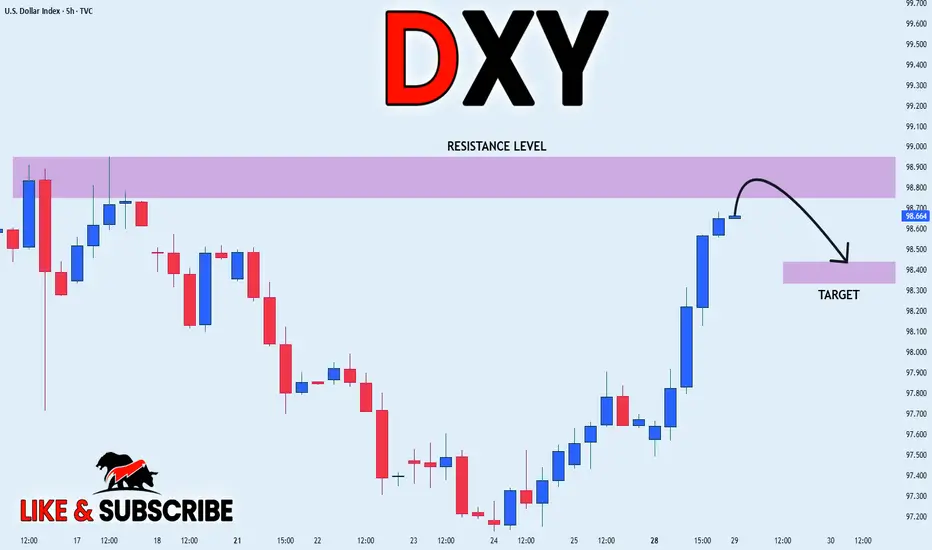
DXY LOCAL SHORT|
✅DXY is going up now
But a strong resistance level is ahead at 98.948
Thus I am expecting a pullback
And a move down towards the target of 98.451
SHORT🔥
✅Like and subscribe to never miss a new idea!✅
Disclosure: I am part of Trade Nation's Influencer program and receive a monthly fee for using their TradingView charts in my analysis.
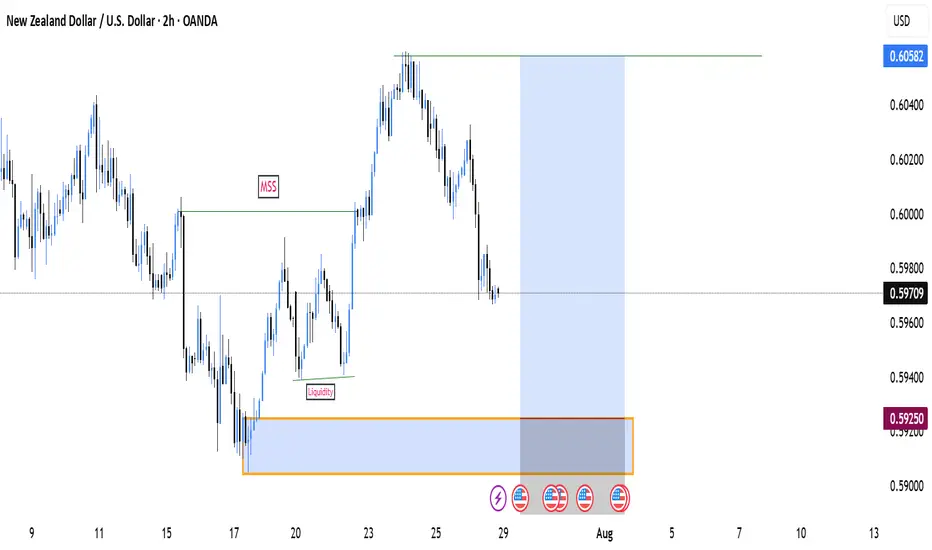
NZDUSDT Long Looking to enter NZD/USD around 0.59250 at the Order Block due to a liquidity inducement zone and potential Market Structure Shift (MSS).
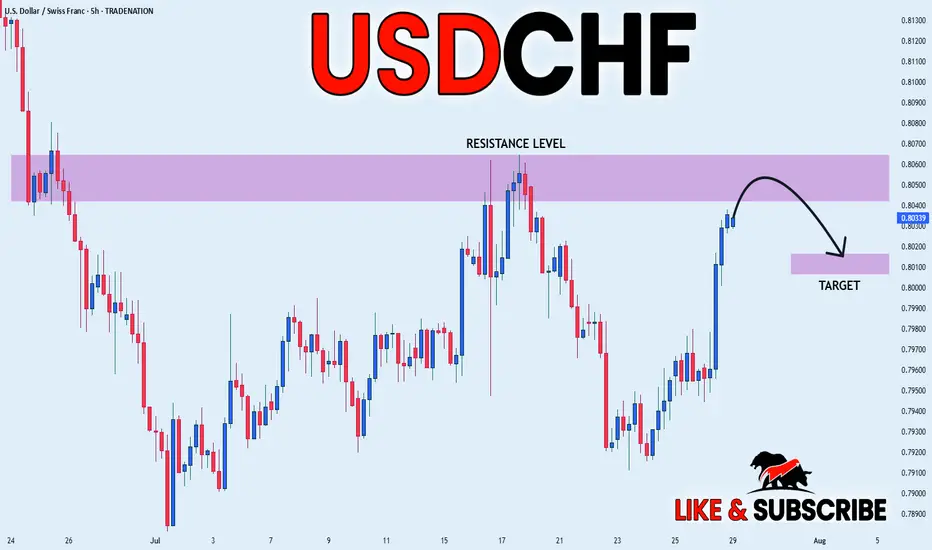
USD_CHF SHORT FROM RESISTANCE|
✅USD_CHF has been growing recently
And the pair seems locally overbought
So as the pair is approaching
A horizontal resistance of 0.8064
Price decline is to be expected
SHORT🔥
✅Like and subscribe to never miss a new idea!✅
Disclosure: I am part of Trade Nation's Influencer program and receive a monthly fee for using their TradingView charts in my analysis.
EURUSD BUYThe US Dollar (USD) gapped lower at the weekly opening amid optimism fueling demand for high-yielding assets, following news that the United States (US) and the European Union (EU) reached a trade deal.
The US and the EU agreed a 15% tariff on most European goods entering the US, much higher than the average 4.8% exporters face these days. No rates will apply to EU exports in important sectors, including aircraft parts, some chemicals, semiconductor equipment and some agricultural products.
The EU response to the headline was uneven. European Central Bank (ECB) policymaker Peter Kazimir said on Monday that the trade deal reduces uncertainty, but it is unclear for now how it impacts inflation. However, the French prime minister, François Bayrou, said the EU has capitulated to Donald Trump’s threats, adding it is a “dark day” for the EU. The trade focus now shifts to the US-China as officials from both countries resume talks in Stockholm.
The EUR/USD pair peaked at 1.1771 during Asian trading hours, but changed course early in Europe, with the USD surging across the FX board, resulting in the pair shedding over 100 pips.
The macroeconomic calendar had nothing relevant to offer at the beginning of the week, but will be flooded with first-tier releases, including US employment-related data ahead of the Nonfarm Payrolls report on Friday, the preliminary estimates of the Q2 Gross Domestic Product (GDP) for the US and the EU, and inflation updates. On top of that, the Federal Reserve (Fed) will announce its decision on monetary policy on Wednesday.
RESISTANCE 1.16050
RESISTANCE 1.16243
RESISTANCE 1.16451
SUPPORT 1.15856
SUPPORT 1.15711


Sell,Buy,Sell!Hello all. as you see market structure Talks. it is so beautiful move is running right here. be happy(wink)
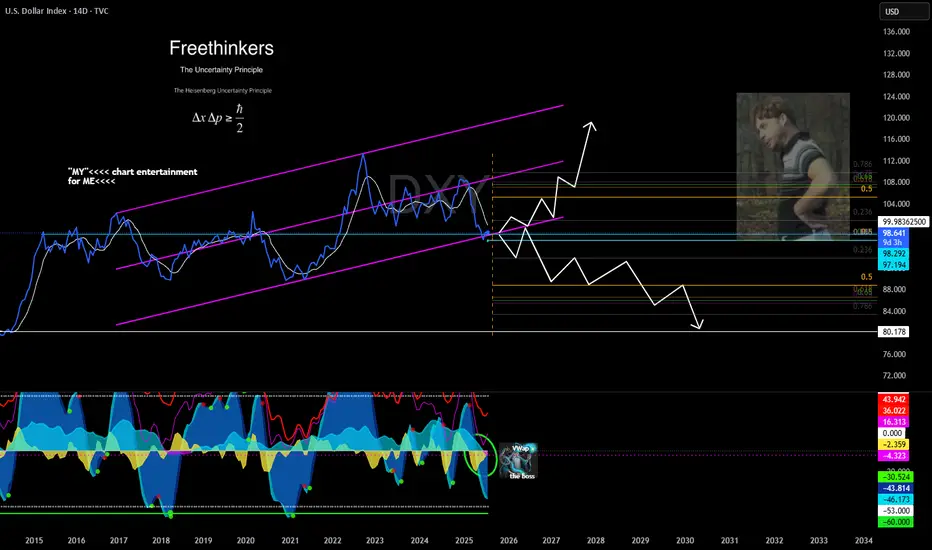
DXY dont take these charts serious its just my way to keep myself entertained while finding levels etc.. no your usual boring systematic shiiiteee!! IRISH CRAIC ONLY!!! ☘
SAP - LONG Swing Entry PlanNYSE:SAP - LONG Swing Entry Plan
Entry Zone 1: $283.00 – $282.00
→ Open initial position targeting +8% from entry level.
Entry Zone 2: $274.00 – $273.00
→ If price dips further, average down with a second equal-sized entry.
→ New target becomes +8% from the average of Entry 1 and Entry 2.
Edit Zone : $260.00 – $258.00
→ If reached, enter with double the initial size to lower the overall cost basis.
→ Profit target remains +8% from the new average across all three entries.
Risk Management:
Stop Loss:
Risk is capped at 12% below the average entry price (calculated across all executed positions including the Edit Zone).
Position Sizing Approach:
Entry 1: 1x
Entry 2: 1x
Edit Zone: 2x
→ Total exposure: 4x
→ Weighted average determines final TP and SL calculations.
______________________________________
Legal Disclaimer
The information provided in this content is intended for educational and informational purposes only and does not constitute financial, investment, or legal advice or recommendations of any kind. The provider of this content assumes no legal or financial responsibility for any investment decisions made based on this information. Users are strongly advised to conduct their own due diligence and consult with licensed financial advisors before making any financial or investment decisions.
Sharia Compliance Disclaimer: The provider makes no guarantees that the stocks or financial instruments mentioned herein comply with Islamic (Sharia) principles. It is the user’s responsibility to verify Sharia compliance, and consultation with a qualified Sharia advisor is strongly recommended before making any investment decisions

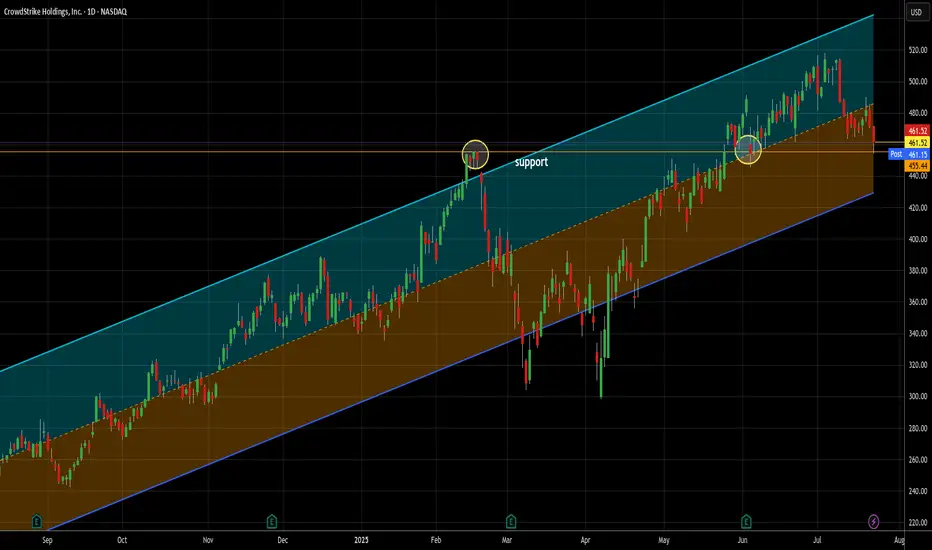
The only way to fight AI is with AI -- long at 461.52I love cybersecurity stocks generally. As our lives become ever more embedded in the electronic world, their necessity increases. As AI driven threats are sure to rise (Sam Altman, founder of OpenAI, spoke to a financial conference this week about the rising threat of AI driven banking fraud), the only way to combat it effectively is with AI. Crowdstrike, along with Palo Alto, are leading the charge in this area and I think will be another great example of AI ultimately being better than humans at the job they need to do here.
Yes, it's a story stock, but you know me - the story is the trading data. So here it is. In the last 12 months, 21 signals. 21 wins, 0 losses. Average trade length = 6.7 days (though that's misleading since all but 4 trades closed in less than that and 20 of 21 were 10 days or less). Average gain was 4.46% - that's an average of .67% per day held. That's almost 16x the long term daily rate of return of SPX and almost 10x the daily return of the Nasdaq 100 in the last year.
Additionally, it bounced off support near today's low and finished stronger. That's always good to see. I will happily add more if my signals suggest it, but of the 21 signals, only once did it produce 2 open lots at once. Nornally, it was one lot paying quickly. 2/3 of the trades closed in less than one week.
As always - this is intended as "edutainment" and my perspective on what I am or would be doing, not a recommendation for you to buy or sell. Act accordingly and invest at your own risk. DYOR and only make investments that make good financial sense for you in your current situation.
Candle Close July 2025I made a post about a draw to sell side. Objective met today. unexpected for a Monday but all good. We could continue lower but it's likely we get a pull back or consolidation considering this is the last week of the month thus a candle close for July 2025. let's watch. I'm gonna stay out for the rest of the week. toodles
