"XAU/USD Gold Heist Plan | Pullback Entry for Big Bullish Move"🔐💰“GOLD HEIST PLAN UNLOCKED: Thief Trader’s XAU/USD Breakout Blueprint”💰🔐
by The Market Robber a.k.a. Thief Trader – Stealing Pips, One Candle at a Time!
🌍 Hey Money Makers, Market Hustlers, Robbers, & Chart Crackers! 🌍
Bonjour! Hola! Marhaba! Hallo! Ola! What's poppin'?
Welcome to another exclusive robbery plan crafted in pure Thief Trading style—built off technicals, fundamentals, market psychology, and a bit of outlaw intuition. 💸⚔️
This one’s for the GOLD DIGGERS – literally. We’re targeting XAU/USD for a high-voltage bullish heist 🎯💥. Stick to the plan, follow the chart, and you might just make it out with a sack full of pips 💰🔥.
🔓 THE SETUP: GET READY TO ROB THE GOLD MARKET
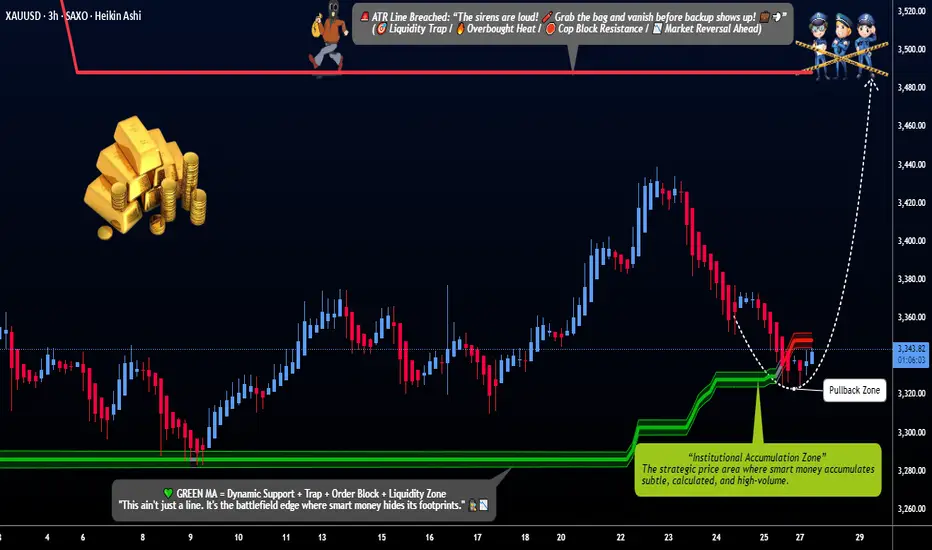
We're eyeing a LONG ENTRY, with clear intent to break past the consolidation zone and avoid the trap laid by the "market police" at the ATR barricade zone 🚨. This level is where overbought drama and bear claws are strongest – we slip in, grab the profits, and bounce before they know what hit ‘em.
🧠 Use caution: This level is filled with liquidity traps, reversals, fakeouts and retail bait zones. Classic Thief style means we know where the guards are sleeping and where the cameras don't reach. 🎥🔕
💸 ENTRY PLAN:
🟢 Entry Zone: Watch for a pullback to 3320.00 or above. Don’t jump early.
💡 Tactics:
Use Buy Limit Orders (DCA / Layered Entry Style)
Drop them in on 15min/30min swing levels – catch price slipping into liquidity
Confirm with minor structure breaks / order block retests
🔔 Set those alerts – the real move happens when the breakout candle hits.
🛑 STOP LOSS STRATEGY:
🧠 Pro Rule: No stop-loss before breakout.
Once breakout confirms:
🔴 SL Zone: Recent swing low (approx. 3280.00) on the 4H chart
🎯 Adjust SL based on:
Lot size
Order count
Risk appetite
You know the game: manage your risk like a pro thief—quiet, calculated, and fast on the getaway. 💨
🎯 TARGET ZONE:
🏁 TP Zone: 3490.00
⚠️ Escape earlier if the pressure gets heavy – smart thieves never overstay the job.
🧲 SCALP MODE:
Only scalp LONG SIDE – don’t get caught chasing shorts unless you're rich enough to burn your drawdown 🔥
🔐 Use trailing SL to secure bags while climbing the ladder.
🧠 FUNDAMENTALS & MACRO EDGE:
The Gold market is currently in a BEAR structure with hints of bullish reversal potential. This heist isn’t just technical – it’s backed by:
🌍 Global Macro Flows
💼 COT Reports
📰 Sentiment & News Risk
💣 Geo-political Heat
📊 Intermarket Analysis (Dollar, Yields, Risk-On/Off correlations)
Dig deep for the full macro breakdown. Knowledge is leverage.
(Find full reports on reputable sources — you know where to look 👀)
🚨 RISK ALERT:
Before, During & After News Releases:
Avoid fresh entries 🔕
Use Trailing SLs to protect live trades
Watch spread spikes & low-liquidity traps
👉 Don't trade when the market's drunk.
💖 SHOW LOVE – BOOST THE PLAN:
💥Smash that Boost Button💥 if you want more precision heist strategies like this. Support the Thief Trading Style, and we’ll keep robbing the markets clean and teaching the crew how to get in & get out profit-heavy. 🏴☠️📈💰
🎭 I’ll be back with another chart crime scene soon. Until then, stay sneaky, stay profitable, and always move like the market’s watching (because it is). 😎
🔐 Thief Trader Out. Rob. Exit. Repeat. 🔁💸
Beyond Technical Analysis
Trading as a Probabilistic ProcessTrading as a Probabilistic Process
As mentioned in the previous post , involvement in the market occurs for a wide range of reasons, which creates structural disorder. As a result, trading must be approached with the understanding that outcomes are variable. While a setup may reach a predefined target, it may also result in partial continuation, overextension, no follow-through, or immediate reversal. We trade based on known variables and informed expectations, but the outcome may still fall outside them.
Therefore each individual trade should be viewed as a random outcome. A valid setup could lose; an invalid one could win. It is possible to follow every rule and still take a loss. It is equally possible to break all rules and still see profits. These inconsistencies can cluster into streaks, several wins or losses in a row, without indicating anything about the applied system.
To navigate this, traders should think in terms of sample size. A single trade provides limited insight, relevant information only emerges over a sequence of outcomes. Probabilistic trading means acting on repeatable conditions that show positive expectancy over time, while accepting that the result of any individual trade is unknowable.
Expected Value
Expected value is a formula to measure the long-term performance of a trading system. It represents the average outcome per trade over time, factoring in both wins and losses:
Expected Value = (Win Rate × Average Win) – (Loss Rate × Average Loss)
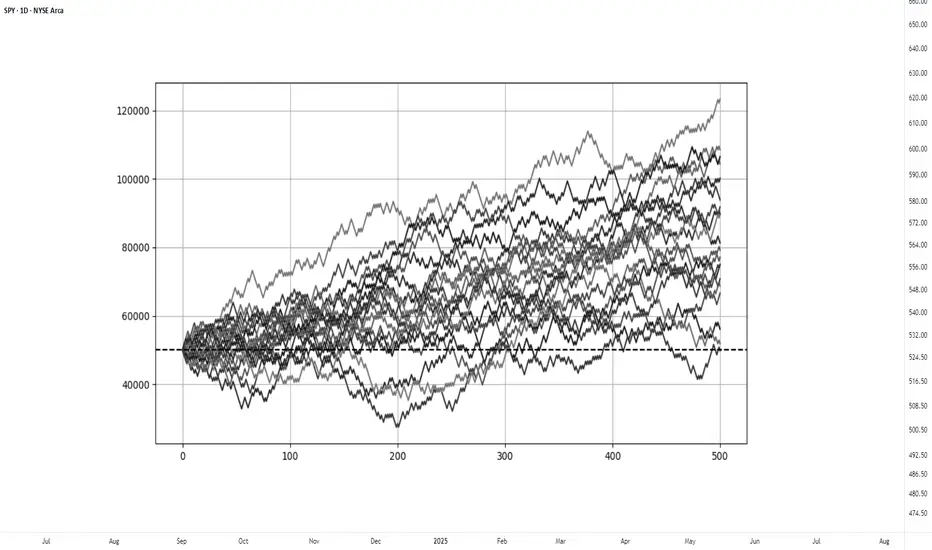
This principle can be demonstrated through simulation. A basic system with a 50% win rate and a 1.1 to 1 reward-to-risk ratio was tested over 500 trades across 20 independent runs. Each run began with a $50,000 account and applied a fixed risk of $1000 per trade. The setup, rules, and parameters remained identical throughout; the only difference was the random sequence in which wins and losses occurred.
While most runs clustered around a profitable outcome consistent with the positive expected value, several outliers demonstrated the impact of sequencing. When 250 trades had been done, one account was up more than 60% while another was down nearly 40%. In one run, the account more than doubled by the end of the 500 trades. In another, it failed to generate any meaningful profit across the entire sequence. These differences occurred not because of flaws in the system, but because of randomness in the order of outcomes.
These are known as Monte Carlo simulations, a method used to estimate possible outcomes of a system by repeatedly running it through randomized sequences. The technique is applied in many fields to model uncertainty and variation. In trading, it can be used to observe how a strategy performs across different sequences of wins and losses, helping to understand the range of outcomes that may result from probability.
Trading System Variations
Two different strategies can produce the same expected value, even if they operate on different terms. This is not a theoretical point, but a practical one that influences what kind of outcomes can be expected.
For example, System A operates with a high win rate and a lower reward-to-risk ratio. It wins 70% of the time with a 0.5 R, while System B takes the opposite approach and wins 30% of the time with a 2.5 R. If the applied risk is $1,000, the following results appear:
System A = (0.70 × 500) − (0.30 × 1,000) = 350 − 300 = $50
System B = (0.30 × 2,500) − (0.70 × 1,000) = 750 − 700 = $50
Both systems average a profit of $50 per trade, yet they are very different to trade and experience. Both are valid approaches if applied consistently. What matters is not the math alone, but whether the method can be executed consistently across the full range of outcomes.
Let’s look a bit closer into the simulations and practical implications.
The simulation above shows the higher winrate, lower reward system with an initial $100,000 balance, which made 50 independent runs of 1000 trades each. It produced an average final balance of $134,225. In terms of variance, the lowest final balance reached $99,500 while the best performer $164,000. Drawdowns remained modest, with an average of 7.67%, and only 5% of the runs ended below the initial $100,000 balance. This approach delivers more frequent rewards and a smoother equity curve, but requires strict control in terms of loss size.
The simulation above shows the lower winrate, higher reward system with an initial $100,000 balance, which made 50 independent runs of 1000 trades each. It produced an average final balance of $132,175. The variance was wider, where some run ended near $86,500 and another moved past $175,000. The drawdowns were deeper and more volatile, with an average of 21%, with the worst at 45%. This approach encounters more frequent losses but has infrequent winners that provide the performance required. This approach requires patience and mental resilience to handle frequent losses.
Practical Implications and Risk
While these simulations are static and simplified compared to real-world trading, the principle remains applicable. These results reinforce the idea that trading outcomes must be viewed probabilistically. A reasonable system can produce a wide range of results in the short term. Without sufficient sample size and risk control, even a valid approach may fail to perform. The purpose is not to predict the outcome of one trade, but to manage risk in a way that allows the account to endure variance and let statistical edge develop over time.
This randomness cannot be eliminated, but the impact can be controlled from position sizing. In case the size is too large, even a profitable system can be wiped out during an unfavorable sequence. This consideration is critical to survive long enough for the edge to express itself.
This is also the reason to remain detached from individual trades. When a trade is invalidated or risk has been exceeded, it should be treated as complete. Each outcome is part of a larger sample. Performance can only be evaluated through cumulative data, not individual trades.
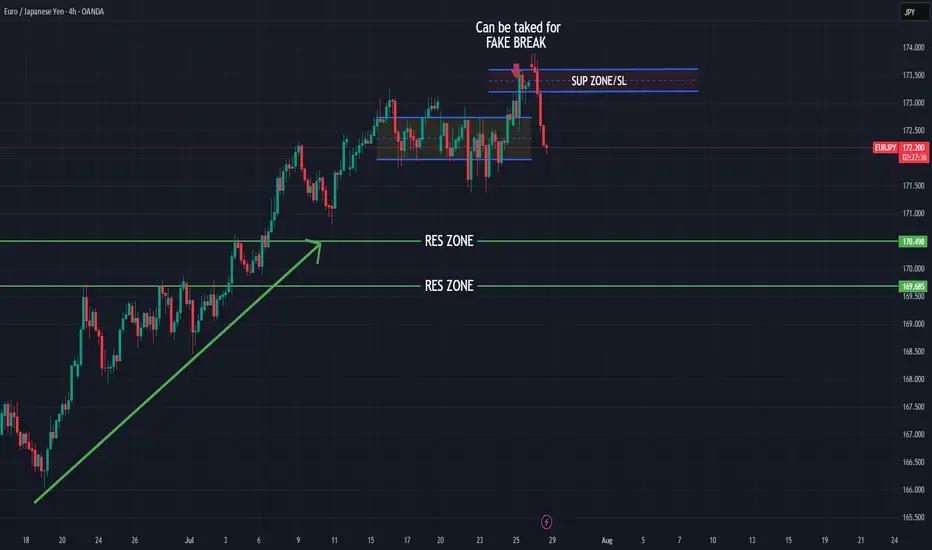
EURJPY point of revers?
OANDA:EURJPY constantly pushing in last periods, currently on this point expecting trend revers and short bearish push.
SUP zone: 173.200
RES zone: 170.500, 169.700
Market Trap Alert! GBP/USD Bearish Robbery Plan🔥💸 "The Cable Heist" – GBP/USD Robbery Plan Using Thief Trading Style 💸🔥
— Unfiltered Forex Forecast with Risky Intentions —
🌍 Hey Money-Makers, Market Hustlers & Chart Bandits! 🤑✈️
Hola! Bonjour! Marhaba! Hallo! Ciao! Welcome to the Forex streets where the smart rob the charts, not banks.
Ready for the GBP/USD Heist? Let’s break it down with our infamous Thief Trading Style – raw, unapologetic, and built for profits.
💼 Operation Name: “The Cable Forex Bank Robbery”
🎯 Pair: GBP/USD – aka “The Cable”
⚔️ Style: Scalp / Day Trade / Swing Heist
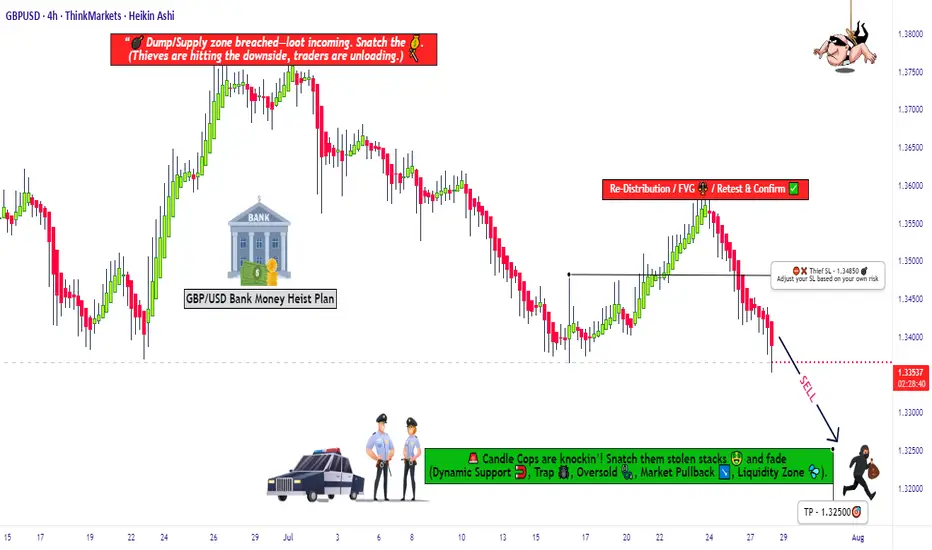
📊 Bias: Short (Bearish Setup)
🛠 STRATEGY SETUP: "Follow the Shadows"
🔍 Analysis Basis:
Smart-Money Traps at Key Levels
Oversold ≠ Reversal (Read between the candles)
Liquidity Hunting Zones
Retail Stop Clusters Exposed
Thief-style DCA Entries (Staggered Entry Levels)
Multi-timeframe Confirmation
COT, Sentiment & News-Driven Volatility
🎯 ENTRY ZONE:
Enter short (sell) using 15M or 30M chart.
Sell Limits near recent highs (pullback zone).
DCA (Layered Entry) recommended – Thief loves catching price slipping.
Let the liquidity work for us.
🛑 STOP LOSS (SL):
Base SL around 1.34850 on 4H Chart – above swing high.
Adjust SL per position size and total entries.
Manage risk, but remember: thieves don’t panic, they plan!
🎯 TARGET ZONE:
TP near 1.32500 or adjust using price action.
Escape before target if market mood flips – no need to be greedy.
Trail SLs if market momentum dies down.
👀 Scalpers' Special Note:
Only SHORT — don’t mess with long side unless you’re a liquidity donor.
Quick ins & outs. If you're loaded with capital, jump in big – else follow the swing team.
Use trailing SLs for safety — protect the loot.
📢 FUNDAMENTALS TO WATCH:
News Impacting GBP/USD
COT Reports
Sentiment Indicators
Macro Trends / Yield Spreads
US Dollar Strength Index (DXY)
UK Economic Reports (CPI, GDP, Rate Decisions)
⚠️ RISK MANAGEMENT TIPS:
🚨 Avoid new entries during news releases
🚨 Use trailing stops during volatility spikes
🚨 Secure running trades before major announcements
🚀 Boost the Robbery – Support the Strategy
💖 Smash that BOOST BUTTON if you're vibing with this setup. Help the Thief crew grow stronger!
Let’s keep milking the market 💸 – one “heist” at a time. Stay dangerous, stay smart.
🔓 NOTE: This isn't investment advice. Just a wild trading idea from a chart outlaw.
Always DYOR – Do Your Own Robbery (Research).
Market conditions shift fast. Stay alert, adapt, and respect your capital.
#ForexThiefStyle #CableHeist #GBPUSDShort #SmartMoneyMoves #LiquidityHunters #ChartOutlaws #TradingRebels #DayTradeLife #ScalpersParadise #ForexGang #FXHeistPlans
E-mini Nasdaq 100. 28.07.2025, MondayCME_MINI:NQ1!
Explained the daily orderflow on NQ along with possible entries and exits and mistakes stops. Everything outlined in here

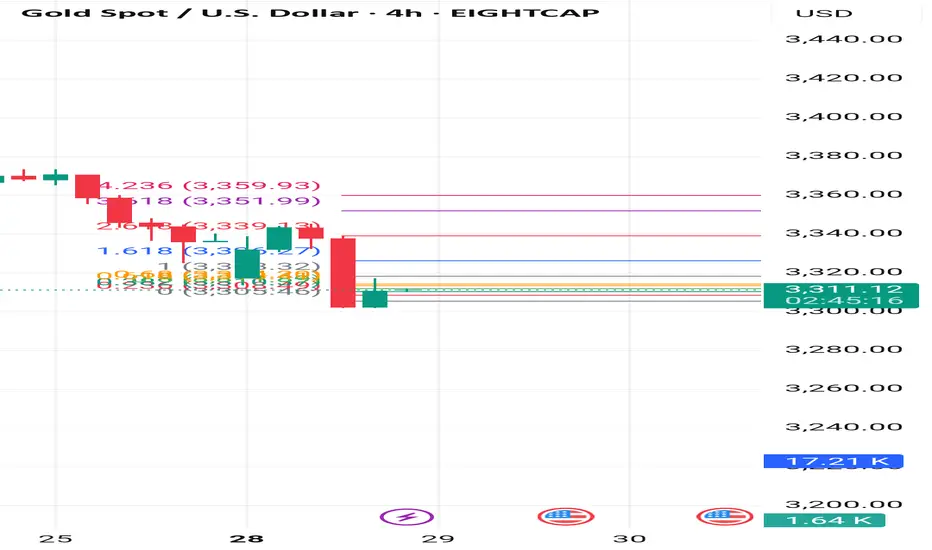
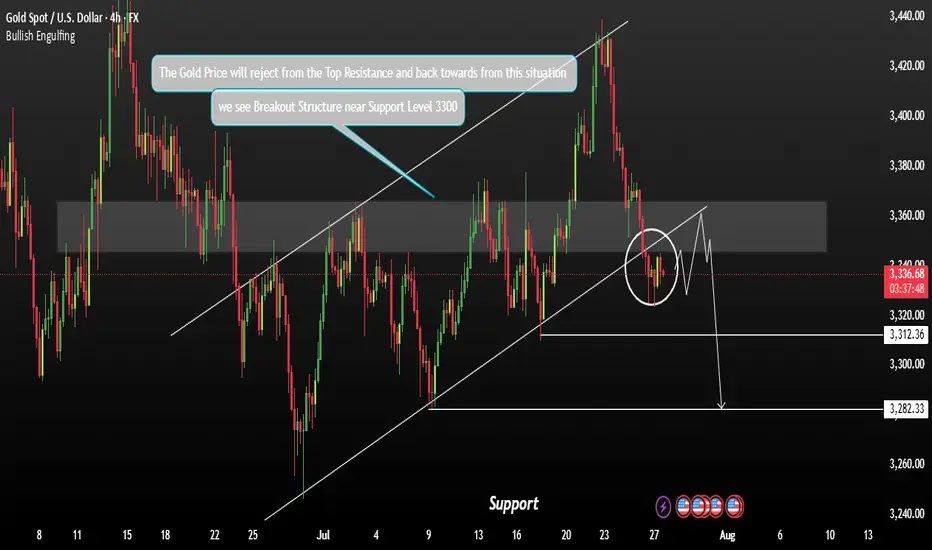
Gold Could Show there Potentially BearishGold is currently consolidating, but a downtrend range is forming based on the prevailing market setup. After erasing early gains, XAUUSD stabilized near 3340 on Monday, with downside pressure largely influenced by a stronger U.S. Dollar following the announcement of the US-EU trade agreement.
Price rejected sharply from the 3340 resistance zone, suggesting continued bearish momentum. A minor pullback was seen after testing the upper boundary, with sellers regaining control near resistance. Traders are closely watching the 3350–3362 resistance zone, where another rejection could fuel a fresh downside move A confirmed breakdown below 3312 could open the path toward 3282 in the short term.
Ps: Support with like and comments for more better analysis.
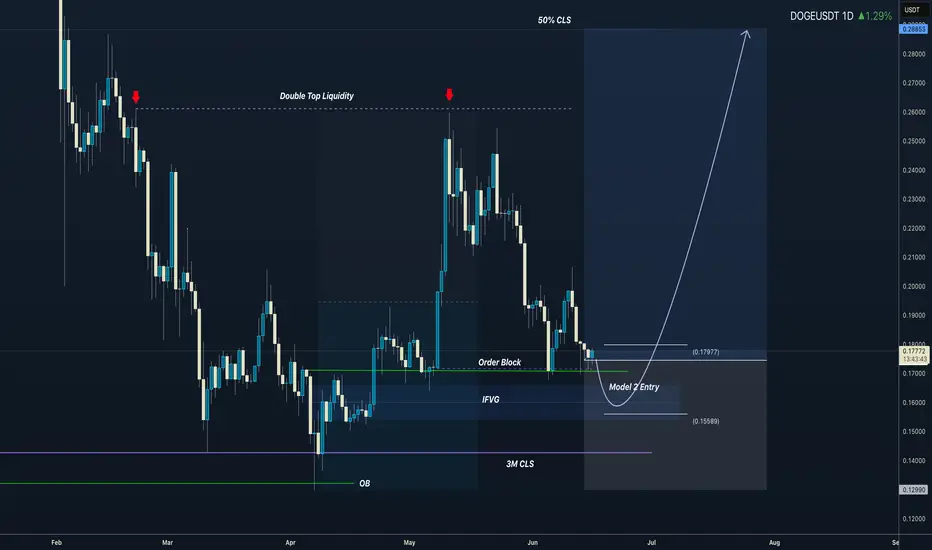
3M CLS I KL - OB I Model 2 I Targe 50% CLSHey, Market Warriors, here is another outlook on this instrument
If you’ve been following me, you already know every setup you see is built around a CLS Footprint, a Key Level, Liquidity and a specific execution model.
If you haven't followed me yet, start now.
My trading system is completely mechanical — designed to remove emotions, opinions, and impulsive decisions. No messy diagonal lines. No random drawings. Just clarity, structure, and execution.
🧩 What is CLS?
CLS is real smart money — the combined power of major investment banks and central banks moving over 6.5 trillion dollars a day. Understanding their operations is key to markets.
✅ Understanding the behavior of CLS allows you to position yourself with the giants during the market manipulations — leading to buying lows and selling highs - cleaner entries, clearer exits, and consistent profits.
📍 Model 1
is right after the manipulation of the CLS candle when CIOD occurs, and we are targeting 50% of the CLS range. H4 CLS ranges supported by HTF go straight to the opposing range.
"Adapt what is useful, reject what is useless, and add what is specifically your own."
— David Perk aka Dave FX Hunter ⚔️
👍 Hit like if you find this analysis helpful, and don't hesitate to comment with your opinions, charts or any questions.
HYPE | #12h #long — Major Reversal Setup from 200 EMA & DemandStarted building a position around 42.7 due to the under/over of the H4 EMA 200 and the prior consolidation high. However, there's an untapped H4 demand zone beneath — if we get a flush into that area and then reclaim 41.2 and the H4 EMA 200, I'll be adding to my position.
Invalidation:
Losing the H4 demand would be my cut-off, potentially opening the door for a sweep of the equal lows near 30.
Scenario:
— If the 200 EMA holds or we see #OneMoreLow to trap sellers and reclaim, the setup remains very bullish.
— Targets: At minimum, a stab into ATH, with the potential for a full extension up to 55.3 and beyond.
Reasoning:
This is a classic under/over setup with demand untested and a clear invalidation level. If buyers step in and reclaim key levels, expect explosive continuation.

SMCI WEEKLY CALL SETUP (07/28/25)
### 🔹 SMCI WEEKLY CALL SETUP (07/28/25)
**Bullish Flow + Strong RSI = 🚀 Call Opportunity at \$62**
---
### 📊 TECHNICAL SNAPSHOT
* **RSI (Daily + Weekly):** ✅ Above 55 — clear bullish strength
* **Weekly Close:** 🔼 Broke prior highs — momentum continuation likely
* **Volume Ratio:** Slightly weak (0.9x) 📉 — watch early-week participation
* **VIX:** 14.93 💤 — low vol = smoother price action (great for weekly calls)
---
### 💥 OPTIONS FLOW HIGHLIGHTS
* **Call/Put Ratio:** 4.30 🔥 (heavy bullish skew)
* **Hot Strikes:** \$62.00 & \$63.00 = aggressive positioning
* **OI Surge:** Confirmed institutional interest → upside bets stacking up
---
### ✅ TRADE SETUP
* 🎯 **Strategy:** Long Weekly Call
* 📈 **Strike:** \$62.00
* 📅 **Expiration:** Aug 1, 2025
* 💸 **Entry Price:** \$0.86 (ask)
* 🛑 **Stop Loss:** \$0.43 (50% risk)
* 🎯 **Target:** \$1.20 (40% upside)
* 📈 **Confidence:** 80%
* ⏰ **Entry Timing:** Market open
---
### 🚨 KEY RISKS
* ⚠️ Weak volume = lower conviction from institutions
* 📉 Watch early-week flow → exit if buyers fade
* 🎯 Above \$63 = breakout fuel
* 🧨 Below \$61 = trend in question
---
### 🧠 MODEL CONSENSUS
> All quant models bullish except **one cautioning on volume**
> Options flow + RSI = overwhelming bullish case
---
### 📦 TRADE\_DETAILS (Algo-Friendly JSON)
```json
{
"instrument": "SMCI",
"direction": "call",
"strike": 62.0,
"expiry": "2025-08-01",
"confidence": 0.80,
"profit_target": 1.20,
"stop_loss": 0.43,
"size": 1,
"entry_price": 0.86,
"entry_timing": "open",
"signal_publish_time": "2025-08-01 09:30:00 UTC-04:00"
}
```
---
📈 **Watch zones:**
* 🚀 Above \$63 = breakout
* 🛑 Below \$61 = cut risk
---
**#SMCI #OptionsFlow #CallOptions #WeeklyTrade #RSI #BullishMomentum #MarketOpenSetup #QuantSignals #OptionsAlert**

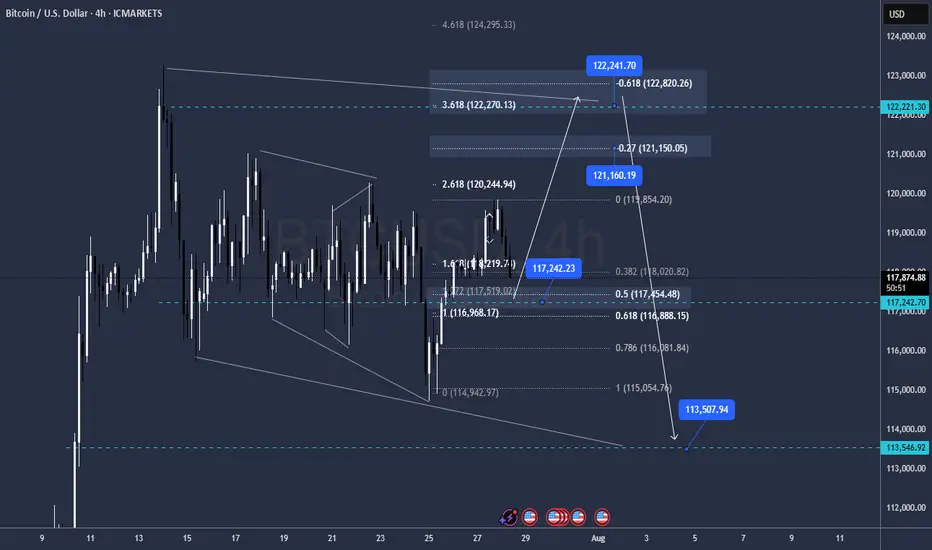
BTC new meassuresokay impulse is pretty much clear
buy level 117.250 Targtting 121.100 / 122.200 / 122.800
Sell level 122.200 targetting 113.500
Re buy level 113.500 targetting 127.500 / 133.000
GG
CRWVExpecting Bullish price action at 100$ level. If break of structure is noted and maintained I see upside targets remaining 189$. Second Scenario is Price falls to the 60$ level then shows bullish price action.

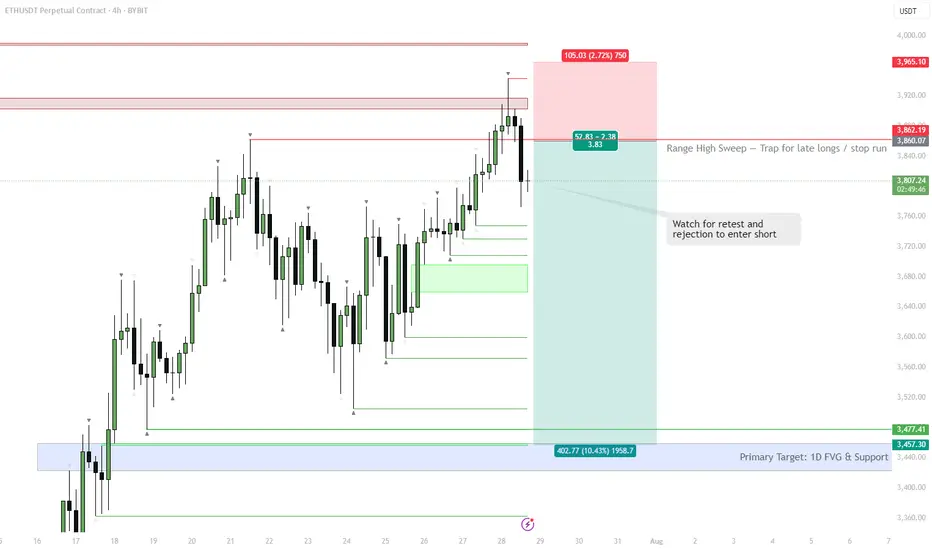
ETH | #4h #short — Range High Sweep & Short SetupScenario:
ETH swept the range high at $3,860, trapping late buyers and triggering stops. Watching for a retest of this level — if it holds as resistance and we see rejection, that’s a short trigger.
Target:
Main target is the 1D FVG at $3,457–$3,477. Possible extension: sweep of range low if selling accelerates.
Why:
Failed breakout setups are classic mean reversion triggers, especially when supported by a visible liquidity pool (FVG) below.
Plan:
Wait for a retest and rejection to confirm short. Partial TP at the FVG zone, manage risk above the sweep high.
MSTR WEEKLY OPTIONS SETUP (2025-07-28)
### 🔻 MSTR WEEKLY OPTIONS SETUP (2025-07-28)
**Bearish Divergence with High Confidence — Time to Strike with a PUT?**
---
📊 **Momentum Recap:**
* **RSI:** Bearish 📉
* **Volume:** Weak (institutional exit risk)
* **Options Flow:** Mixed (calls > puts, but no alignment with price)
* **Sentiment Models:** Split 4:1 → **Only Claude/Anthropic** goes bearish with conviction
🧠 **Model Consensus:**
> “Momentum is weak, volume fading, and no upside confirmation = bearish edge.”
---
### ✅ SETUP OVERVIEW
* 🔍 **Trend:** Bearish (declining RSI)
* 📉 **Volume:** Weak = reduced institutional conviction
* 💬 **Options Flow:** Bullish bias, but **contradicts price trend**
* ⚙️ **Volatility:** Elevated, potential reward for directional plays
**Overall Bias:** 🔴 *Moderately Bearish*
---
### 💥 TRADE IDEA: MSTR \$400P
* 🎯 **Strategy:** Long Weekly Put
* 🔻 **Strike:** 400.00
* 📆 **Expiry:** Aug 1, 2025
* 💸 **Entry Price:** \$8.65
* ✅ **Profit Target:** \$12.50
* 🛑 **Stop Loss:** \$4.00
* 📈 **Confidence Level:** 72% (backed by Claude model)
* 📉 **Breakdown Trigger:** Below \$405 confirms bearish flow
* ⚠️ **Invalidation:** Break above \$415 → exit early
---
### 📦 TRADE\_DETAILS (Backtest/Algo Ready JSON)
```json
{
"instrument": "MSTR",
"direction": "put",
"strike": 400.0,
"expiry": "2025-08-01",
"confidence": 0.72,
"profit_target": 12.50,
"stop_loss": 4.00,
"size": 1,
"entry_price": 8.65,
"entry_timing": "open",
"signal_publish_time": "2025-07-31 09:30:00 UTC-04:00"
}
```
---
### 🧠 TRADE INSIGHTS
* 🟥 4/5 models say **no trade** due to signal divergence
* 🧠 **Claude’s bearish thesis = cleanest directional setup**
* 🚨 Volume + RSI combo = downside confirmation
* 🧭 Watch key price reaction zones: **\$400–\$405 (support)** / **\$415 (resistance cap)**
---
**#MSTR #PutOptions #WeeklyTrade #BearishSetup #OptionsFlow #QuantTrading #ClaudeModel #MarketMomentum**

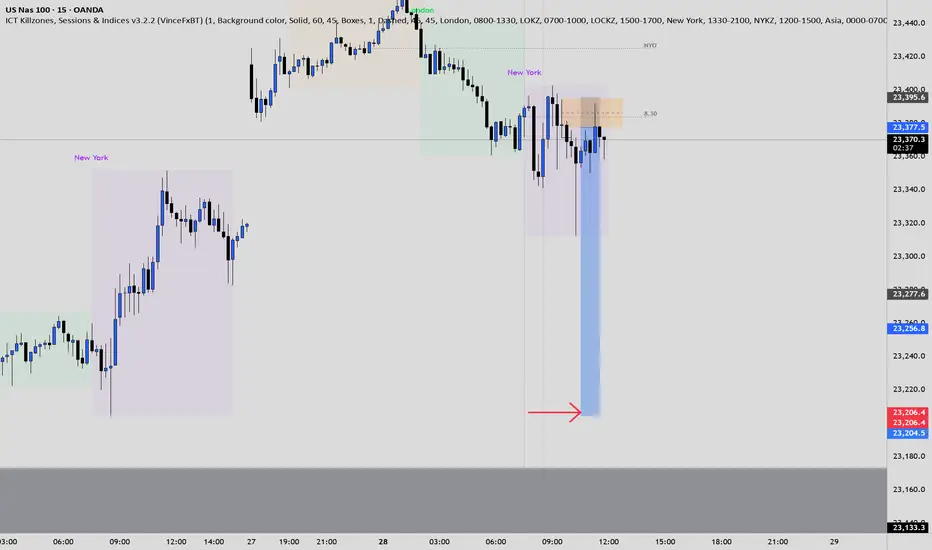
NAS100 shortElite analysis
Confirmed the entire checklist
Targeting lower liquidity pools.
Main Target NY Low.
This was confirmed from Daily all the way down to 1m.
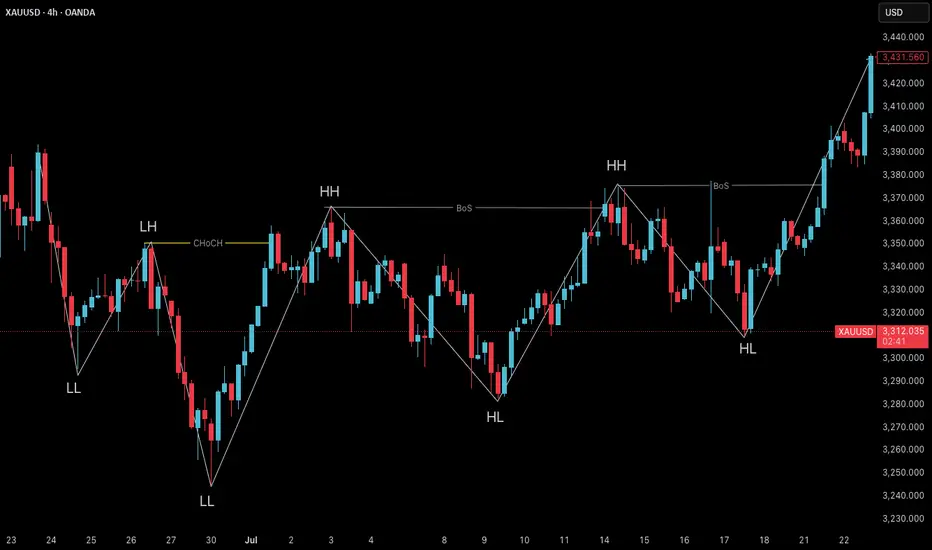
ChoCH: The Quiet Shift Most Traders Ignore“Most traders chase price. Few notice when price quietly turns around.”
Before a trend ends, before a breakout fails, before a setup forms —
There’s often a silent clue: Change of Character (ChoCH) .
What is ChoCH?
Change of Character marks the first structural sign that the market may be reversing — not continuing.
It’s a break in the internal rhythm of price, often happening after a liquidity sweep or inside a key zone.
In simpler terms:
BoS = Continuation
ChoCH = Potential Reversal
Most traders treat ChoCH like a green light to enter... but that’s a mistake.
ChoCH alone doesn’t mean a trend is ready to reverse.
It only tells you the current trend has paused or cracked — not ended.
What matters more is:
– Where the ChoCH happens
– Why it happens
– What came before it
This is where context matters.
How I Use ChoCH in My Trading Framework:
My approach is built around multi-timeframe structure:
✅ H4 – Bias
✅ M15 – Setup Alignment
✅ M1 – Sniper Entry
So when I see a ChoCH on M15 , I ask:
Does this align with my H4 bias ?
Has price entered a key zone or swept liquidity before the shift?
If yes — I start watching closely.
If no — it’s likely just noise.
ChoCH without narrative is just confusion.
BoS vs ChoCH – Know the Difference:
• BoS (Break of Structure) confirms trend continuation
• ChoCH (Change of Character) hints at a trend shift
• They look similar on a chart — but their implications are opposite
Mistake to avoid: Entering just because ChoCH appeared
Better approach: Let it warn you , not trap you
🪞 Final Thought:
ChoCH is not an entry. It’s an invitation.
A quiet shift the market offers only to those still enough to see it.
Some notice it.
Fewer understand it.
Even fewer know what to do after.
That’s the difference between recognizing a change… and trading it with conviction.
💬 If this spoke to you, share your thoughts below.
There’s more beneath the surface — tell me what direction you'd like to explore next.
Some of the most powerful methods I use aren’t shared openly — but those who’ve seen them know why.
You’ll know where to look if it’s meant for you.
📘 Shared by @ChartIsMirror
GE WEEKLY OPTIONS SETUP (2025-07-28)
### ⚙️ GE WEEKLY OPTIONS SETUP (2025-07-28)
**Mixed Signals, Bullish Flow – Can Calls Win This Tug-of-War?**
---
📊 **Momentum Breakdown:**
* **RSI:** Falling across models → ⚠️ *Momentum Weak*
* **Volume:** Weak 📉 = Low conviction from big players
* **Options Flow:** Call/Put ratio favors bulls 📈
* **Volatility (VIX):** Favorable for directional plays
🧠 Model Consensus:
> “Momentum weak, but bullish flow + low VIX = cautiously bullish.”
> Some models recommend **no trade**, others suggest **tight-risk long call**.
---
### ✅ WEEKLY SETUP AT A GLANCE
* 🔍 **Volume:** Weak (distribution risk)
* 📉 **Momentum:** RSI fading
* 💬 **Options Sentiment:** Bullish bias (calls > puts)
* ⚙️ **Volatility:** Favorable
**Overall Bias:** 🟡 *Moderate Bullish*
---
### 💥 TRADE IDEA: GE \$275C
* 🎯 **Strategy:** Long Weekly Call
* 🔵 **Strike:** 275.00
* 📆 **Expiry:** Aug 1, 2025
* 💸 **Entry:** \$1.10
* ✅ **Profit Target:** \$1.80
* 🛑 **Stop Loss:** \$0.55
* 📈 **Confidence Level:** 65%
* 🧮 **Risk Level:** Medium (momentum divergence = tread carefully)
* ⚠️ **Support Watch:** Monitor for drop below \$268–270 for potential exit.
---
### 📦 TRADE\_DETAILS (Algo/Backtest Ready JSON)
```json
{
"instrument": "GE",
"direction": "call",
"strike": 275.0,
"expiry": "2025-08-01",
"confidence": 0.65,
"profit_target": 1.80,
"stop_loss": 0.55,
"size": 1,
"entry_price": 1.10,
"entry_timing": "open",
"signal_publish_time": "2025-07-28 12:08:59 UTC-04:00"
}
```
---
### 📌 NOTES FOR TRADERS
* 🤖 Models split between *no trade* vs *tight-risk long*
* 🚨 **Momentum divergence** is real – don’t oversize
* 🧭 **Watch Friday theta decay** — manage exits accordingly
* 🔍 Chart check: Watch price action near \$275 and \$268
---
**#GE #OptionsTrading #WeeklyPlay #CallFlow #UnusualOptionsActivity #GEcalls #AITrading #RiskManagement**

GBPUSD and The Elliott Wave TheoryThis is the continuation of a larger wave that had started earlier. Our Wave 2(Green) was a Zigzag and our Wave 4(Green), a Flat completed when Wave C(Blue) finished. When Wave 4(Green) completed, we see a 5 Wave move begin, thus Wave 5(Green). This 5 wave move is shown in Black. Wave 2(Black) was a Zigzag meaning a Flat should be expected for Wave 4(Black) - more on this later in this article. Wave 3(Black) expressed itself in a 5 wave move, shown in Red. Wave 2(Red) was a Zigzag meaning Wave 4(Red) should be a Flat. We see exactly that when Wave 3(Red) completes -- a Flat for Wave 4(Red). After Wave 4(Red), a Wave 5(Red) forms to complete the 5 wave move for Wave 3(Black) and is marked as so. Wave 2(Black) was a Zigzag and as mentioned earlier, hence Wave 4(Black) should be a Flat. Indeed, a Wave A(Green) forms for the first leg of the Flat, then a B(Green). Currently, we are on Wave C(Green) and upon completion, this would be our Wave 4(Black). After Wave B(Green) completes we see a Wave 1(Orange) form with a 2 or A forming. This has two readings for now because it could be a Zigzag or the first leg of a Flat. Stay tuned for updates.

From Rejections to Breakout? CAKE Faces Key TrendlineNASDAQ:CAKE has been stuck in a long-term downtrend, constantly getting rejected from that falling red trendline.
But things are starting to shift...
After bouncing off the major support zone, price is once again pushing toward that trendline, and this time, momentum looks stronger.
If CAKE can break and hold above this level, we could finally see a powerful move toward the $5+ resistance zone.
Just a heads-up: it’s been rejected here before, so let the breakout confirm before getting too excited.
DYOR, NFA

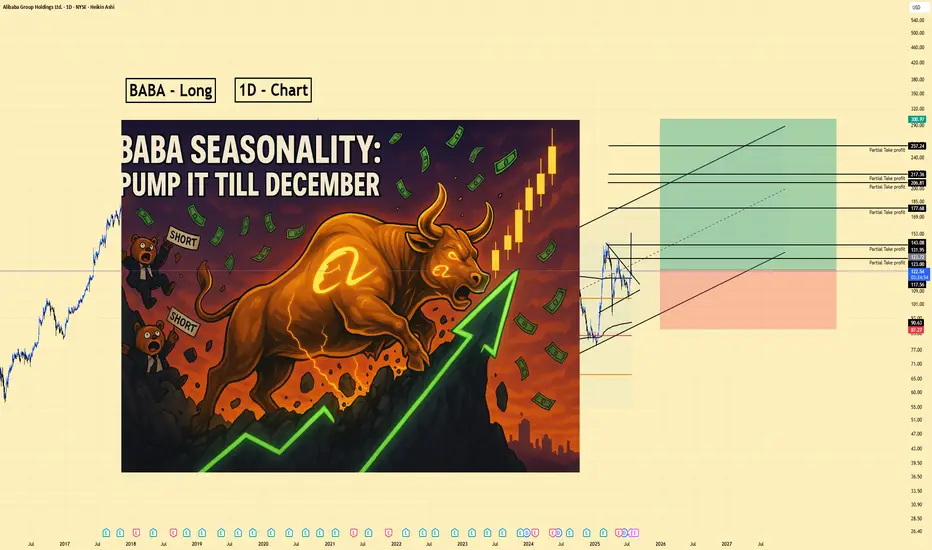
BABA | Long | Strong AI & Seasonality Tailwinds (July 2025)BABA | Long | Strong AI & Seasonality Tailwinds (Aug 2025)
1️⃣ Quick Insight: Alibaba is showing strong AI-driven momentum, healthy fundamentals, and positive seasonality patterns. August–December tends to be bullish, and the stock is already holding up well despite recent dips.
2️⃣ Trade Parameters:
Bias: Long
Entry: Current price zone (~$123)
Stop Loss: $87
Take Profits:
TP1: $131
TP2: $143
TP3: $177
TP4: $206
TP5: $217
TP6: $257
Extended Target: $300 (if momentum holds through the parallel channel)
3️⃣ Key Notes:
Alibaba’s fundamentals remain solid with revenue up on a yearly basis since 2021, even though some quarters have shown pressure. EPS is expected to grow annually, and institutional interest is strong (43% holding increase by Maridea Wealth Management). The AI pivot with Qwen LLM models and Quark AI glasses launch could be major catalysts. Seasonality supports upside through mid-December before potential reversals.
4️⃣ What to Watch:
AI & cloud revenue performance (Qwen adoption)
Cainiao and other potential spinoff IPOs
Regulatory updates and U.S.-China tensions
Seasonal strength: historically bullish until late November–early December
📊 Outlook: Analysts forecast $150–$160 in the next 12 months (~20–30% upside). Bull case targets range $200–$250 over 3–5 years, with potential extension if AI & international commerce expansions deliver.
Please LIKE 👍, FOLLOW ✅, SHARE 🙌 and COMMENT ✍ if you enjoy this idea! Also share your ideas and charts in the comments section below! This is best way to keep it relevant, support us, keep the content here free and allow the idea to reach as many people as possible.
Disclaimer: This is not financial advice. Always do your own research.
$ INDEX ~ Real Time Elliott Wave UpdatesThis is an update of a $ index chart I had previously posted. We see a Wave 1(Green) completed and a dip occurring. This dip is marked as Wave 2(Green) or Wave A(Blue). It has two readings because it could be a Zigzag, hence 2 or an A of a Flat, hence A. I will offer updates as the wave unfolds. All other analysis remains the same as I had previously posted and can be checked for references. Sentiment still remains buy.

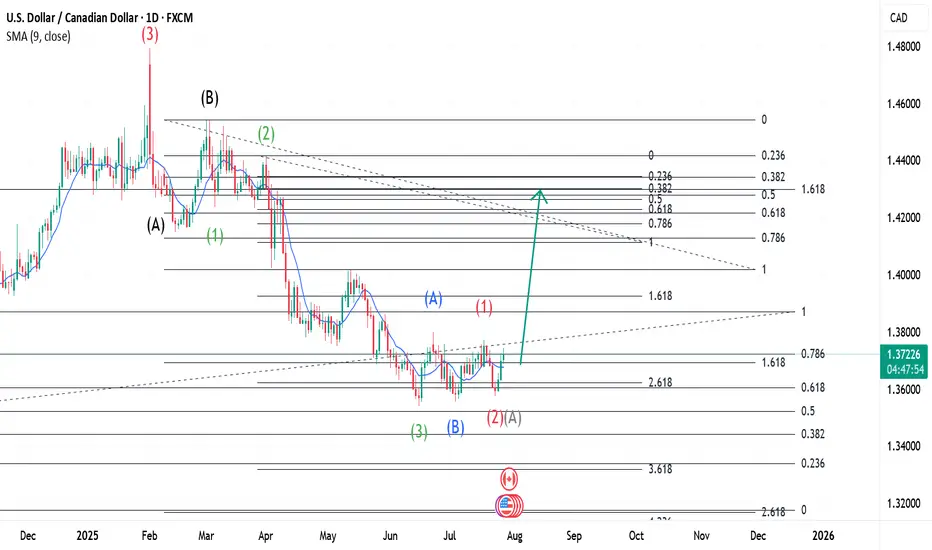
USDCAD ~ Real Time Elliott Wave UpdatesThis is an update of a USDCAD chart I had previously posted. Wave 1(Red) completed and a Wave 2(Red) or Wave A(Grey) has a lso completed. This wave has two readings at the moment because it could be a completed Zigzag or the first Wave of a Flat formation. I will provide updates soon. Analysis remains the same as my previous post and can be used for references. Sentiment still remains buy.