Temporary SELL then BUYAs we said, BIG picture BUY.
Yesterday temporary sell since H1 range was still SELL.
Today H1 range is BULLISH.
We expect temporary SELL from 147.22/42 (After confirmation we will get Snip entry)
TP1: 146.45 (BUY ZONE)
Note: If It will go to BUY ZONE (146.45) first before SELL ZONE (I wont sell)
Beyond Technical Analysis
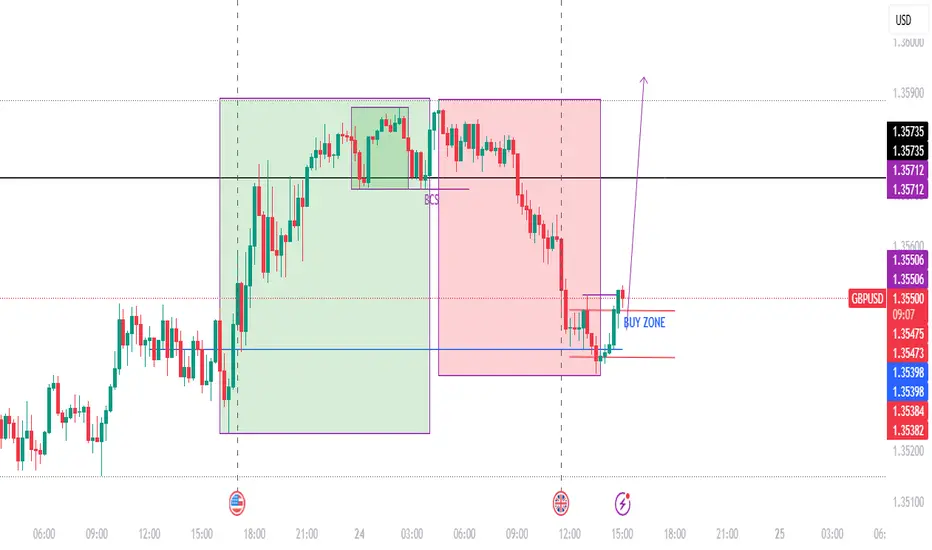
GBPCAD 15M SHORT BUY THEN BIG SELL15m range turn SELL
Note: The 15 SELL is inside BUY range.
So we need to BUY first
WAIT for confirmation around 1.8425. Once done price will bull up to 1.8466-1.8480 before SELL to 1.8380

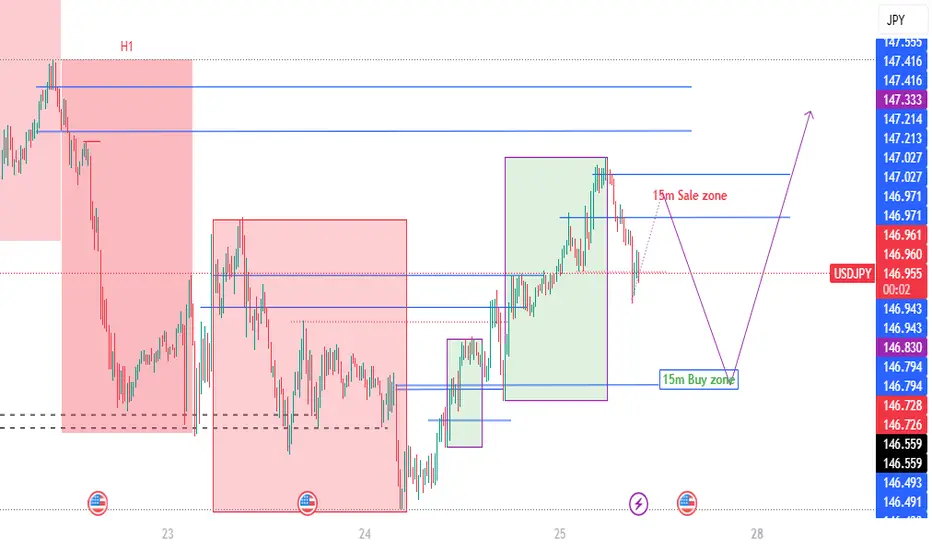
USDJPY Cooking Something – Here's Where I’ll BiteTHE BATTLE OF MY BLUE LINES 📉
The big picture of USDJPY is BUY possible up to 149.35.
I see H1 send me love note to BUY (range) but 15m reject it by forming SELL range.
Conflict? No! This means there is temporary reversal (BEARISH).
Two top BLUE LINES (147.75/85) are where I can SELL my love story. I will first wait H4 to Kiss either of the line. Since 15m SELL range already formed, I ’ll jump in like a love-struck fool (AGGRESSIVE).
TP: Middle BLUE LINE (147.21) = Dating spot for Buyers.
Middle BLUE LINES (147.21, 147.00)
If H4 price come and KISS (touches and leave wick) in either of these, I’m rushing to 15m to catch that BUY breakout.
If H4 price come and CUDDLE (close by body),I’ll cozy up to SELL (after confirmation) and ride it all the way down to 146.42, the Bottom BLUE LINE. 📉
In Bottom BLUE LINE (146.42) = Buyers Chilling Zone
If H4 price come and KISS (touches and leave wick), I’m rushing down to 15m to catch that BUY breakout — love at first touch!
If H4 price come and CUDDLE (close by body), my trading heartbreak season will start!
WISH ME LUCK.!!!

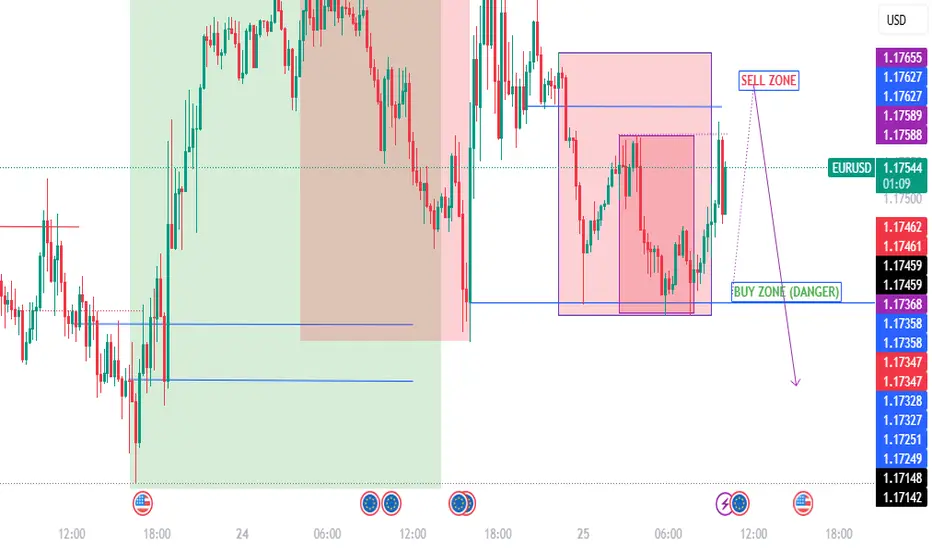
EURUSD TEMPORARY BUY THEN SELLBIG picture SELL
There is Temporary BUY since 15m SELL range swiped to BULL.
The BULLISH can start from 1.1736 (BUY ZONE) (I WONT BUY IF SELL ZONE TAPPED FIRST)
TP: 1.1762 (SELL ZONE)
SELL ZONE (1.1762/1.1770) After confirmation SELL.
TP: 1.1710
Trading balanceTrading balance The price of the asset has rebounded from the balance zone. With the prospect of growth into the resistance zone.

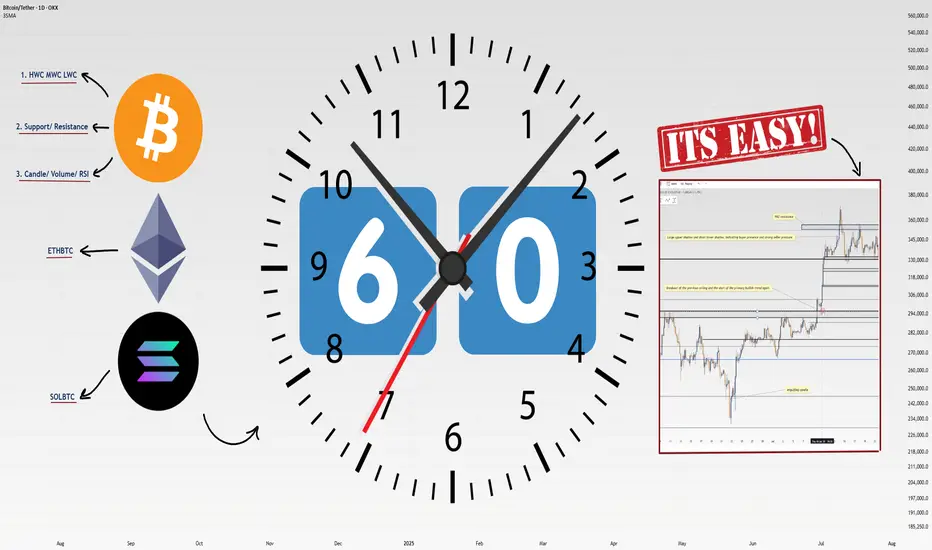
How I Analyze Any Coin in 60 Seconds: 4-Step Masterclass!Heyy traders, it’s Skeptic from Skeptic Lab! 🩵 I’m breaking down my lightning-fast method to analyze any coin in just 60 seconds . This 4-step process is how I spot long/short triggers like a pro. Buckle up, let’s dive in:
✔️ Step 1: Identify HWC/MWC/LWC (10 seconds)
Nature’s got a cool vibe—bet a lot of you hit the outdoors on weekends. When I see an apple tree from afar, it’s majestic, but up close, I spot branches and worm-eaten fruit. From a distance, I miss the details; up close, I lose the tree’s grandeur. Markets work the same. You need different timeframes to grasp the market structure. With practice in Dow Theory, trends, and tools, spotting HWC (Higher Wave Cycle), MWC (Mid Wave Cycle), and LWC (Lower Wave Cycle) becomes second nature. For me, this takes 10 seconds.
Want a full HWC/MWC/LWC guide? Check my free article I wrote a while back—it’s a hands-on tutorial ( link Cycle Mastery ).
📊 Step 2: Draw Support/Resistance Lines (20–30 seconds)
I start with higher timeframes: Monthly, then Weekly, then Daily. Once I’ve drawn lines up to Daily, I don’t always redraw for lower timeframes—often, I just adjust them.
Pro tip : Give more weight to the right side of the (recent data) since it’s fresher and more valuable. I change line colors for 4-hour lines, so I know they’re less critical than Daily. I don’t draw lines below 4-hour, but if you’re a scalper, tweak this to your strategy. This step takes me 20–30 seconds, the longest part.
📉 Step 3: Analyze Candles, Volume, Oscillators, and Indicators (10–15 seconds)
Here, I check everything I can: candles, volume, oscillators, and indicators . The goal? Stack confirmations for my triggers. Think RSI hitting overbought, volume spikes, larger candle sizes, or momentum surges—you get the vibe. This step’s length depends on your tool mastery. For me, it’s quick because I know what to look for.
🔔 Step 4: Check Coin Dominance (5–10 seconds)
This is the most critical yet simplest step. We need to track where liquidity’s flowing . For example, if SOL/BTC is bearish, I skip buying Solana—liquidity’s exiting. BTC.D (Bitcoin Dominance) is also key. The relationships dominance creates are complex and don’t fit in one analysis, but if you want a full dominance tutorial, drop it in the comments!
🔼 Key Takeaway: Using these 4 steps—HWC/MWC/LWC, support/resistance, candles/indicators, and dominance—I analyze any coin in 60 seconds. Your speed depends on experience and knowledge. If you’re new, this might take 60 minutes per coin, but don’t sweat it— practice makes you lightning-fast . Thanks for vibing with this educational idea! <3 I’ll catch you in the next one—good luck, fam!
💬 Let’s Talk!
Want a dominance tutorial or more tips? Hit the comments, and let’s crush it together! 😊 If this guide lit your fire, smash that boost—it fuels my mission! ✌️
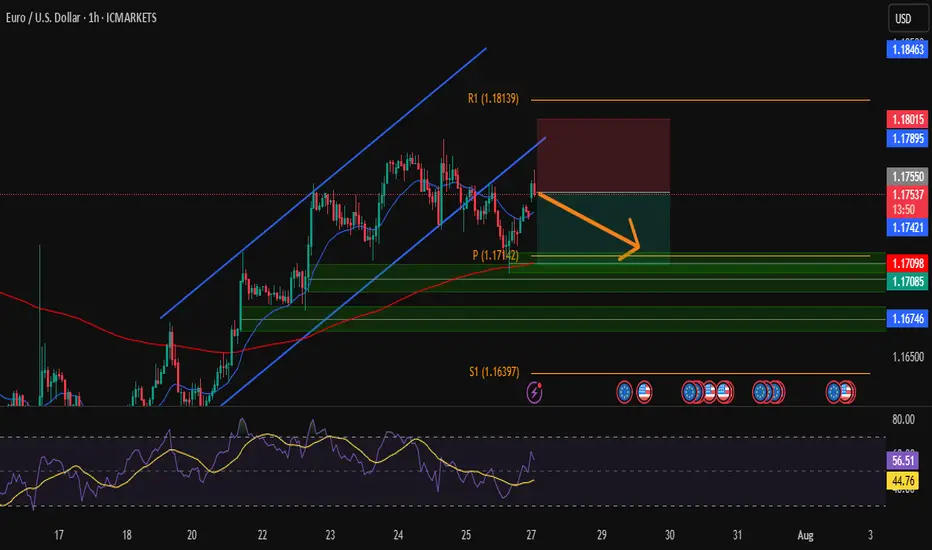
EUR/USD – Short from Channel TopHi Traders , Took a short on EUR/USD after price rejected the top of the ascending channel.
Entry: 1.17545
Stop Loss: 1.18015
Take Profit: 1.17098
📌 Why I took this trade:
Price is showing rejection at the upper trendline + near resistance (R1). RSI is cooling off, so I’m expecting a move back to the demand zone around 1.1710.
Clean structure, low risk, good reward.
Just my take, not financial advice.
What do you think — continuation or rejection?
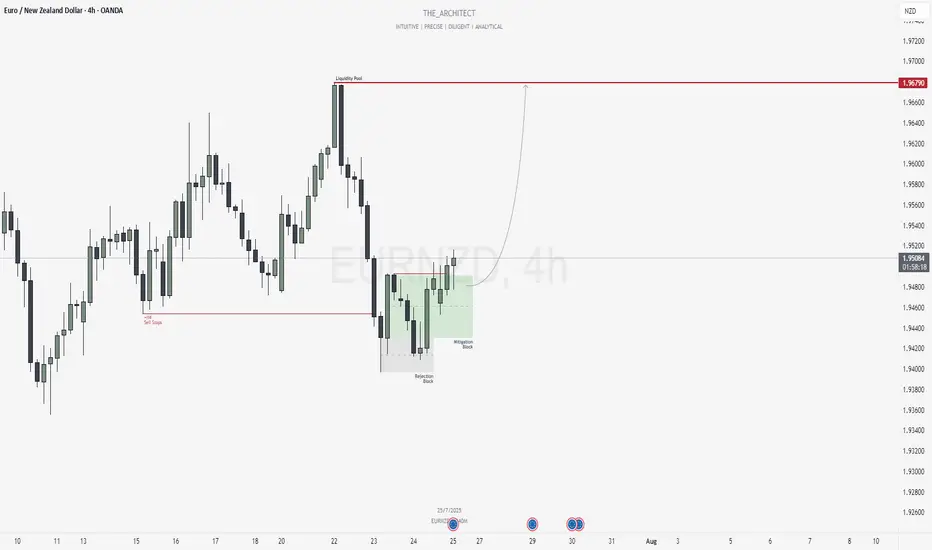
EURNZD: Bullish Shift and Institutional Re-Entry from SupportGreetings Traders,
In today’s analysis of EURNZD, we observe that institutional order flow on the H4 timeframe has recently shifted bullish. This alignment now provides us with a clear bias to seek buying opportunities in line with the predominant higher timeframe trend.
Higher Timeframe Context:
The weekly timeframe is currently delivering bullish order flow. With the recent bullish market structure shift (MSS) on the H4, we now have confluence across both timeframes, which strengthens our confidence in seeking long setups on lower timeframes.
Key Observations on H4:
Sell Stop Raid & Structural Rejection: Price action recently swept sell-side liquidity, a typical behavior indicating institutional order pairing. Following this, price attempted to move lower but failed to break the previous low, instead being supported by a Rejection Block. This led to a bullish market structure shift—our key signal of trend continuation.
Mitigation Block Entry Zone: Price has since retraced into a Mitigation Block—an area where previous institutional selling occurred. The purpose of this pullback is to mitigate earlier positions and initiate fresh buying orders. This now becomes our zone of interest for potential confirmation entries towards the upside.
Trading Plan:
Entry Strategy: Look for lower timeframe confirmation entries within the H4 Mitigation Block.
Target: The objective is to target the H4 liquidity pool residing at premium prices, aligning with the discount-to-premium delivery model.
For a detailed market walkthrough and in-depth execution zones, be sure to watch this week’s Forex Market Breakdown:https://tradingview.sweetlogin.com/chart/EURNZD/BZC9xW1L-July-21-Forex-Outlook-Don-t-Miss-These-High-Reward-Setups/
As always, remain patient and disciplined. Wait for confirmation before executing, and manage your risk accordingly.
Kind Regards,
The Architect 🏛️📈
Analysis on the DXY – EURUSD RelationshipHello traders,
Here’s an analysis that can be useful for both short-term and swing trades on EURUSD and DXY. Our trading team’s calculations are as follows:
Analysis on the DXY – EURUSD Relationship
Currently, DXY is at 98.200. Historical statistical data indicate that if DXY declines toward 96.300, there is approximately a **1.55% probability of an upward move** in EURUSD.
Based on this scenario:
Current EURUSD level: 1.16500
Projected target level:1.1830
While the correlation data show a strong inverse relationship, it’s important to note that periodic deviations can occur in the market. Therefore, this analysis should be considered a statistical projection only, not a guaranteed outcome.

gold on buy reverse#XAUUSD price have multiple reject between the third range, now we expect for breakout to buy.
Above 3339 holds bullish reverse, target 3345-3358. 3345 can reverse back on sell.
Below 3330 on 2 times breakout will drop the price till 3320-3300

We Got The Deal - Time To Sell The NewsOkay, so we have the long-awaited deal between the US and the EU. After a large up-gap was announced last night, it now seems as if a “sell the facts” scenario is unfolding.
Such a wave of selling would also fit in well with the typical seasonal weakness that we often see in the markets from August onwards.
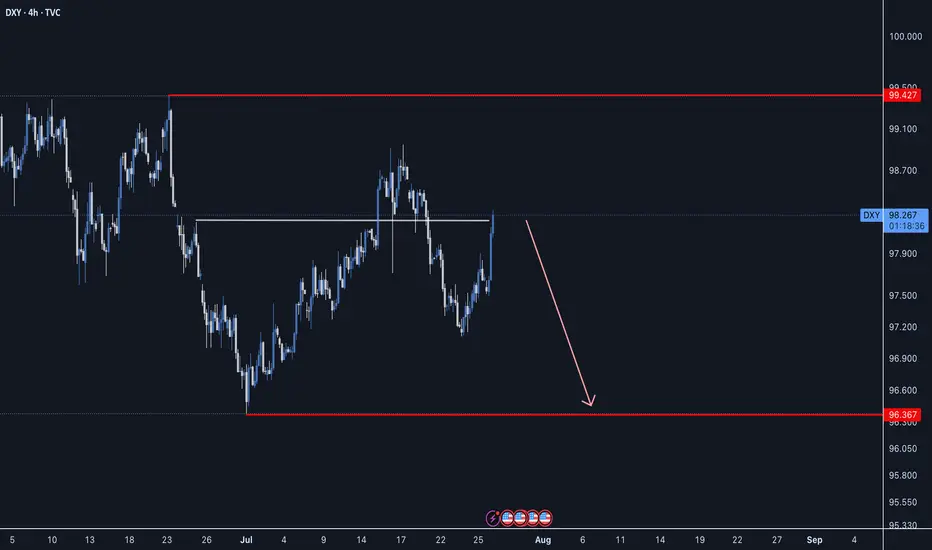
DXY - ABC Move still in playDXY has been moving not so much on technical factors lately but more so with what Mr. Trump says, we still could see a move lower with an ABC pattern.
Good Luck
a bit short then a great long!Hello all. as you see market need a new low and after that it will fly. be happy and earn money right here. I try to fix my bugs and tell what it is better.(wink)
NZDCHF - Can we make it back to previous highs?NZDCHF has been shaping up for the next price movement as bulls strongly rejected any further downside and created a strong reversal impulse which should gain some momentum.
Good Luck

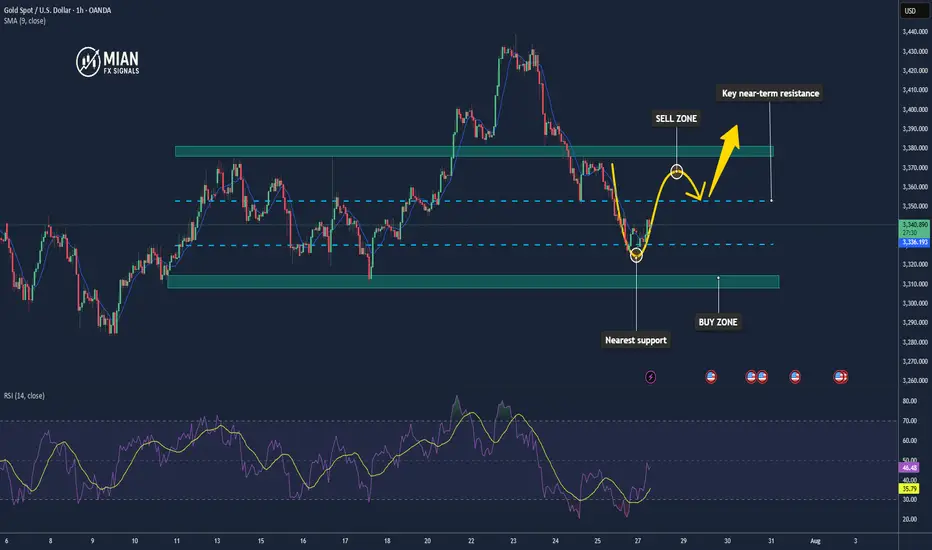
Gold Continues Mild Uptrend – Watching for Reaction at $3351📊 Market Overview:
Gold maintained its bullish momentum during the Asian–European session, rising from $3330 to $3344. A slightly weaker USD and safe-haven demand supported prices. However, price is now approaching a key resistance zone, where technical rejection may occur in the U.S. session.
________________________________________
📉 Technical Analysis:
• Key near-term resistance: $3345 – $3351
• Stronger resistance (higher zone): $3360 – $3366 and $3374
• Nearest support: $3335 – $3332
• Stronger support (lower zone): $3322 – $3315
• EMA 09 (H1): Price is above EMA09 → confirms short-term uptrend
• Candlestick / Volume / Momentum:
• Price is consolidating in an ascending triangle
• A breakout above $3345 may target $3360+
• RSI remains below overbought; volume is stable → room for continuation
________________________________________
📌 Outlook:
If gold holds above $3335 and breaks above $3351, the uptrend could extend toward the $3366–$3374 zone. However, failure to break $3351 followed by a drop below $3332 could lead to a deeper pullback toward $3315.
💡 Recommended Trading Strategies:
BUY XAU/USD: $3318 – $3315
🎯 TP: 40/80/200 PIPS
❌ SL: $3321
SELL XAU/USD: $3360 – $3363
🎯 TP: 40/80/200 PIPS
❌ SL: $3357
Semiconductors & SOXL: A Bull ThesisWhy Semiconductors?
Virtually every single electronic device contains some form of a semiconductor unit within its components. The entire Bull theory on semiconductors as an industry could be reduced to this one sentence. The following, however, will introduce concepts contingent to the understanding of what is shaping the market for semiconductors. The weight of intra-industry, political, macroeconomic, and physical factors discerning an inconceivable upside potential for certain investments carrying maximum exposure to the sector, such as AMEX:SOXL . The last section contains my technical approach to trading SOXL.
We begin with the fundamental, and by fundamental, I refer to the simplest reasons for what is happening in the market up until now; [ Early morning Monday, 7/28 ].
Macroeconomic Context
Like essentially the rest of the market, SOXL hit its 1 year low of 7.23 USD on Monday, 4/7, following the announcement (and soon postponement) of global tariffs at levels not observed since the early 30's. This of course sparked a panic spiral in the entire market, leading to outflows from the S&P 500 of approximately 70 billion USD during the month of April. During this time we also saw a new, but familiar narrative emerge. Asset Managers, Such as J.P. Morgan set historically low price targets on the S&P 500, going as low as 5,200 USD. They reinforced their PTs with publications warning investors across the world that the risk of recession in the United States was raised to 80%, and this message was relayed across all media in parabolic fashion. While it does not seem too outward to assume an increased risk of recession due to tariffs by looking back on what we learned of the consequences from the Smoot-Hawley Tariff Act of 1930. There exists a widely overlooked, fundamental , reason as to why I can claim that the REAL risk of recession at the time that J.P. Morgan assigned an 80% risk of recession, was in actuality, 0% (I assume J.P. Morgan knew this but pushed the narrative anyways in order to acquire massive equity at a discount). If anyone has taken introductory macroeconomics in their lifetime, they may be familiar with the function for calculating GDP via the expenditure approach: GDP = C + I + G - NX. Now, why am I referencing high school/college economics basics, the answer to that lies in how we determine our rate of economic growth in the context of tariffs. The part of this formula that we must focus on is NX or Net Exports, the negative factor to GDP. Tariffs, if implemented would effectively decrease import volume, resulting in a smaller Net Exports, and ultimately a higher GDP calculation. Now, what makes this scenario unique, the tariffs having been postponed shortly after their inception, allowed US retailers to engage in front running, or the accelerated purchasing of foreign goods in advance of tariffs. During the month of April, we saw a 5.4% increase in import volume in US west coast ports. This increase in imports effectively caused the inverse impact on GDP growth that import tariffs themselves would have caused: front-running lead to import uptick, leading to a greater Net Exports, which results in lower (negative) GDP growth. Essentially, tariffs in the short-term increases GDP growth (in the long term deadweight loss, and cost structure distortion comes in to play, but that doesn't matter yet), however , tariffs that are announced but not immediately implemented will result in a lower GDP growth, coupled with uncertainty surrounding the whole situation that translated into a cut in CapEx as companies scrambled to determine if tariffs would f*ck them over or not. This argument is further supported by the trends observed in the foreign exchange market. You may have heard in the news that we are experiencing a period of "Dollar Weakness", and while, yes, you can clearly see that the USD has fared rather poorly against other currencies in most major dollar pairs over the past few months. The agent behind this isn't just that the dollar happens to be weak, it is a combination of factors that generate noise and volatility in the forex market. The two main factors highlighted by the media are 1. The obvious political policy instability, pushing bond yields higher, plus a significant debt ceiling raise as per the BBB and 2. the expectations of interest rate cuts over the next year. The other, less recognized major factor to dollar weakness is exactly what we described above: Increased imports means more dollars flowing out of the economy. When these dollars land abroad, they are converted into the native currency, driving down the demand for the dollar. Notice how none of the reasons described above, actually have anything to do with what truly drives foreign exchange markets. Over time, the strength/weakness of a currency is directly correlated to the strength/weakness of the underlying economy. To say that we can expect dollar weakness due to the aforementioned reasons outright ignores the economic growth potential that exists in our economy at this current time, subsiding the out-of-proportion tariff fears as a proponent to an economic crisis. In an all-encompassing view, what I would describe to be occurring on the macro level is a sort of "slingshot" effect: Trade imbalances and private sector response to policy unclarity results in a pullback in economic growth, one that we are now experiencing as a short-term effect. From a medium-long term perspective, assuming that tariffs aren't persistent in the long term, we would see full fledge economic boom, driven by non other than the growth of our technology sector, which at it's core, lies the almighty semiconductor.
Growth of AI as a driver of Semiconductor demand: Stable trajectory or Bubble Territory?
Having laid the economic framework for picking the general direction our market is heading in, we can now begin to talk about the internal combustion occurring within the world of technology, and the two letter term associated with just about every cool thing in the business world, that is of course AI. Now just to clarify, AI is not new, its been around for at least 20 years and has a well established role in the world prior to the existence of ChatGPT. What changed so drastically in recent years is the breakthrough into a new form of artificial intelligence, known as "Artificial General Intelligence" or AGI. Long story short: AGI's primary difference in the business context is the colossal amount of electrical infrastructure and computing power that is demanded by the development of these mega language models. As a result of the high barrier for entry to this new industry, only 5 AGI companies have arisen to the global stage: OpenAI, Google DeepMind, Anthropic, Microsoft, and DeepSeek. Increasing competition in this space through more players entering the market is unlikely at this time as the cost to create a standalone AGI model is so astronomical. This is a particularly good thing because it tells us that AGI as an industry can result in natural monopolies. The ultra-intensive RnD costs and Data Center infrastructure demands make it more sensical to have a greater number of resources dedicated to producing 1 AGI model, instead of dividing resources to develop multiple less optimized models (similar to how a water company holds a natural monopoly as competition in that industry would result in no foreseeable benefit to it's customers). A further effect from this dynamic lies in how businesses in this industry scale to expand, and its pretty straightforward: the more megawatt computing power a model can access, the more parameters a model can account for, and the more vast the dataset that model can train on, with enhancing speed and efficiency (GPT 4o takes into account >500B parameters in a given query). We see the concept of natural monopoly playing out as the concentration of market capitalization is becoming more extreme where firms like Google, Microsoft, and NVIDIA are absorbing larger share of the market, while trading at ever increasing Price/Earnings multiples. To many, this reflects a trend we saw during the dot com bubble, however what makes the AGI industry different is the nature of the good or service provided. During the dot com boom, companies saw speculative value based on only the fact that their business existed on the .com domain. We know that each of these businesses are unique, providing a good or service across whatever industry they were part of, the only thing having in common was that dot com. The major oversight that took place during the turn of the dot com era was that the success of these businesses wasn't in truth due to them ending in .com, but whether the idea, and execution behind the underlying business is strong or not. Like how Amazon and Facebook saw unparalleled success not just because they were .coms, but because they were pioneering business models that would attract global demand to the services they were providing. The business of AGI has a sort of homogenous property. All AGI companies produce a service that is extremely similar in nature, the only ways they can compete with one another is through Capital Expenditure towards harnessing more computing power. This is the main reason capital is concentrating in a handful of companies trading at high multiples. To me, this is not an indication of a tech bubble but rather a product of how the AGI industry is poised to grow within our economy.
AGI as a Factor of Production
To get even more philosophical, we can think about how AGI itself enhances economic growth. We already see AGI tools applied in various ways, but the most widespread application pertains to the enhancement of human capital. While it is possible to make AGI models complete ongoing tasks completely on their own with zero human input, its far more common to see AGI tools be used, well, as tools. What I mean is that firms are not looking to replace human workers with AI ones (certain exceptions may include the manufacturing industry), instead they want to integrate AGI tools into their workforce as a means of optimizing regular processes, allowing them to access and process information with tremendous efficiency. The most observable economic outcome of this is firms being able to cut costs in human capital requirements, allowing them to achieve the same level of workflow with a smaller number of employees, or outsourcing solutions to business processes by way of automation utilizing AGI. The possibilities are endless and the economic impact of AGI appears to write itself new economic theory to explain how business growth is accelerating in unprecedented ways.
Semiconductor Physical Limitations: Blessing or Burden?
In 1965, Gordon Moore articulated his observation which would come to be known as Moore's Law. He observed that the number of transistors in an integrated circuit doubles approximately every 2 years. Based not so much on law of physics, Moore's law describes an empirical relationship between time and the number of transistors per chip, suggesting that the rate of production advancements would allow for such doubling to occur on a biannual basis. And to Gordon's own surprise, he was right. Transistor count for a given chip roughly doubled every 2 years for the following 50 years. However, Gordon also predicted that Moore's Law would come to an end in 2025, where transistor sizes would reach the physical limit of 2 nanometers (10-15 silicon atoms in width). While it may appear as a bottleneck to the semiconductor and AI industry, not being able to fit anymore transistors on one chip, but in reality, this limitation pressures companies to pursue innovations such as semiconductor packaging, which is NVIDIA's bread and butter. This technique allows for the stacking and integrating of many different chips to perform together as one. This technology has already proven wildly successful and is the backbone to virtually all of NVIDIA's GPU products. Google has invented their own method to getting around the physical limitation of silicon chips, producing AI-specialized integrated circuits known as Tensor Processing Units (TPUs). Catering these innovative solutions to expanding the frontier of AGI is almost a given.
How to play this market: A Technical Approach
If you have made it this far, I commend you. The following describes my approach to analyzing price activity in SOXL:
My First entry into SOXL took place on 5/30 with a unit cost of 16.50 USD. Two things can be noted prior to this entry. 1: Fund flows during late February, into March, and through April were extremely high, net inflow of 6.85 Billion USD, however price movement did not reflect the huge inflow until late April/early May where we began to see upward price direction. The beginning of June marked the start of the market bull rally which consolidated into our current price range of 25-28 USD, following contingent earnings releases of NASDAQ:ASML , NYSE:TSM , NASDAQ:NXPI and NASDAQ:INTC . The most recent pullback was a combination of a slightly concerning outlook from ASML, stating that tariffs on the EU would negatively affect projected sales growth for the 2026 fiscal year. As for TSM, there is not one concerning thing that could be said regarding the state of its business growth other than the New Taiwan Dollar gaining considerable strength over the USD amid trade relations between the US and Taiwan, affecting TSM's gross margin by an estimated 6%. NXPI released a sub par earnings and revenue growth outlook, but in my opinion this is not to be too heavily objectified as NXPI produces chips primarily for the Automotive sector, thus making it's sales heavily contingent on supply chain issues being faced by automotive manufacturers in leu of tariffs. NXPI carries a 3.5% market share in semiconductors whereas TSM carries a 68% market share. Lastly, INTC, earnings release I am almost embarrassed to talk about. If it were up to me I'd say they sell their plants in Ohio to TSM and look into opening a fruit stand instead. The most important earnings releases have yet to come though. NASDAQ:MSFT is just around the corner on 7/30, and NASDAQ:NVDA announces on 8/27. These two earnings reports will carry major weight in hinting the overall direction, momentum the market sees in AI demand growth, and the technology sector as a whole. Speculating, I have high expectations that both MSFT and NVDA will top all estimates, pushing the bar higher for 2025 into 2026.
If we look at our short-term 50-day SMA/EMA, you will notice a crossover occur on 5/6, a minor indication of a short term positive trend. Alone this is insignificant, but if we look at our 14-day Average True Range, we can see that this crossover aligns with a fall in ATR that would persist between the values of 1.37 and 1.59. This low ATR value signals that trailing volatility is actually quite low for semiconductors, considering the currently mixed market sentiment. Further along we see that price has crossed above both our long-term, 200-day SMA/EMA and a crossover occurred between the two on 7/23, serving as a small indication of a positive long term trend. Once again, not super significant on its own, but you will notice that the convergence aligns perfectly with a sharp increase in fund inflows, netting 491 Million USD in a matter of 3 trading days. If we see a continuation of net inflows over the several days, we can expect a near future extension of our bull rally, a semi-cyclical wave of inflows that concentrate during consolidation periods (which we have seen take place in the current price range between 25-28 USD following my first exit at 27.50 USD). If we extrapolate both our short-term and long-term SMA/EMA, we can anticipate a crossover to occur in the coming days to weeks. If this occurred, that would further reinforce our expectation for a positive long term trend. I have already locked in my entry 2 with a limit order executed at 25 USD. If all of the above conditions are met, I would confidently predict that we may see SOXL trade at around 42 USD in the coming months.
One more thing I would like to note, if we zoom out to our 5 year historical price progression, we can identify the previous high of 70.08 USD occurring on 7/11/2024. We know that the bull rally which took place in July of last year can be attributed to the first realization of AI as a driver for semiconductor demand, combined with renewed interest in GPU technology for applications in crypto. If we compare AI-related Capital Expenditure in fiscal year 2024 to AI-related Capital Expenditure of the first half of 2025 fiscal year: 246 Billion USD made up AI-related CapEx for all of 2024, vs first 6 months of 2025, adding up to 320 Billion USD. That is a 30% increase in capex, and we still have another 5-6 months to go. Just some food for thought.
Do you believe all of the above has been priced into SOXL, leave your thoughts in the comments!
Disclaimer
You must obviously keep in mind, SOXL is a 3x leveraged ETF, you can expect volatility with such type of investment. However, in capturing a bullish market, a 3x leveraged investment may produce greater than 3x the returns as the underlying (non leveraged) assets, due to the effect of compounding growth of returns over time. However, the same is true for sideways, or bearish markets, losses may be amplified to greater than 3x. If this is an uncertainty you do not wish to be exposed to, I would opt for the non-leveraged Semiconductor ETF ( NASDAQ:SOXX ), or divide your allocation across the top 5-10 equity holdings of SOXL. Please remember to employ your OWN due diligence before making any investment decision, as none of what I am saying shall serve as financial advise to you, the reader.

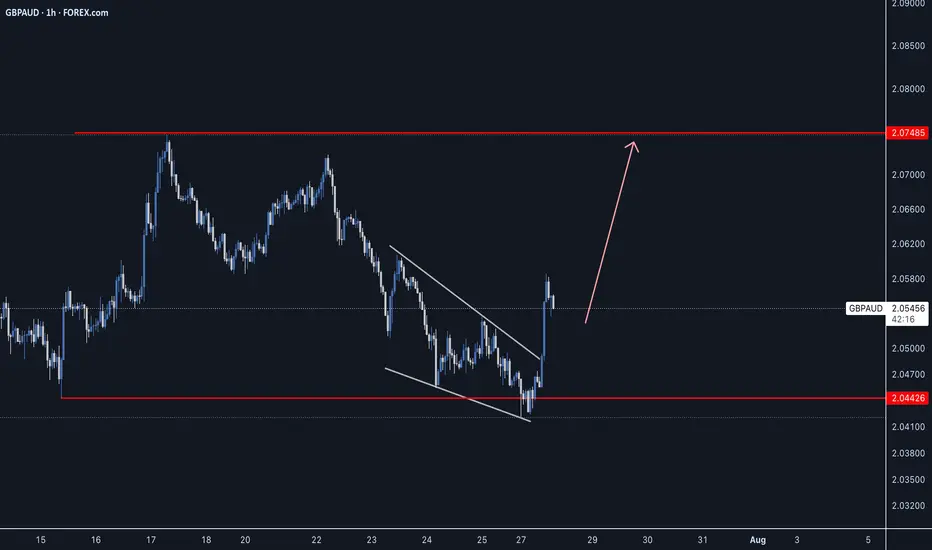
GBPAUD - Bullish Price Action GBPAUD broke out of a reversal structure with a double bottom confluence. Expecting further growth for a long opportunity.
Good Luck
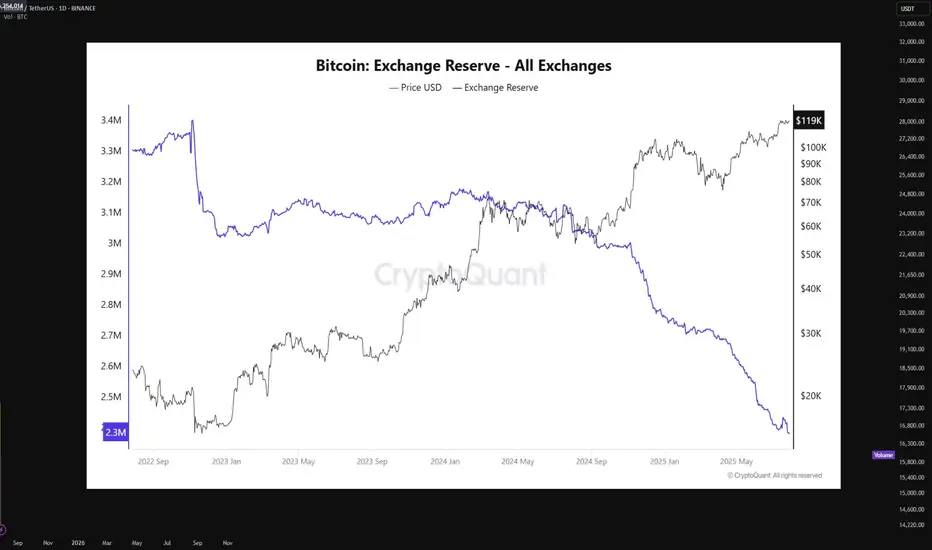
Bitcoin supply on exchanges is at an all-time lowBitcoin is currently undergoing a textbook supply-side shock, a rare phenomenon that historically precedes vertical price expansion. The latest on-chain data from CryptoQuant shows that BTC exchange reserves have declined to an all-time low of just 2.3 million BTC, down from approximately 3.3 million BTC in mid-2022. This marks a 27% drop in immediately sellable supply — a net outflow of over 900,000 BTC from centralized exchanges.
This trend signifies that a substantial portion of BTC holders have opted for long-term self-custody, indicating growing conviction among market participants. When coins leave exchanges, they are typically sent to cold wallets for long-term storage, effectively removing them from the liquid supply pool. This restricts the ability for large-volume sell orders to materialize, especially during rapid price appreciation, thereby creating a supply squeeze.
In parallel, the price of Bitcoin has risen steadily, now trading around $119,000, with a clear break above prior resistance clusters in the $75K–$85K zone. The price has shown strong momentum divergence against exchange reserves, with reserves falling while price rallies, a bullish continuation signal. This decoupling indicates aggressive spot accumulation in the background, often a signal of institutional or whale-level interest.
Technically, BTC is also showing signs of a parabolic structure forming, supported by rising volume on upward moves and decreasing volume on retracements — confirming bullish market structure. Price action has respected key Fibonacci levels throughout the rally, and is currently pressing into a price discovery phase with minimal historical resistance above.
The macro backdrop further supports this narrative. With Bitcoin ETFs now live and facilitating regulated inflows, capital has increasingly favored BTC as a store-of-value hedge amid fiat debasement and monetary policy uncertainty. Combined with the 2024 halving, which cut block rewards from 6.25 to 3.125 BTC per block, new supply issuance has halved, while demand remains elevated.
When supply dries up — as it clearly is — and demand persists or increases, price must equilibrate higher. This is a fundamental economic principle now playing out in real-time. The current environment mirrors late 2020 to early 2021, when a similar supply drop from exchanges preceded Bitcoin’s rally from $20K to $64K.
In summary, Bitcoin is entering a phase of constrained supply coupled with aggressive demand, pushing the asset toward price discovery territory. With on-chain reserves at historic lows, minimal overhead resistance, and strong macro alignment, the technicals now point to a structurally bullish setup.
If this trend persists, a sustained breakout beyond $120K could trigger a feedback loop of FOMO-driven spot bids, further deepening the supply shock and accelerating the next leg of the bull cycle.
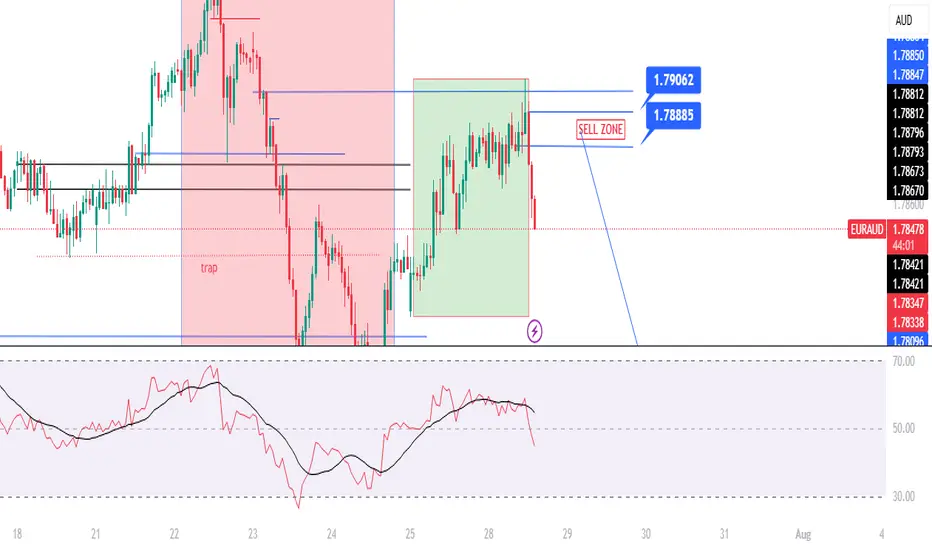
EURAUD | One Kiss from 1.7906 and I’m In – TP 140 Pips!The big picture of EURAUD is SELL possible up to 1.7750
Spot that H1 BUY range?
Inside it, there is conflict. A sneaky SELL range form inside it after rejection H4 BLUE LINE.
See that top blue line at 1.7916?
It got a gentle kiss from the H4 candle (REJECTION).
Then H1 already whispered, "a sweet breakout"!
📌LONG STORY SHORT, I'M SELL AROUND 1.7888 - 7906
If H4 comes and kisses one of the line (just a touch and wick), I’m SELLING — no more playing hard to get. 😘
Other wise, I’ll quietly cry in the corner
TP? 1.7750 — that’s a sweet 140-candlelit dinner!
WISH ME LUCK...!!!
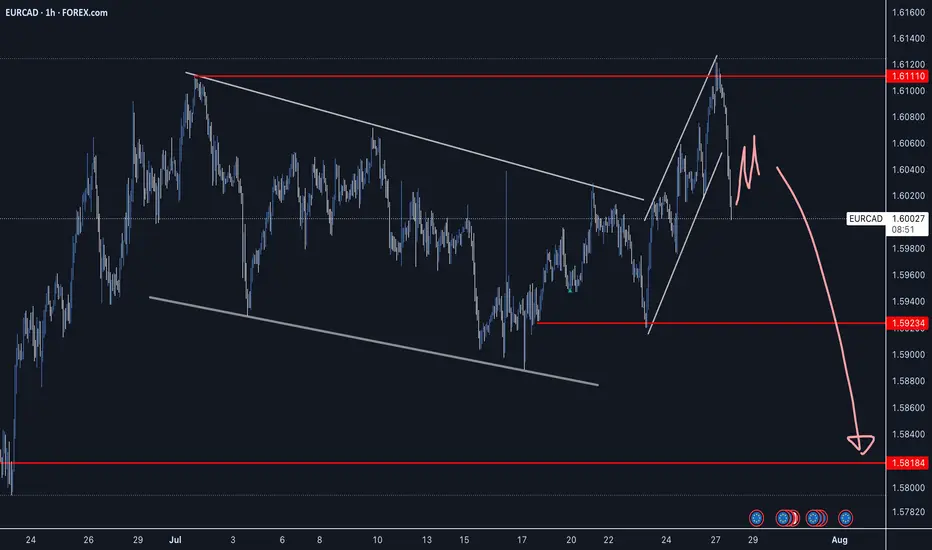
EURCAD - Strong Reversal Impulse off Double TopEURCAD has created bearish price action with a strong reversal impulse pushing down from the double top level. Waiting for a continuation to confirm a sell opportunity with a good R:R.
Good Luck
Bitcoin Cycles Signal Major Move — BIT500 on What Comes NextBitcoin’s historical price action is known for its cyclical behavior — driven not only by supply dynamics like halving events, but also by global macroeconomic forces. This week, leading crypto macro analyst TechDev released a widely discussed model projecting that Bitcoin may be entering a new explosive phase, closely linked to a shift in monetary policy, global liquidity cycles, and risk asset rotation.
At BIT500, we see this as more than a theory — it’s a playbook. Understanding macro-driven crypto cycles gives institutional and high-net-worth investors a clear advantage. And, when used properly, it can become the foundation for consistent alpha generation in the digital asset space.
TechDev’s Model: Liquidity as the True Driver
According to TechDev, Bitcoin’s major uptrends are synchronized with global liquidity expansions. In particular, the model links Bitcoin price surges with:
Falling real interest rates,
Expanding global M2 money supply,
Weakening U.S. dollar (DXY decline).
This pattern played out in 2016–2017 and again in 2020–2021. As global central banks prepare to shift toward more accommodative policies — especially amid slowing GDP growth and rising debt burdens — similar conditions may be taking shape for late 2025 and into 2026.
BIT500 analysts agree: the macro landscape is increasingly favorable for risk-on positioning, especially in hard assets like Bitcoin.
On-Chain Indicators Confirm the Thesis
Supporting the macro thesis is a growing set of on-chain signals. Our internal models — as well as public indicators like Dormancy Flow, MVRV ratio, and Realized Cap metrics — show long-term holders are accumulating, while short-term holder activity has flattened.
The decline in exchange reserves, increased self-custody trends, and decreased miner selling pressure all align with prior pre-bull market phases. This combination of tightening supply and macro liquidity can act as fuel for the next leg up — one that could catch passive investors off-guard.
How BIT500 Capitalizes on Bitcoin Cycles
At BIT500, we convert insights into execution. Our team applies cycle-based, quantitative strategies to capture asymmetric upside while managing downside risk.
Here’s how we turn macro analysis into market performance:
Phased Capital Deployment
We deploy capital in staggered allocations, entering during compression phases and scaling in as trend confirmation emerges — minimizing exposure during volatility and maximizing return during expansions.
Volatility Harvesting
We implement delta-neutral and volatility-arbitrage strategies across Bitcoin derivatives markets, generating income in all phases of the cycle — especially when price is range-bound.
Multi-Asset Rotation Models
Based on cyclical rotation, we dynamically adjust exposure between Bitcoin, Ethereum, and select altcoins. These models are tested to outperform static portfolios across halving-based and macro cycles.
Custom Risk Monitoring Systems
BIT500 clients benefit from our proprietary Cycle Risk Dashboard, which sends alerts when market structure shifts — enabling proactive rebalancing rather than reactive trading.
Conclusion
Bitcoin’s next major price movement is likely to be shaped not just by crypto-native factors, but by broader shifts in global liquidity, interest rates, and investor sentiment. TechDev’s research confirms what BIT500 has long modeled — that understanding economic cycles is key to anticipating large-scale Bitcoin breakouts.
For investors seeking not just exposure but performance, the coming months represent a rare window of opportunity. At BIT500, we don’t just track cycles — we build strategies to monetize them with discipline and precision.
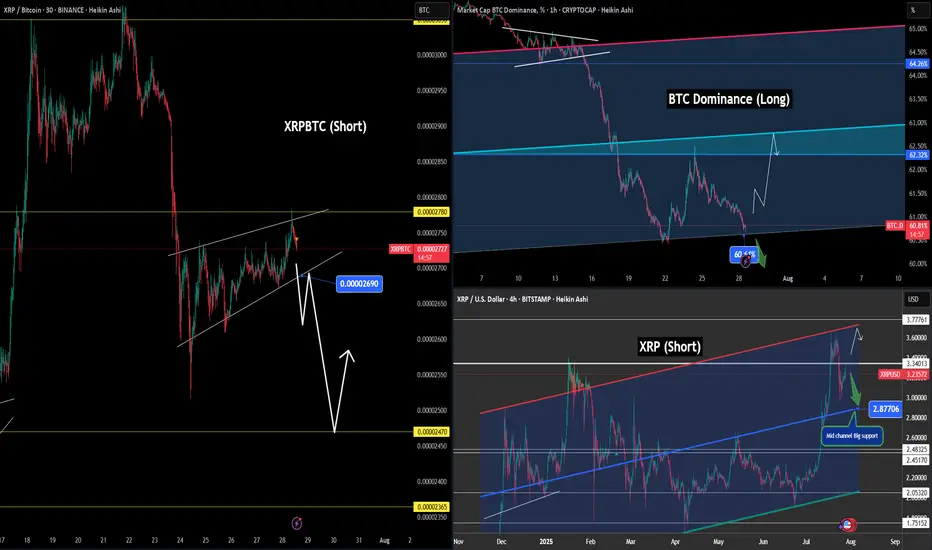
XRP Structure with Bitcoin Dominance - (Hedge is Edge)📉📊 Mastering XRP Structure with Bitcoin Dominance - (Hedge is Edge) 🧠⚖️
Hey guys, I just posted the video — so you can hear the full breakdown there. 🔊🎥
This time, I'm also sharing the charts here to support the lesson and give you a clear visual on the educational idea. Let’s break it down:
🔍 XRP/BTC – Short Bias
We’re at a clean rejection point around 0.00002780, with a wedge formation breaking lower. First support target sits around 0.00002690, with 0.00002470 and even 0.00002365 possible if the move deepens. Invalidation sits just above that yellow resistance — always define your risk.
📈 Bitcoin Dominance – Long Bias
BTC dominance is resting on solid support around 60.61% . A bounce here typically signals Bitcoin outperformance — either BTC rising faster than alts or BTC holding while alts bleed. Either way, it adds pressure to the XRP side of this setup.
💸 XRP/USD – Short Bias
Rejection off the top of a long-term channel, with price pushing down. The next key level is $2.87, the midline of the channel. Until price breaks and holds above $3.34, the structure leans bearish.
♟️ Hedge is Edge
What does this setup teach us?
🔹 Long BTC (structure + dominance support)
🔹 Short XRP (multiple confirmations of weakness)
This hedge reduces directional exposure and allows for a calculated trade, based on structure — not hope.
🧠 The big takeaway: trading isn't about predictions. It's about aligning logic, risk, and market structure into something that makes sense.
Check out the video above to hear the full breakdown. (Audio won’t play inside TradingView — sorry about that — but it’s all explained there.)
One Love,
The FX PROFESSOR 💙
Disclosure: I am happy to be part of the Trade Nation's Influencer program and receive a monthly fee for using their TradingView charts in my analysis. Awesome broker, where the trader really comes first! 🌟🤝📈