Mastering XRP Structure with Bitcoin Dominance - (Hedge is Edge)📉📊 Mastering XRP Structure with Bitcoin Dominance - Educational Breakdown 🧠💡
Hey traders! FXPROFESSOR here 👨🏫
From now on, my TradingView Crypto posts will be 100% educational only . I won’t be sharing target charts or trade setups here anymore. Why? Because even with the best chart, most traders still struggle to execute properly. So instead, I’ll teach you how to think, read, and act like a real trader.
👉Let’s jump into today’s educational case:
🔍 Chart 1: XRP/BTC
We're facing a clear resistance zone around 0.00002780, rejecting after several tests. There’s also a wedge pattern forming, suggesting a drop is likely — possibly toward 0.00002690 or even further to the unchecked support at 0.00002469. That’s a 9.4% move — but remember, this becomes invalidated if XRP breaks back above 0.00002780.
🔍 Chart 2: Bitcoin Dominance
Dominance is sitting right on support. If BTC dominance rises, it means Bitcoin could gain strength relative to altcoins. This typically leads to:
BTC holding steady or rising
Some major Alts (like XRP) might correct
Watch this carefully — a BTC dominance rebound strengthens the XRP short thesis.
🔍 Chart 3: XRP/USD
XRP/USD is moving inside a large wedge formation. The current rejection level is around $3.34, with price possibly aiming for $2.88 or lower if the wedge plays out. Until we break above that resistance, the bias remains bearish.
🎯 Strategy Insight – The Hedge
What’s a calculated way to play this setup?
→ Go long Bitcoin (dominance at support)
→ Go short XRP (at resistance)
This way, you hedge your exposure while staying aligned with market structure. This is not financial advice — but a great exercise in developing strategic thinking.
📌 Remember: Managing the position is a whole different skill — one that you must learn through real-time practice and proper mentorship. But the charts today give you valuable food for thought to sharpen your edge.
Let’s stop gambling and start thinking like traders. No hype. No signals. Just structure, context, and logic.
One Love,
The FX PROFESSOR 💙
Disclosure: I am happy to be part of the Trade Nation's Influencer program and receive a monthly fee for using their TradingView charts in my analysis. Awesome broker, where the trader really comes first! 🌟🤝📈
Beyond Technical Analysis

SUI Price Idea
Be Carefull and Full Patient on SUI today because if the price break and closing under Choch Line the probability to go down is possible, but if break the line without closing below the line we can wait for the choch on the low Time Frame for buy opportunity
#staysafu

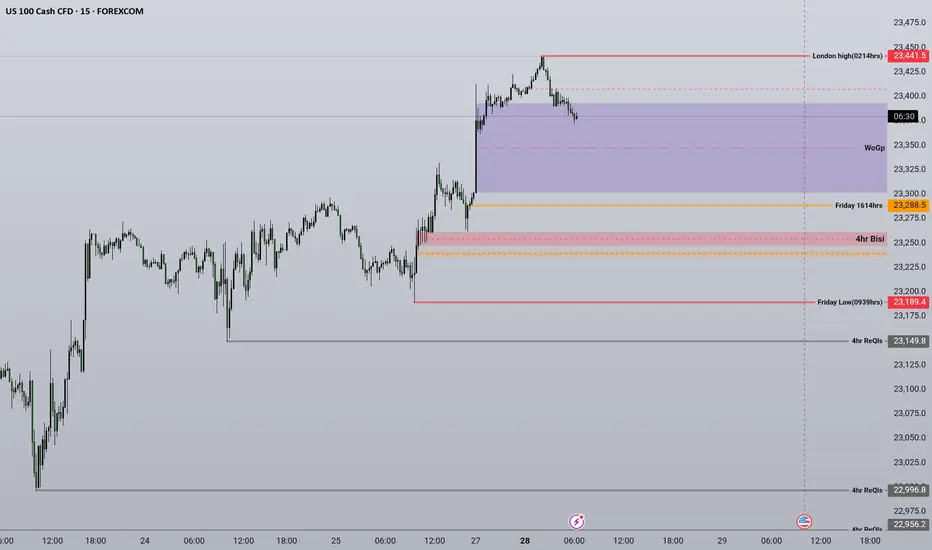
Weekly UpdateBased on how the previous weeks have been running, closing bearish is my anticipation looking into the new Month. Today i will sit out and observe.
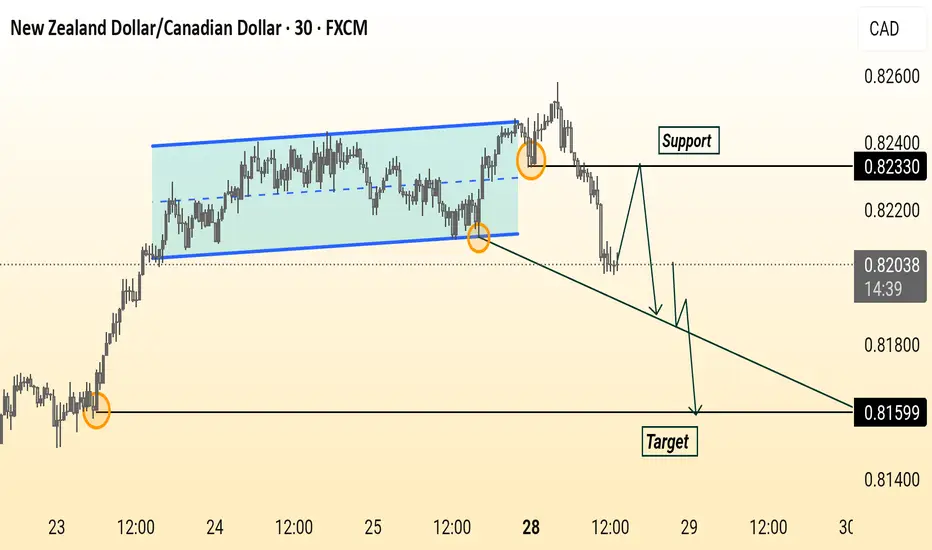
NZD/CAD Setup Price broke below the consolidation channel, retested the support at 0.82330, and is expected to continue down toward the target at 0.81599. Bearish momentum is in play.
Understanding Wedge Patterns - A Real Bitcoin Case Study🎓📊 Understanding Wedge Patterns - A Real Bitcoin Case Study 🧠📈
Hi everyone, FXPROFESSOR here 👨🏫
From this moment forward, I will no longer be posting targets or trade setups here on TradingView. Instead, I’ll be focusing 100% on education only for here in Tradinfview.
Why? Because over time I’ve learned that even when traders receive the right charts, most still struggle to trade them effectively. So, from now on, FX Professor Crypto content here will be strictly educational — designed to teach you how to read and react to the markets like a professional. Unfortunately I cannot be posting on Tradingview frequent updates like I do all day. Education is always better for you guys. And i am very happy to share here with you what matters the most.
🧩 In today’s post, we dive into one of the most misunderstood formations: the wedge pattern.
Most resources show wedges breaking cleanly up or down — but real price action is messier.
🎥 I recorded a video a few days ago showing exactly how BTC respected a wedge formation.
⚠️ Note: Unfortunately, TradingView doesn’t play the audio of that clip — apologies that you can’t hear the live commentary — but the visuals are clear enough to follow the logic. (there is no advertising of any kind on the video so i hope i don't get banned again - i did make a mistake the last time and will avoid it-the community here is awesome and needs to stay clean and within the rules of TV).
Here’s what happened:
🔸 A clean wedge formed over several days
🔸 We anticipated a fake move to the downside, grabbing liquidity
🔸 BTC rebounded off support around a level marked in advance
🔸 Then price re-entered the wedge, flipping support into resistance
The lesson?
📉 Often price will exit the wedge in the wrong direction first — trapping retail traders — before making the real move. This is a classic liquidity trap strategy, exercised by the 'market'.
💡 Remember:
Wedges often compress price until it "runs out of space"
The initial breakout is often a trap
The true move tends to come after liquidity is taken
The timing of the 'exit' has a lot to do with the direction. In the future we will cover more examples so pay attention.
I stayed long throughout this move because the overall market context remained bullish — and patience paid off.
Let this be a reminder: it’s not about guessing the direction — it’s about understanding the mechanics.
More educational breakdowns to come — keep learning, keep growing.
One Love,
The FX PROFESSOR 💙
Disclosure: I am happy to be part of the Trade Nation's Influencer program and receive a monthly fee for using their TradingView charts in my analysis. Awesome broker, where the trader really comes first! 🌟🤝📈

PENGUUSDTGiven the completion of the movement step and reaching the supply range, with a daily close inside the channel, we can have confirmation for the sell position and follow the price to the bottom of the channel.

Bitcoin Stalls Ahead of Fed and ETF DataAt the time of writing, Bitcoin is trading in a narrow band between $66,000 and $67,800 — showing price stability but lacking directional momentum. This consolidation phase comes ahead of several major catalysts: the upcoming Federal Reserve interest rate decision, quarterly earnings from top tech firms, and updates on inflows and outflows from U.S.-based spot Bitcoin ETFs.
Macroeconomic Pressure: All Eyes on the Fed
The U.S. Federal Reserve will meet on July 31 to discuss interest rates. While most analysts expect the central bank to hold rates steady, markets are focused on the Fed’s tone. Any suggestion of easing or a future rate cut — possibly in Q4 — could trigger renewed appetite for risk assets, including crypto.
Tech Earnings: Nasdaq Sentiment Spillover
Major tech firms including Apple, Amazon, and Google are scheduled to report earnings this week. These reports are closely tied to broader market sentiment, especially for the NASDAQ and S&P 500 — both of which show increasing correlation with crypto. Positive earnings could strengthen risk-on sentiment and give Bitcoin a short-term boost.
ETF Flows: A Silent Market Driver
Since the beginning of the year, spot Bitcoin ETFs have shown mixed behavior — strong inflows in Q1, followed by periods of cooling and outflows. Investors are now awaiting updated flow data from major asset managers like BlackRock and Fidelity to assess whether institutional interest in Bitcoin remains intact.
A return to consistent inflows could serve as a catalyst to push BTC out of its current range. Conversely, continued stagnation or net outflows may trigger a breakdown below $65,000 — a key support level.
Technical View: Calm Before the Storm
According to BBDelta, $66,500 is acting as a short-term equilibrium point between buyers and sellers. Open interest in Bitcoin futures remains elevated, indicating that traders are bracing for significant movement once market catalysts emerge.
Conclusion
Bitcoin is currently in a state of “wait and see,” and the next several days could be pivotal. The convergence of macroeconomic updates, tech-sector earnings, and ETF flow reports is likely to set the tone for crypto markets through August.
For professional investors and active traders, now is the time to prepare. BBDelta advises clients to structure scenario-based strategies, focusing on key levels and volatility hedging. Sideways markets offer opportunities for precision entries, capital protection, and disciplined positioning — all critical before the next major impulse move.

"Analysis of Bitcoin's behavior and actions"Hi there! 😊 I’m Amin, a blockchain expert and crypto trader. Just to clarify, my ideas are purely my personal opinions and not buy or sell signals. 🚀
It seems like Bitcoin might repeat a similar pattern from the past and could potentially reach up to $140K, provided that the economic and political conditions remain stable. 😊

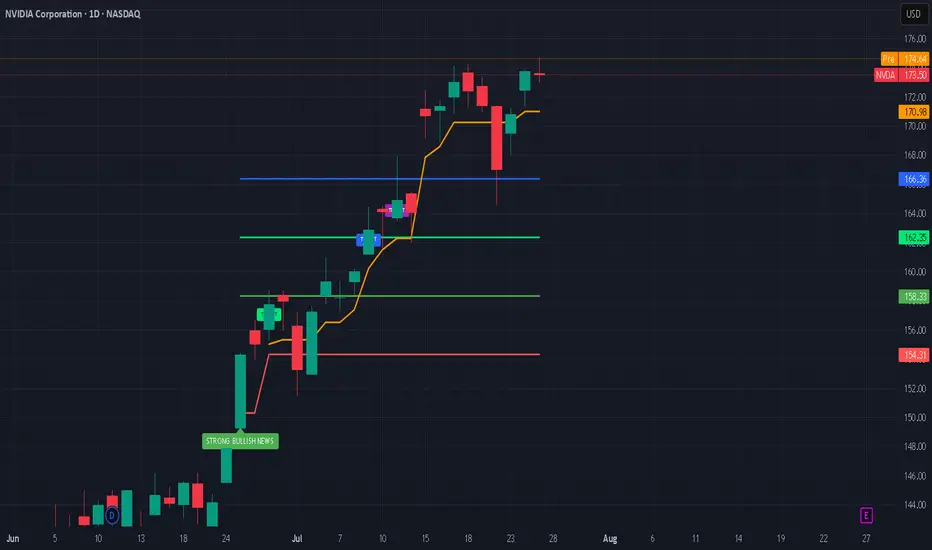
Nvidia’s Historic 2025 Stock Rally: What’s Driving It?Nvidia’s stock has once again captivated Wall Street in 2025, breaking records and fueling debates on whether its blistering momentum will continue or eventually ease. Here’s an in-depth look at why Nvidia is surging, the key drivers behind the rally, and what the long-term future could hold.
Nvidia’s Stock Rally: By the Numbers
As of July 2025, Nvidia stock has rallied more than 39% year-to-date, reaching new all-time highs above $170 and propelling the company’s market cap past $4 trillion, the largest in the world.
The stock has added nearly $2 trillion in valuation since April, outpacing tech giants like Microsoft and Apple.
Analyst price targets for the rest of 2025 vary: the average ranges from ~$174 to ~$235, with bullish forecasts up to $250 and more cautious targets down to $135.
What’s Powering the Rally?
1. Surging AI Demand:
Nvidia remains at the center of the artificial intelligence (AI) boom. Its graphics and AI accelerator chips (notably the new Blackwell AI family) are the backbone of AI infrastructure for Global Tech firms (Amazon, Meta, Microsoft, Google) and cloud service providers. This AI-centric demand has kept revenue growth robust and margins high (approaching 70%).
2. Easing China Trade Fears:
Earlier in 2025, U.S.–China export controls severely restricted Nvidia’s sales of advanced AI chips like the H20 to Chinese customers, causing a temporary selloff. However, a subsequent pause on tariffs by the U.S. and optimism about renewed China shipments reignited investor confidence, helping reverse earlier losses and extending the rally.
3. Massive Tech Investment Cycle:
The global rush to build out AI infrastructure is bringing huge investments from U.S. and international hyperscalers. Meta and Amazon alone have announced plans to pour “hundreds of billions” into AI data centers, much of it destined for Nvidia-powered hardware.
4. Strong Fundamentals and Diversification:
Nvidia sports some of the highest profit margins among mega-cap tech stocks. Its free cash flow, dominant market share, and expanding ecosystem, including platforms like Omniverse (for 3D and digital twins) and Drive (autonomous vehicles)—cement its leadership well beyond just chips.
What Could Slow Nvidia Down?
Despite the excitement, several risks linger:
Valuation Concerns: Nvidia trades at a premium (P/E above 50 for trailing earnings), raising worries of a pullback if growth slows.
Geopolitical and Regulatory Threats: Further U.S.-China tensions, new export regulations, or rising competition from rivals like AMD, Huawei, or custom silicon at cloud giants could erode growth or margins.
Cyclicality of the AI Boom: Some market watchers worry that AI infrastructure spending could prove cyclical, making Nvidia’s revenue growth more volatile in future years.
The Long-Term Outlook (2025 & Beyond)
Bullish Case: Most analysts expect continued dominance for Nvidia as AI, autonomous vehicles, robotics, and edge computing keep growing exponentially. Price targets range as high as $250 for 2025, climbing to $1,000+ by 2030 if AI adoption continues its rapid expansion.
Base Case: Moderate growth continues into 2026–2027, with a price target cluster around $180–$235 (2025) and $200–$428 (2027), assuming AI demand moderates, margins remain stable, and Nvidia fends off competitive threats.
Bearish Case: If U.S.-China relations sour and hyperscaler spending slows, the stock could retest support levels ($135–$150). However, few analysts expect a sustained collapse unless there is a fundamental change in AI or chip technology trends.
#nvda #stockmarket #finance #revenue #profit #financials #economy #technology #ai #chips
Bullish moveI see the setup is confirmed and price may boom in the next couple of weeks.
ABER, as always price do whatever it likes, it might go down deeper for more liquidity from range 3.0$ and 2.8 $
Be cautious, this is not a financial advice, share me your thoughts.

Consistency and reliable performance with real time validationMy cutting edge tech has been put to the test with daily real time validation
It's been correct for over 4 weeks
It's been my mission to defy market odds and revolutionize trading, and with thanks to AI my mission is being fulfilled
I would love to hear your thoughts...or if not, I hope you're getting really excited by what you see

Possible Trend change to the mid 3.30'sAt mid 3.30's is a possible target for the next 48 hours. Let's see if we get a trend change from the 3.25 level.

AUDUSD Engineered to Drop?🧠MJTrading:
📸 Viewing Tip:
🛠️ Some layout elements may shift depending on your screen size.
🔗 View the fixed high-resolution chart here:
🔻 OANDA:AUDUSD – Tagged the Top | Smart Money Eyes Lower Levels??
📍 Perfect Respect of Channel Structure
AUDUSD has just kissed the upper boundary of a long-standing ascending channel, showing sharp rejection — a sign that premium pricing might now shift toward discount levels.
📈 The aggressive push into the highs likely aimed to clear buy stops — fulfilling smart money objectives before a potential reversal.
📉 And here’s the subtle clue:
Just below the last bullish candle lies a thin slide — a structural weakness.
If price breaks and closes below that full body bearish candle (Below 0.66000), the market could slip fast, unleashing a momentum-driven drop into the first liquidity zone (0.6520s).
🧠 For smart money lovers, this is the classic:
Sweep → Trap → Slide
📏 And for fans of parallelism, the chart’s geometry offers a rare beauty — lines in harmony, structure in rhythm, and opportunity in alignment.
🔍 What to Watch For:
Break below 0.66000 (last candle body) = entry signal
0.6520–0.6540: first liquidity zone
0.6400–0.6300: deeper cleanout, if bearish pressure sustains
Inset: DXY bouncing from long-term demand supports bearish thesis
Manage your risk wisely...
For Lower time frame traders:
Psychology Always Matters:
(Click on the pictures for caption and concepts)
#AUDUSD #SmartMoney #LiquiditySweep #ChannelTrading #ChartDesigner #MJTrading #PriceAction #Forex

AUDCAD I Daily CLS I Model 2 I HTF DOL TargetYo Market Warriors ⚔️
Fresh Crypto Analysis— if you’ve been riding with me, you already know:
🎯My system is 100% mechanical. No emotions. No trend lines. No subjective guessing. Working all timeframes. Just precision, structure, and sniper entries.
🧠 What’s CLS?
It’s the real smart money. The invisible hand behind $7T/day — banks, algos, central players.
📍Model 1:
HTF bias based on the daily and weekly candles closes,
Wait for CLS candle to be created and manipulated. Switch to correct LTF and spot CIOD. Enter and target 50% of the CLS candle.
For high probability include Dealing Ranges, Weekly Profiles and CLS Timing.
Analysis done on the Tradenation Charts
Disclosure: I am part of Trade Nation's Influencer program and receive a monthly fee for using their TradingView charts in my analysis.
Trading is like a sport. If you consistently practice you can learn it.
“Adapt what is useful. Reject whats useless and add whats is specifically yours.”
David Perk aka Dave FX Hunter
💬 Comment any Coin I ll give you my quick view

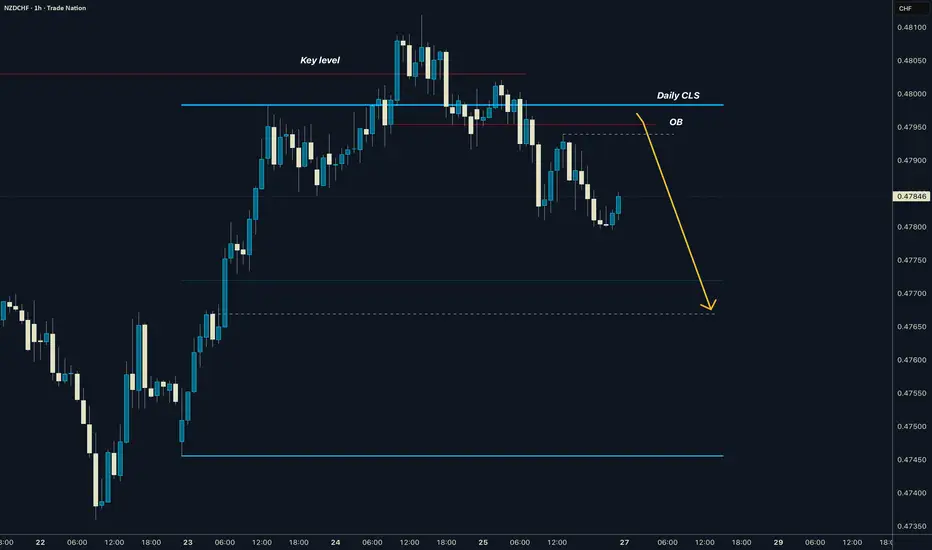
NZDCHF I Daily CLS I Model 1 I Pullback entryYo Market Warriors ⚔️
Fresh Crypto Analysis— if you’ve been riding with me, you already know:
🎯My system is 100% mechanical. No emotions. No trend lines. No subjective guessing. Working all timeframes. Just precision, structure, and sniper entries.
🧠 What’s CLS?
It’s the real smart money. The invisible hand behind $7T/day — banks, algos, central players.
📍Model 1:
HTF bias based on the daily and weekly candles closes,
Wait for CLS candle to be created and manipulated. Switch to correct LTF and spot CIOD. Enter and target 50% of the CLS candle.
For high probability include Dealing Ranges, Weekly Profiles and CLS Timing.
Analysis done on the Tradenation Charts
Disclosure: I am part of Trade Nation's Influencer program and receive a monthly fee for using their TradingView charts in my analysis.
Trading is like a sport. If you consistently practice you can learn it.
“Adapt what is useful. Reject whats useless and add whats is specifically yours.”
David Perk aka Dave FX Hunter
💬 Comment any Coin I ll give you my quick view
Short Term Market Reversal IncomingRetail’s still buying breakouts, but the music just stopped.
This was the rally they weren’t supposed to catch.
Now it’s time to flip the script and bleed it back to origin.
Trading is a very difficult profession. Most people fail, but it's also not impossible. If you don't trade you're a loser.
It's a zero-sum game. 0 1
Zero-sum game is a mathematical representation in game theory and economic theory of a situation that involves two competing entities, where the result is an advantage for one side and an equivalent loss for the other.
It's all just digits on a screen and if they want your money they'll take your money, so you gotta respect your risk management if you don't want to lose everything or you'll have to break the matrix by seeing into the future,
Once you get to see the future. THERE IS NO TURNING BACK.
If you're reading this I hope you're having a great year. This year is all about endings and new beginnings. So stay locked in.
WAGMI
Oh yeah don't forget I gave you guys FX_IDC:EURUSD at 1.03 and FX_IDC:XAGUSD at $22
Nerds

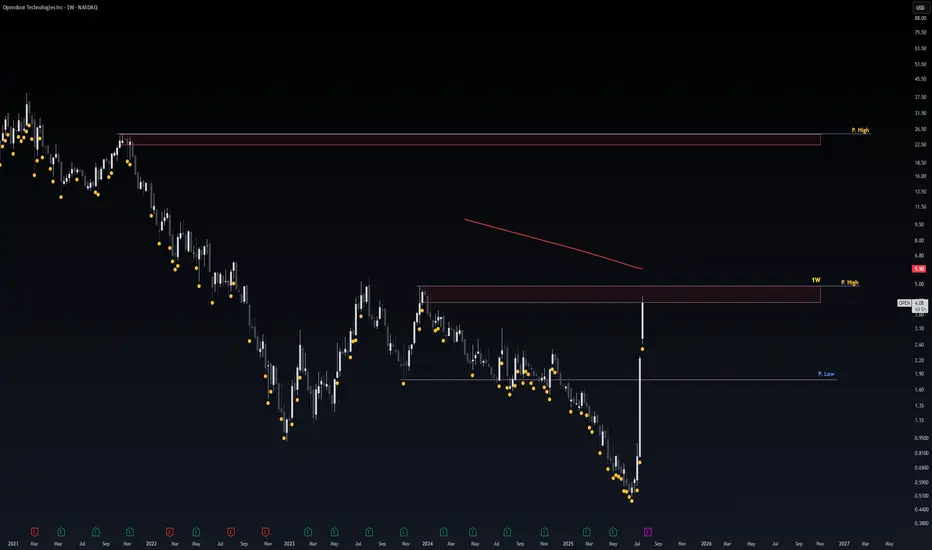
OPEN Risky AF!Sharing my crazy Thoughts ._.
the blue Lines Aka Red Zones consider As Strong Major Resistances and price will respect it !
Either by price Re-test or Reject.
Pink Line Consider As Strong Support level.
MY scenario of upcoming Days.
Stock Reject by Blue Line. and Re-test Pink Line as the support level.
Although anything in between happens i update.
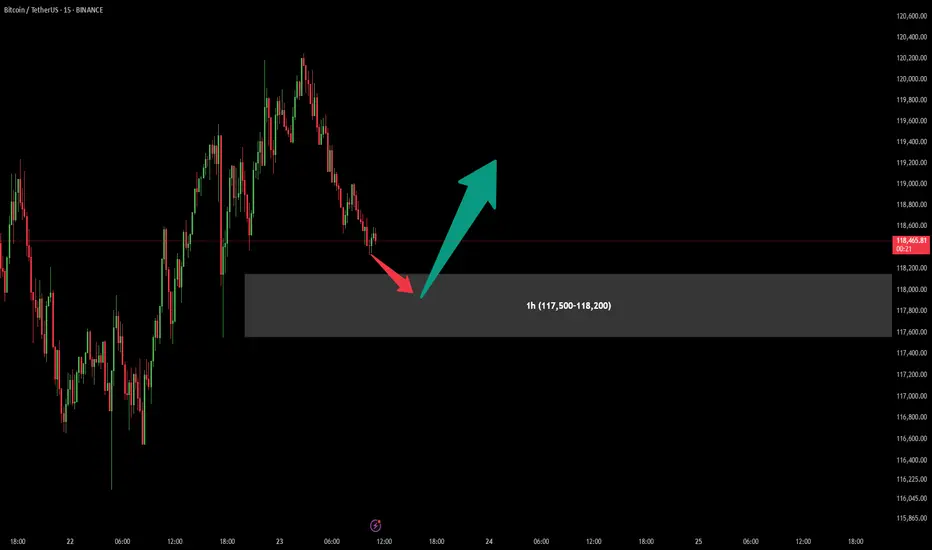
BitCoin BUY OfferAfter previous signal which have given us a good profit (more than 1:10 Risk to Reward), There is another chance for one more Buy position in specified are (117,500-118,200).
Attention : In my chart areas Stop Loss would be under the area (Over the area in Sell positions) and first Take Profit sets for at least R:R = 1:1
Let's see what will happen...
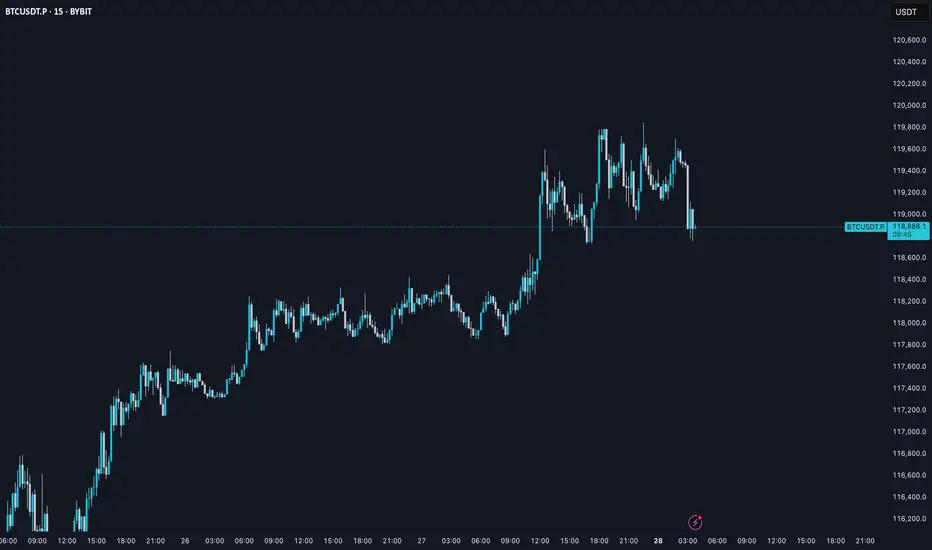
BTC AI Prediction Dashboard - 6h Price Path (28.07.25)
Prediction made using Crypticorn AI Prediction Dashboard
Link in bio
BTCUSDT Forecast:
Crypticorn AI Prediction Dashboard Projects 6h Price Path (Forward-Only)
Forecast timestamp: ~07:30 UTC
Timeframe: 15m
Prediction horizon: 6 hours
Model output:
Central estimate (blue line): -119,580
Represents the AI’s best estimate of BTC’s near-term price direction.
80% confidence band (light blue): 119,215 – 119,825
The light blue zone marks the 80% confidence range — the most likely area for price to close
40% confidence band (dark blue): 118,653 – 120,531
The dark blue zone shows the narrower 40% confidence range, where price is expected to stay with higher concentration
Volume on signal bar: 255.22
This chart shows a short-term Bitcoin price forecast using AI-generated confidence zones.
Candlesticks reflect actual BTC/USDT price action in 15-minute intervals.
This helps visualize expected volatility and potential price zones in the short term.
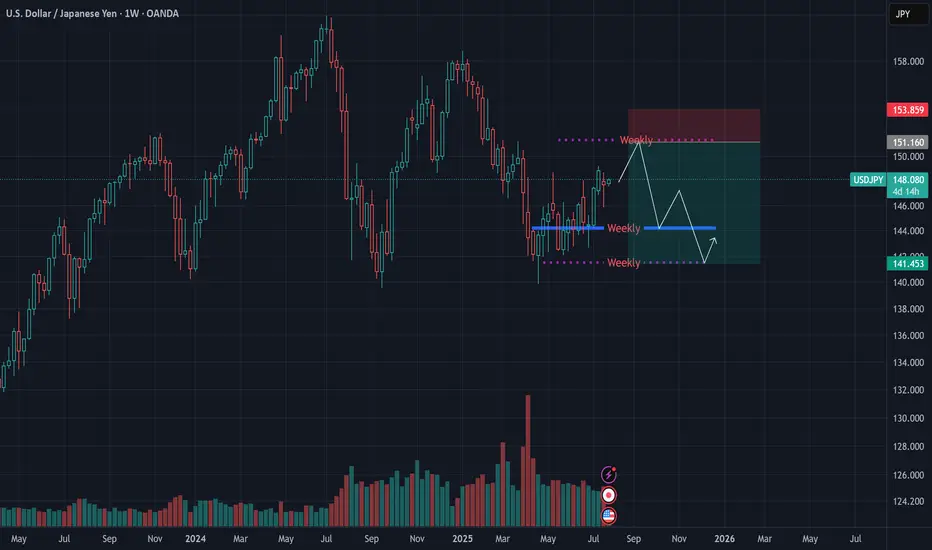
USDJPY Macro Analysis – July 27, 2025We’ve been tracking the yen for months and, since the beginning of the year, have signaled a potential appreciation in its value, largely based on the Bank of Japan’s policy stance.
📉 However, recent price action — particularly the return to prior levels — revealed a shift in Japan’s macroeconomic direction.
🇯🇵 Last week, we saw the first formal confirmations, with Japan making its largest-ever investment in the U.S.
This suggests a new approach to currency valuation, and we may now witness another phase of yen weakness.
🌀 That said, the market remains uncertain and indecisive, so it’s wise to hold off on major long-term entries until further confirmation.
🎯 A tactical entry around the 150 level could be reasonable in the meantime, as we wait for clearer signals.
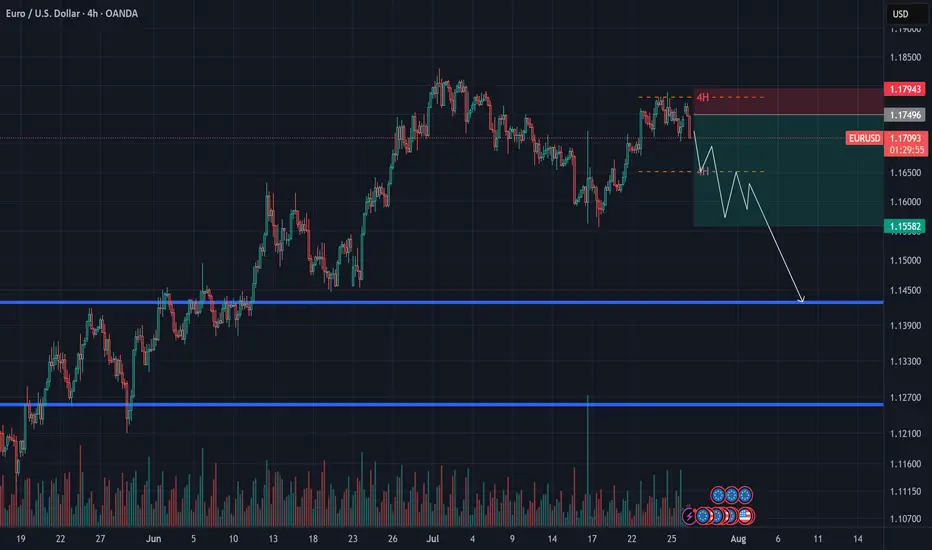
EURUSD Outlook – July 27, 2025This week, the EU is set to release key economic data, including GDP figures.
Given the recent U.S. tariff pressure, there’s a strong chance that these numbers will come in weak — weighing further on the euro.
📉 After bouncing from the 1.15 level, EURUSD entered a corrective move, but even with extended consolidation, it failed to reach the previous high — a sign of growing exhaustion.
📌 Price action suggests a lack of bullish momentum, and candles are reflecting market fatigue.
🔁 I expect the euro to enter a mid-term corrective phase, potentially heading back toward the 1.13 zone.
🎯 A short entry below 1.18 could offer a favorable risk-reward setup.
XAGUSD Technical Outlook – July 27, 2025
Silver appears to be losing momentum at the top, and for the first time in a while, we’ve seen a strong bearish daily candle, suggesting that sellers may be stepping in more seriously.
🌀 Previous pullbacks mostly looked like profit-taking, but this drop seems to be accompanied by actual selling pressure.
Despite breaking the previous high over the past two weeks, silver has failed to extend gains meaningfully — a potential sign of exhaustion.
🎯 A low-risk short opportunity may be forming around the $38–$39 range.
⚠️ For more patient and risk-tolerant traders, a daily close below $37 could open the door for a broader correction toward the $33–$35 zone — levels that have remained untested.
Stay sharp — momentum shifts often start quietly.
