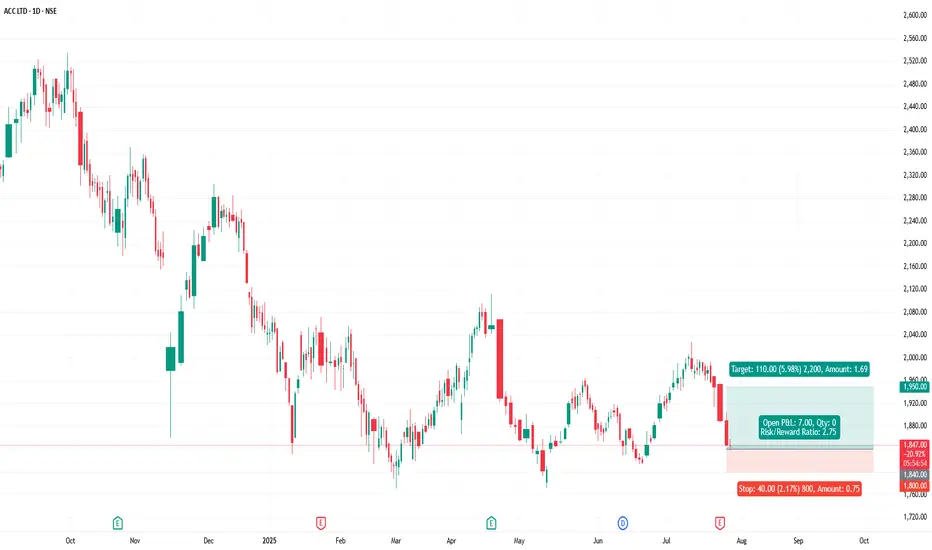
ACC - ACC Ltd (Daily chart, NSE) - Long PositionACC - ACC Ltd (Daily chart, NSE) - Long Position
Risk assessment: Medium {support structure integrity risk}
Risk/Reward ratio ~ 2.75
Current Market Price (CMP) ~ 1848
Entry limit ~ 1845 to 1835 (Avg. - 1840) on July 28, 2025
Target limit ~1950 (+5.98%; +110 points)
Stop order limit ~ 1800 (-2.17%; -40 points)
Disclaimer: Investments in securities markets are subject to market risks. All information presented in this group is strictly for reference and personal study purposes only and is not a recommendation and/or a solicitation to act upon under any interpretation of the letter.
LEGEND:
{curly brackets} = observation notes
= important updates
(parentheses) = information details
~ tilde/approximation = variable value
-hyphen = fixed value
Beyond Technical Analysis
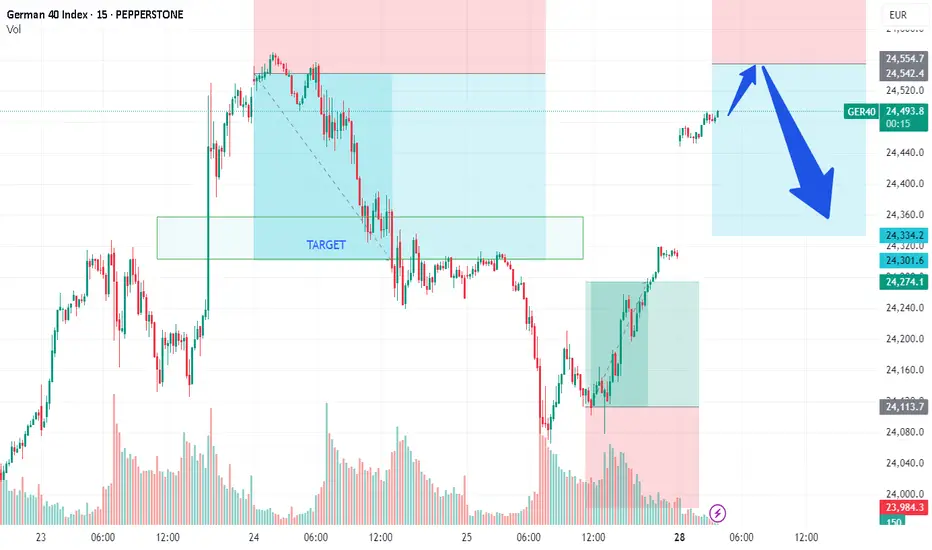
DAX/GER - PREPARE TO SHORT on DAX market opening Team,
We all know that the European Union and the United States agreed on Sunday to a broad trade deal that sets a 15 per cent tariff on most E.U. goods, including cars and pharmaceuticals.
The 27-nation bloc also agreed to increase its investment in the United States by more than $600 billion above current levels.
If the DEAL does not go through, it would be nasty to the market—especially to the Europeans, who are likely to get hurt by the export cost to the United States, especially the Car. The EUROPEAN is currently facing many challenges from Chinese car manufacturing.
We have been trading very well with the DAX in the past. We expect that when the market opens, we should short-range at 24530-60 - GET READY.
Stop loss at 24620-50
Please NOTE: once the price pulls back toward 24475-50, bring our STOP LOSS TO BE (Break even)
Our 1st target at 24425-24400
2nd Target at 24350-24300
Last Friday, in OUR LIVE TRADING, we mentioned that LONG DAX at 24100
Options Blueprint Series [Intermediate]: Gold Triangle Trap PlayGold’s Volatility Decline Meets a Classic Chart Setup
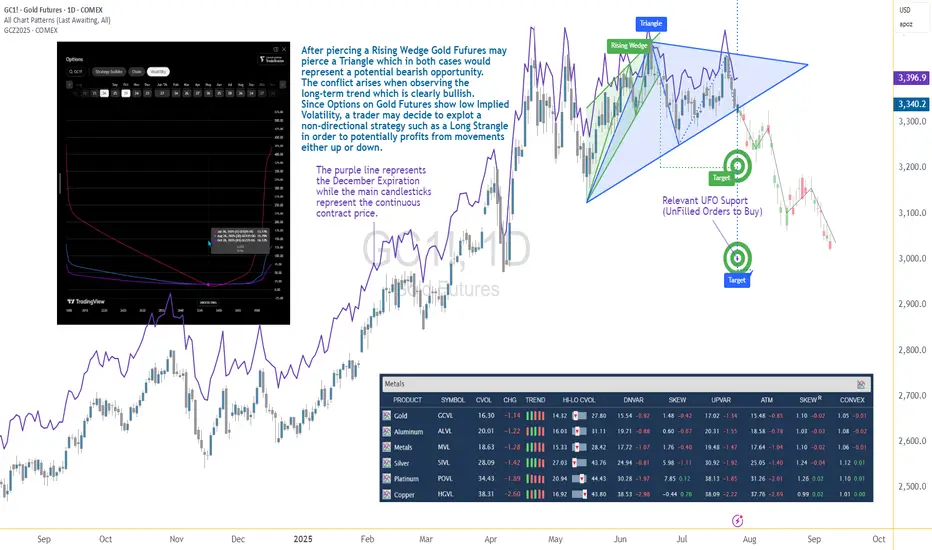
Gold Futures have been steadily declining after piercing a Rising Wedge on June 20. Now, the market structure reveals the formation of a Triangle pattern nearing its apex — a point often associated with imminent breakouts. While this setup typically signals a continuation or reversal, the direction remains uncertain, and the conflict grows when juxtaposed with the longer-term bullish trajectory Gold has displayed since 2022.
The resulting dilemma for traders is clear: follow the short-term bearish patterns, or respect the dominant uptrend? In situations like these, a non-directional approach may help tackle the uncertainty while defining the risk. This is where a Long Strangle options strategy becomes highly relevant.
Low Volatility Sets the Stage for an Options Play
According to the CME Group’s CVOL Index, Gold’s implied volatility currently trades near the bottom of its 1-year range — hovering just above 14.32, with a 12-month high around 27.80. Historically, such low readings in implied volatility are uncommon and often precede sharp price movements. For options traders, this backdrop suggests one thing: options are potentially underpriced.
Additionally, an IV analysis on the December options chain reveals even more favorable pricing conditions for longer-dated expirations. This creates a compelling opportunity to position using a strategy that benefits from volatility expansion and directional movement.
Structuring the Long Strangle on Gold Futures
A Long Strangle involves buying an Out-of-the-Money (OTM) Call and an OTM Put with the same expiration. The trader benefits if the underlying asset makes a sizable move in either direction before expiration — ideal for a breakout scenario from a compressing Triangle pattern.
In this case, the trade setup uses:
Long 3345 Put (Oct 28 expiration)
Long 3440 Call (Oct 28 expiration)
With Gold Futures (Futures December Expiration) currently trading near $3,392.5, this strangle places both legs approximately 45–50 points away from the current price. The total cost of the strangle is 173.73 points, which defines the maximum risk on the trade.
This structure allows participation in a directional move while remaining neutral on which direction that move may be.
Technical Backdrop and Support Zones
The confluence of chart patterns adds weight to this setup. The initial breakdown from the Rising Wedge in June signaled weakness, and now the Triangle’s potential imminent resolution may extend that move. However, technical traders must remain alert to a false breakdown scenario — especially in trending assets like Gold.
Buy Orders below current price levels show significant buying interest near 3,037.9 (UFO Support), suggesting that if price drops, it may find support and rebound sharply. This adds further justification for a Long Strangle — the market may fall quickly toward that zone or fail and reverse just as violently.
Gold Futures and Micro Gold Futures Contract Specs and Margin Details
Understanding the product’s specifications is crucial before engaging in any options strategy:
🔸 Gold Futures (GC)
Contract Size: 100 troy ounces
Tick Size: 0.10 = $10 per tick
Initial Margin: ~$15,000 (varies by broker and volatility)
🔸 Micro Gold Futures (MGC)
Contract Size: 10 troy ounces
Tick Size: 0.10 = $1 per tick
Initial Margin: ~$1,500
The options strategy discussed here is based on the standard Gold Futures (GC), but micro-sized versions could be explored by traders with lower capital exposure preferences.
The Trade Plan: Long Strangle on Gold Futures
Here's how the trade comes together:
Strategy: Long Strangle using Gold Futures options
Direction: Non-directional
Instruments:
Buy 3440 Call (Oct 28)
Buy 3345 Put (Oct 28)
Premium Paid: $173.73 (per full-size GC contract)
Max Risk: Limited to premium paid
Breakeven Points on Expiration:
Upper Breakeven: 3440 + 1.7373 = 3613.73
Lower Breakeven: 3345 – 1.7373 = 3171.27
Reward Potential: Unlimited above breakeven on the upside, substantial below breakeven on the downside
R/R Profile: Defined risk, asymmetric potential reward
This setup thrives on movement. Whether Gold rallies or plunges, the trader benefits if price breaks and sustains beyond breakeven levels by expiration.
Risk Management Matters More Than Ever
The strength of a Long Strangle lies in its predefined risk and unlimited reward potential, but that doesn’t mean the position is immune to pitfalls. Movement is key — and time decay (theta) begins to erode the premium paid with each passing day.
Here are a few key considerations:
Stop-loss is optional, as max loss is predefined.
Precise entry timing increases the likelihood of capturing breakout moves before theta becomes too damaging. Same for exit.
Strike selection should always balance affordability and distance to breakeven.
Avoid overexposure, especially in low volatility environments that can lull traders into overtrading due to the potentially “cheap” options.
Using strategies like this within a broader portfolio should always come with well-structured risk limits and position sizing protocols.
When charting futures, the data provided could be delayed. Traders working with the ticker symbols discussed in this idea may prefer to use CME Group real-time data plan on TradingView: tradingview.sweetlogin.com - This consideration is particularly important for shorter-term traders, whereas it may be less critical for those focused on longer-term trading strategies.
General Disclaimer:
The trade ideas presented herein are solely for illustrative purposes forming a part of a case study intended to demonstrate key principles in risk management within the context of the specific market scenarios discussed. These ideas are not to be interpreted as investment recommendations or financial advice. They do not endorse or promote any specific trading strategies, financial products, or services. The information provided is based on data believed to be reliable; however, its accuracy or completeness cannot be guaranteed. Trading in financial markets involves risks, including the potential loss of principal. Each individual should conduct their own research and consult with professional financial advisors before making any investment decisions. The author or publisher of this content bears no responsibility for any actions taken based on the information provided or for any resultant financial or other losses.
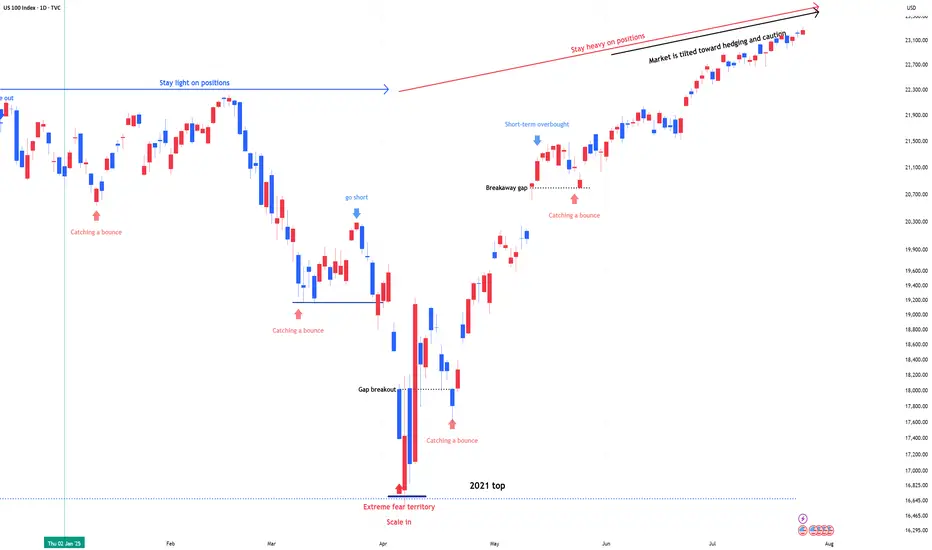
NDX & SPX , Stay heavy on positionsNDX & SPX , Stay heavy on positions (QLD, TQQQ)
Market sentiment is currently tilted toward betting on downside volatility, which ironically supports the case for the stock market to continue its upward trend.
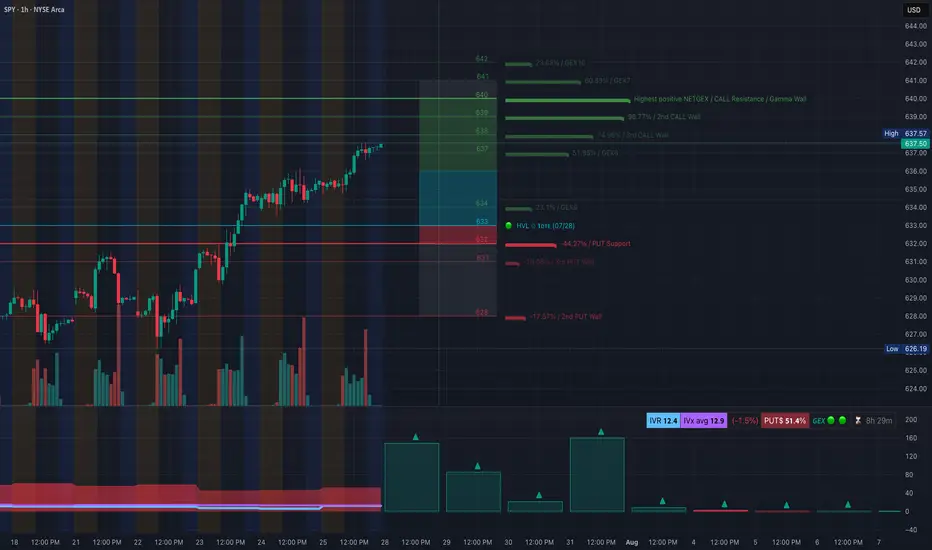
SPY at Decision Point! Gamma Walls vs. Rising Channel-Jul 28🧠 Technical Analysis (TA) – SPY Outlook
SPY is approaching a critical inflection zone near $638–$640, navigating through an ascending channel with compression in price action. This aligns with major Gamma Walls, offering both opportunity and risk. Here's the Monday breakdown using 1H, 15M, and GEX overlays:
🔍 Market Structure:
* 1H Chart shows a clean uptrend, forming a base around $637.50.
* 15M Chart reveals a consolidation zone after a Break of Structure (BOS), with a potential CHoCH below $636.65.
* Price is currently ranging inside a small supply zone and below an upper channel boundary.
🧲 GEX + Options Sentiment:
* GEX Extreme Gamma Resistance: $640–642 (strong CALL walls, potential reversal).
* PUT Wall Clusters: $634, $632, $628 (support zones on pullbacks).
* IVR: 12.4 – near low volatility.
* Put/Call $ Ratio: 51.4% Puts = Mild Bearish lean.
* NETGEX highest positive at $640 = Gamma magnet + potential resistance.
📌 Key Zones:
* Support: 636.15 → 634.42 → 633.00
* Resistance: 638.70 → 640.00 → 642.00
🟢 Bullish Scenario:
* If SPY reclaims 638.70 and breaks above channel top, watch for momentum toward 640–642, then reassess.
* 📥 Entry: 638.80+
* 🎯 Target: 640.40 → 641.80
* ⛔️ Stop: Below 636.65
🔴 Bearish Scenario:
* Failure to hold above 637.50 and break of CHoCH at 636.65 could invite pullback to 634.42 or even 632.90.
* 📥 Entry: Break & retest below 636.65
* 🎯 Target: 634.42 → 633.00
* ⛔️ Stop: Above 638.00
🔁 Scalping Levels (15M):
* Watch pink box consolidation zone (637.2–637.6) for breakout or rejection.
* Aggressive short scalp if early rejection from 638 near open.
🎯 Actionable Plan:
* Opening Above 638.70 = Lean CALLs, trail tight.
* Rejection at 638–638.5 = Look for PUTs back to 636.5/634.
* Clean break of 636.65 = Short bias opens for larger retrace.
* Gamma Squeeze possible only if > 640 holds and IV rises.
🧠 Thoughts:
SPY is coiling under macro resistance while IV remains low. Options market isn't leaning heavily bearish, but that could change if we slip below 636.65. Be mindful of the Gamma walls acting as magnets or reversion zones. This is a risk-defined week, so size down and react—not predict.
Disclaimer: This analysis is for educational purposes only and does not constitute financial advice. Always do your own research and trade with proper risk management.
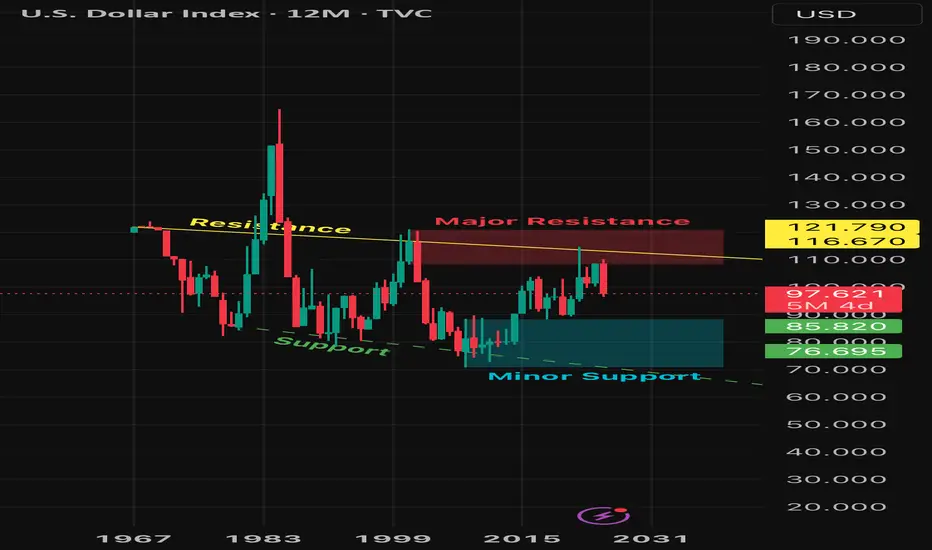
DXY: The Graceful Short This is interesting…Ever since the birth of Bitcoin, the DXY was in an overall uptrend, but that uptrend may have ended in the resistance zone. Price seems to have reversed for the DXY especially after the formation of a bearish engulfing candle on the 6M timeframe. Price may end the year within or on top of the support zone.
What does this mean for crypto and other assets?
If the DXY has reversed and is now in a long term down trend, crypto currencies and other assets will be in long term uptrends! Bitcoin may skip its upcoming bearish year next year or more than likely the bearish year will happen but the retracement may be short. Stay tuned!
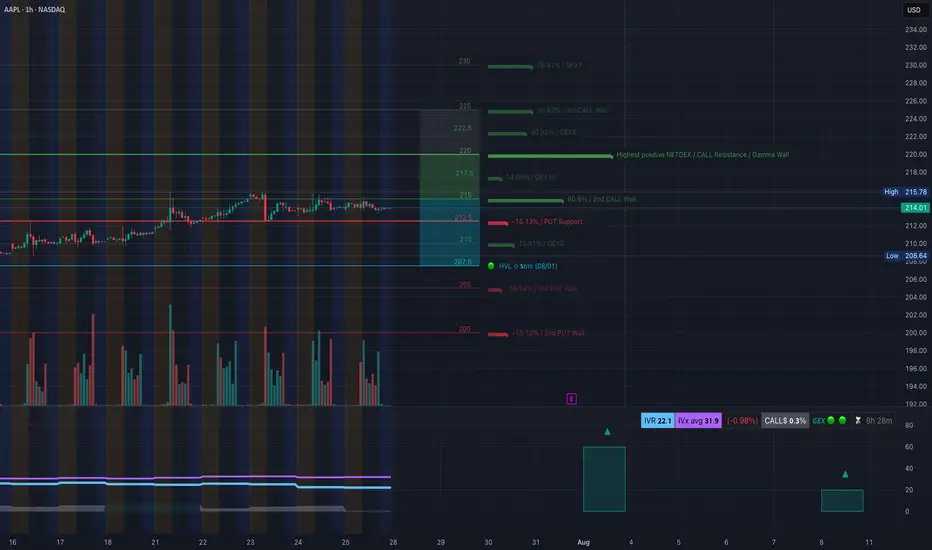
AAPL Holding the Line or Ready to Slip? Jul 28AAPL Holding the Line or Ready to Slip? Key Gamma Zones In Play 🧠📉
1. Market Structure (15M SMC Chart)
AAPL recently broke out of a descending wedge structure after forming a BOS (Break of Structure) around $213.50. Two recent CHoCHs suggest an internal shift in momentum, but price failed to reclaim the red breaker block at ~$214.20–$215.40. Sellers stepped in heavily from that supply zone.
* CHoCH ➜ BOS ➜ Lower High = potential bearish continuation
* Price is compressing under the breaker zone with lower highs forming
* Final CHoCH was not sustained above key S/R level ~$214.20
2. GEX & Options Flow (1H GEX Chart)
The Gamma Exposure map shows AAPL in a compression pocket between PUT support and CALL resistance, with volatility brewing.
* 🔒 $212.5: Key PUT support — likely dealer hedging zone
* 🔓 $215.5: Strong CALL resistance & 2nd CALL Wall
* 📉 Below $210 = Gamma Squeeze zone toward $207.5 / $205 (3rd PUT Wall)
* 📈 Above $217 opens room toward $220–$222.5 (GEX8/GEX9) and CALL dominance
IVX is still subdued (31.9) and IVR at 22.1 — suggesting cheap options right before earnings on August 1st, making directional bets appealing.
3. Key Levels to Watch
* Support: $213.00 / $212.50 / $210.60
* Resistance: $214.20 / $215.50 / $217.00
4. Trade Scenarios
📉 Bearish Setup (high probability):
* Entry: $213.80–214.10 rejection zone (breaker retest)
* Stop: Above $215.60
* Target 1: $212.60
* Target 2: $210.60
* Target 3 (if breakdown): $207.50 GEX / HVL
📈 Bullish Reversal Setup (only if breakout confirms):
* Entry: Break and hold above $215.50
* Stop: Below $214.30
* Target 1: $217.00
* Target 2: $220
* Target 3 (squeeze): $222.50 GEX9 zone
5. Thoughts & Recommendation
AAPL is compressing tightly between supply and demand, but the market structure + GEX combo leans bearish bias unless bulls reclaim $215.50. Use that as your decision line.
Intraday traders: watch how price reacts to $214.20–$213.60 zone. Failure to bounce likely leads to PUT wall retest at $212.50 and HVL support below.
Options traders: Consider weekly PUT spreads if price rejects $214.10–$215.50 again. For bulls, only consider long CALL spreads if we get a break and close above $215.60 with volume.
Disclaimer: This analysis is for educational purposes only. Not financial advice. Always manage risk and trade your plan.
NVDA Sitting at a Crossroads. Jul 28NVDA Sitting at a Crossroads: Will Gamma or Liquidity Take Control? 🔍
Overview:
NVDA is currently consolidating below a 15-min supply zone after a clear BOS (Break of Structure) on the intraday chart. Price is compressing near a rising trendline support and forming a triangle, hinting at an explosive move early this week.
📊 Market Structure (15m + 1H):
* BOS confirmed near $175 with rejection from the supply zone.
* Currently building a higher low around $173.00–173.30, sitting on trendline support.
* Price is compressing in a tight range — breakout likely on Monday.
🔍 GEX & Options Sentiment (1H GEX Chart):
* Highest Call Resistance near $176–$178 → strong gamma wall.
* Major GEX Support: $167.74 (GEX10) and heavy PUT wall at $165 (17.99%).
* IV Rank: 8.3, IVX: 37.3 (relatively cheap options).
* Call$/Put$ Flow: Heavily biased toward Calls (9%), signaling bullish sentiment.
* GEX Sentiment: Mild Bullish → neutral into highest positive gamma.
🔄 Key Zones:
* Demand Zone: $167.7 → aligns with HVL and GEX10.
* Support Below: $165 (GEX PUT wall), then $162.5 (2nd PUT wall).
* Resistance Above: $174.72 → $176 (gamma wall) → $180.
📈 Trade Scenarios:
Bullish Play (Scalp/Swing):
* Entry: Above $174.14 reclaim (supply zone flip).
* Target 1: $176
* Target 2: $178 → $180 (gamma squeeze zone).
* Stop-Loss: Below $172.90 or break of trendline.
* Notes: Needs a clean BOS and demand reclaim — watch volume + open interest shift.
Bearish Play (Only if support fails):
* Entry: Break and close below $172.90
* Target 1: $170
* Target 2: $167.7 → possible bounce at GEX10.
* Stop-Loss: Back above $174.00
💭 My Thoughts:
NVDA is in a coiled setup — either breaking out into a gamma squeeze above $176 or failing trendline support and testing $167–165 for liquidity. GEX suggests institutions are defending $165 while sellers may reload near $176. Favoring bullish bias unless $172.90 breaks.
🧠 Strategy Tip:
Watch for FVG fill on 1-min or 5-min chart if it retests trendline before launching. A strong reclaim of $174.14 may trap shorts and trigger fast moves toward gamma walls.
This analysis is for educational purposes only and does not constitute financial advice. Always do your own research and manage your risk before trading.

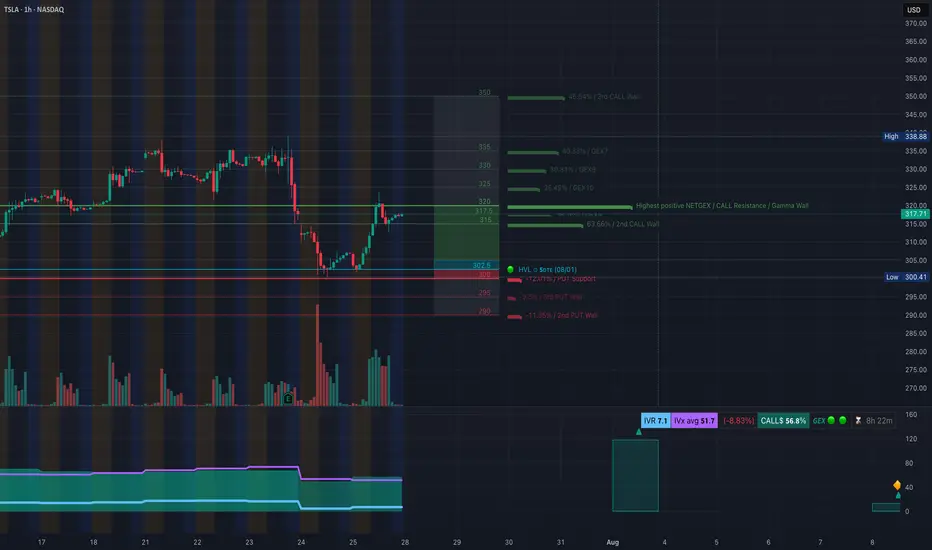
TSLA at the Edge of Reversal or Rally? Key Setup Ahead. Jul 28🔍 Technical Analysis (1H + 15M Confluence)
* Market Structure:
After a steep drop from $334, TSLA has shown a recovery off the $300.41 low. The 1H chart shows a bounce forming higher lows, with price now consolidating around $317–$318.
* SMC Insight (15M):
The bullish BOS and CHoCH signal a structural shift. Price has respected the ascending channel and reacted from the Fair Value Gap (FVG) inside a purple supply zone near $323–$325, indicating short-term resistance.
* Volume Analysis:
Volume increased on the bullish move off $302.5 demand zone, indicating possible accumulation, but stalled near resistance.
🔐 Key Supply & Demand Levels:
* Demand Zones (Support):
* $302.5 (1H GEX HVL zone + volume demand)
* $300.41 (last low & liquidity pocket)
* Supply Zones (Resistance):
* $323.62–$325 (15M supply + GEX resistance zone)
* $334–$338 (GEX7/High wall)
📈 Options Sentiment – GEX & Flow
* Gamma Walls (Resistance):
* $317–$323: Heavy CALL walls, especially at $320 (Gamma Wall)
* $335–$338: Strong GEX7 / GEX9 resistance — potential magnet only if TSLA breaks 325 cleanly
* PUT Walls (Support):
* $302.5: HVL + PUT support
* $295 & $290: Lower extreme GEX support (panic defense zones)
* Options Oscillator:
* IVR: 7.1 (very low — cheap premiums)
* IVx avg: 51.7 (slightly elevated fear)
* Call Bias: 68.8% bullish
* GEX Sentiment: ✅✅✅ bullish until $325, then neutral-to-risky
🎯 Trade Setups
✅ Bullish Setup (if price holds above $316–317):
* Entry: 317.50–318.00 (current consolidation)
* Target 1: 323.50 (supply)
* Target 2: 334.00 (GEX9 magnet)
* Stop-loss: 312.70 (SMC breaker structure + 15M CHoCH invalidation)
Scalp Target: 323
Swing Target: 334
Add Calls (weekly): Only above 320 breakout with volume.
❌ Bearish Setup (if price loses 312.70):
* Entry: < 312.50 breakdown
* Target 1: 305.30 (mid-demand)
* Target 2: 302.50 (HVL & GEX PUT support)
* Stop-loss: 316.10 (back inside channel, bullish flip invalid)
Scalp Target: 305
Swing Target: 302.5
Add Puts: Only below 312.5 with confirmation candle.
⚖️ Bias & Scenario Outlook:
* Neutral-to-Bullish Bias: As long as price holds above 316 and respects the ascending trendline.
* Risk Zone: 323–325 = possible reversal zone (heavy GEX wall + supply)
* Gamma Flip Above: 325 opens up 334–338.
📌 Conclusion:
TSLA is compressing between supply and demand. Monday’s price action around 317–320 will be key. A break above 320 could fuel a GEX chase to 334, while rejection may trigger a pullback toward 305–302. Stay nimble and let price confirm direction around key GEX walls and SMC structure.
⚠️ Disclaimer:
This analysis is for educational purposes only and does not constitute financial advice. Always do your own research and manage your risk before trading.
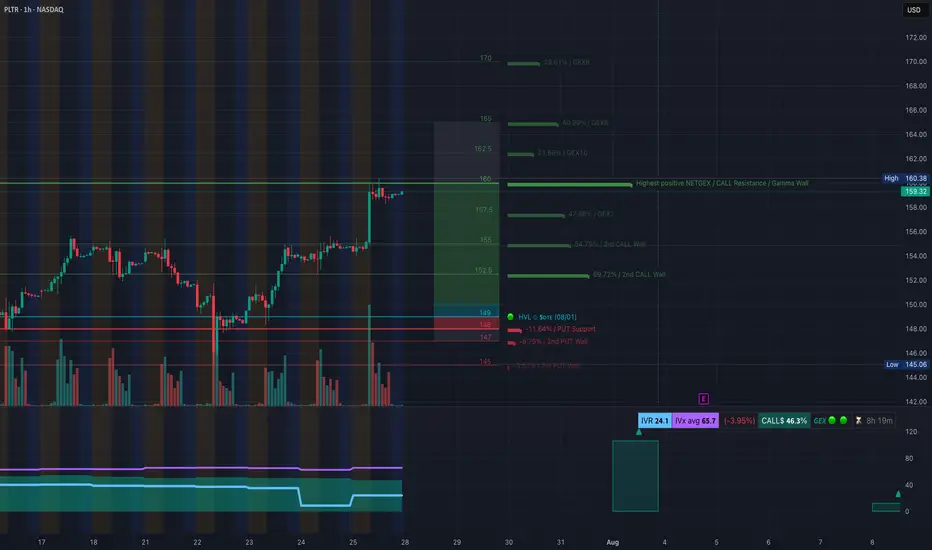
PLTR at Resistance Brink — Will It Break or Fade? Jul 28🔍 1-Hour GEX & Options Outlook
Palantir (PLTR) has reclaimed strength, now consolidating just below $160.38, which aligns with the Highest Positive GEX / Gamma Wall. The GEX stack gives us a powerful framework for potential options setups:
* $160.38 = Gamma Magnet – This is the wall where large call positioning accumulates. Price is currently pinned underneath, forming a short-term consolidation range.
* Above $160.38 opens the path toward:
* $162.5 (GEX10)
* $165 (GEX9)
* $170 (GEX9 top wall)
However, failure to break $160.38 cleanly could cause price to slide back to key support zones around:
* $157.5 (GEX Cluster, minor put wall zone)
* $152.5 (2nd Call Wall, liquidity pocket)
* $149–147 (High Volume Node + Put Support)
🧠 My thoughts: This is a textbook high gamma compression zone. If PLTR breaks and holds above $160.38 early in the week, it could trigger a gamma squeeze toward $165+. If it gets rejected again, short-term premiums may decay fast, and a move toward $152.5 is likely before any next leg.
🎯 Options Strategy:
* Bullish Setup:
* Entry: Over $160.50 with volume and confirmation.
* Target: $165, then $170.
* Contract: Aug 2nd or Aug 9th $165C.
* Stop: Below $157.5.
* Bearish Setup:
* If rejection from $160.38 with weakness.
* Target: $154.88 / $152.5.
* Contract: Aug 2nd $155P or $152.5P.
* Stop: Above $160.8.
🕒 15-Minute Intraday TA
We saw a sharp rally followed by sideways compression in a narrow range between $159.32 and $160.38. The breakout leg was supported by a clear CHoCH (Change of Character) in the NY morning session followed by a BOS (Break of Structure) up.
Price has since been flagging within a parallel channel, forming a minor order block between $158.29 and $159.32. As we head into Monday’s session, here’s what to look for:
🟢 Bullish Intraday Scenario
* Look for price to hold the OB or do a liquidity sweep down to $158.29, then break above the current flag.
* A break and retest of $160.38 with rising volume sets up a clean scalp toward $162.
* Bias remains bullish as long as price stays above the rising channel and $157.5.
🔴 Bearish Intraday Scenario
* A break below $158.29 could trigger a fade toward the next support around $154.88 / $153.97.
* A mid-morning failed breakout above $160.38 that quickly reverses would be a trap short setup.
* If price falls below $157.5 early in the day, expect downside acceleration.
📌 Scalper’s Zone to Watch:
* $158.29–$159.32 = Bullish OB + Liquidity Zone.
* $160.38 = Resistance + Gamma Wall.
* $154.88–$153.97 = Demand zone if flush occurs.
🧠 Final Thoughts:
PLTR is at a pivotal level with serious GEX heat. It's consolidating right beneath a gamma ceiling that could either trigger a breakout squeeze or unwind. Use the first 15–30 minutes Monday to judge strength. Watch the reaction to $160.38 carefully — that’s the gatekeeper.
⚠️ Disclaimer:
This analysis is for educational purposes only and does not constitute financial advice. Always do your own research and manage your risk responsibly.
How to ENTER A TRADE - USDJPY BUY trade EXPLAINED!!!Determining the direction of an asset you wish to trade is relatively easy, the difficult part is finding the best entry. In this vid we look at reasons to enter a trade and analyze a current live buy trade on USDJPY

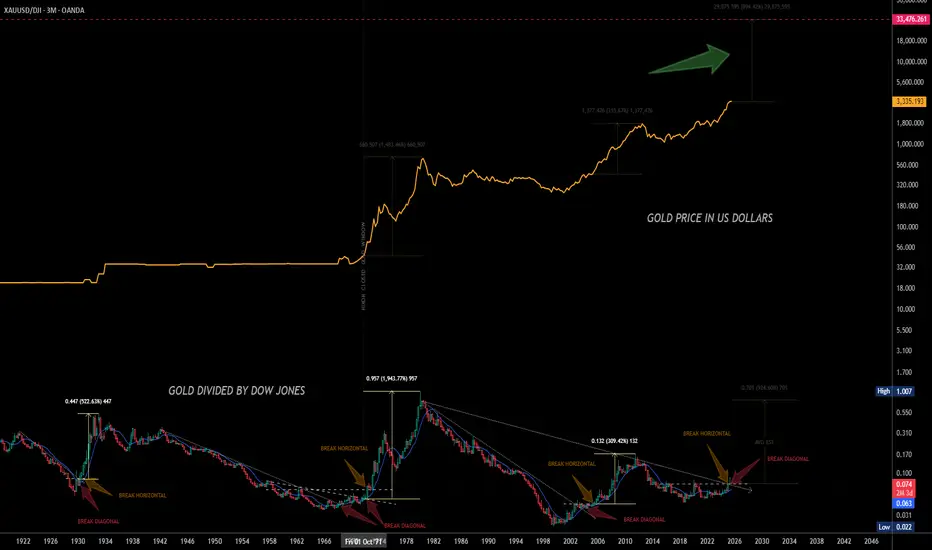
$33K GOLD looks as if the XAUUSD/DJI chart is demonstrating an early look into a repeat performance .. could gold go to $33K ..and if so, what will a tin of tuna cost?
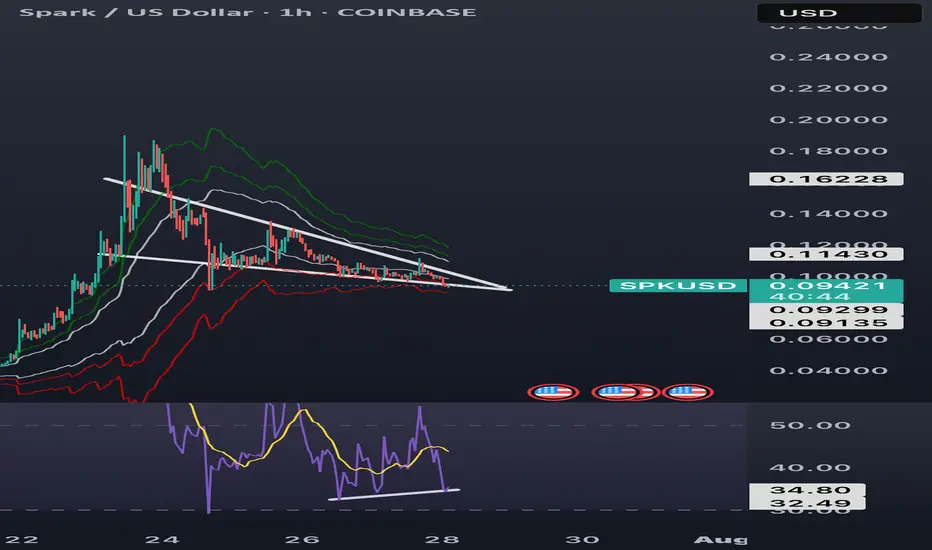
Falling wedge waiting to break out Falling wedge plus a huge bullish divergence now just for the reaction 👀🔥
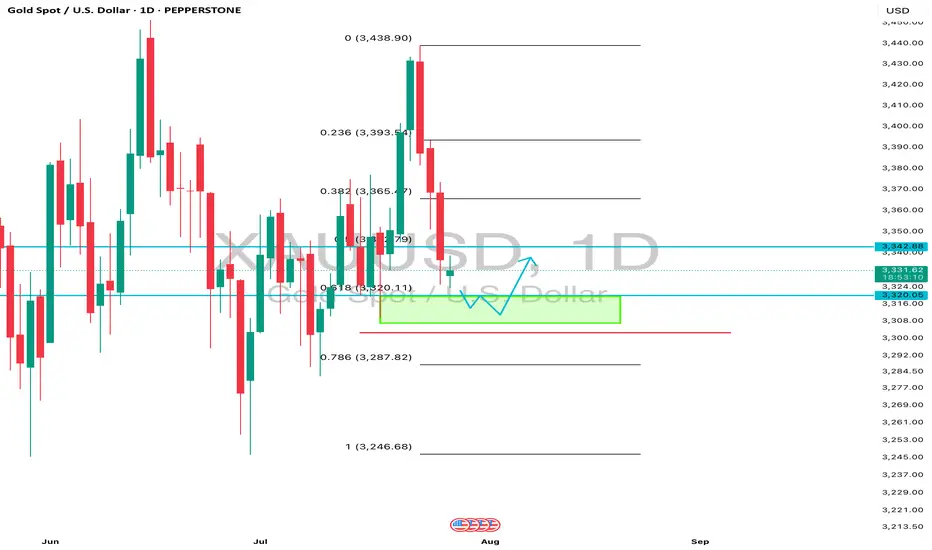
Daily Analysis- XAUUSD (Monday, 28th July 2025)Bias: Bullish
USD News(Red Folder):
-None
Notes:
- Price gap down and filled up the gap
- Looking for price to tap 0.618 fib level
- Potential BUY if there's
confirmation on lower timeframe
- Pivot point: 3300
Disclaimer:
This analysis is from a personal point of view, always conduct on your own research before making any trading decisions as the analysis do not guarantee complete accuracy.
BTCUSD 7/27/2025Come Tap into the mind of SnipeGoat as he gives you a Full Top-Down Analysis of Bitcoins Price Action as we embark on another week of Quarter 3.
_SnipeGoat_
_TheeCandleReadingGURU_
#PriceAction #MarketStructure #TechnicalAnalysis #Bearish #Bullish #Bitcoin #Crypto #BTCUSD #Forex #NakedChartReader #ZEROindicators #PreciseLevels #ProperTiming #PerfectDirection #ScalpingTrader #IntradayTrader #DayTrader #SwingTrader #PositionalTrader #HighLevelTrader #MambaMentality #GodMode #UltraInstinct #TheeBibleStrategy

Daily Analysis- XAUUSD (Monday, 28th July 2024)Bias: Bullish
USD News(Red Folder):
-None
Notes:
- Price gap down and filled up the gap
- Looking for price to tap 0.618 fib level
- Potential BUY if there's
confirmation on lower timeframe
- Pivot point: 3300
Disclaimer:
This analysis is from a personal point of view, always conduct on your own research before making any trading decisions as the analysis do not guarantee complete accuracy.

BTCUSD Bullish Move Price Tap on the W FVG and respected this POI , we can target the Buyside Liquidity above
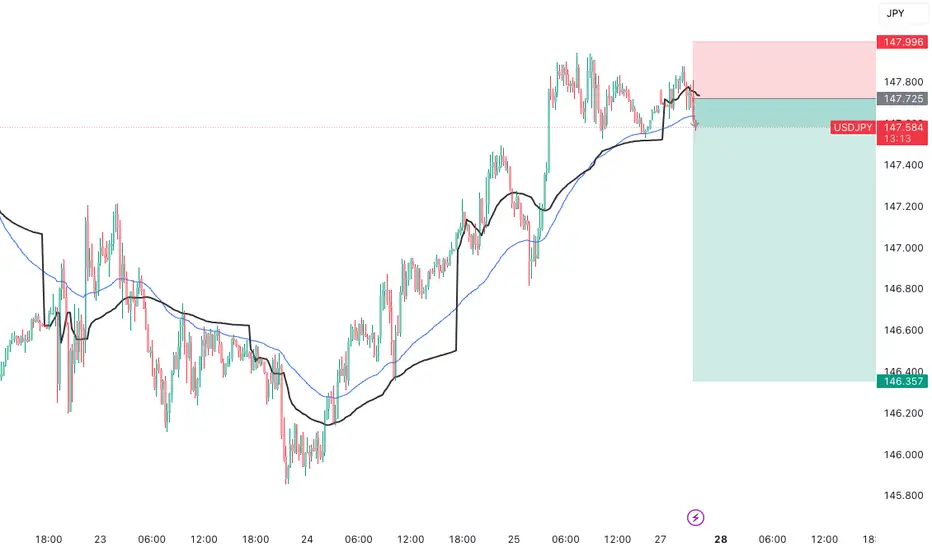
USDJPY Short Setup: Trend Reversal Confirmation in ProgressAfter waiting patiently for nearly two weeks, price action on USDJPY is finally beginning to align with bearish expectations. The current setup shows signs of exhaustion in the bullish momentum, with a rejection near the 147.80–148.00 zone — a key area of interest.
🔍 Entry thesis:
Price is reacting below previous highs.
EMAs are starting to compress and slope downward.
Potential change of character (CHOCH) forming on lower timeframes.
🎯 Trade parameters:
Entry: 147.72
SL: 147.99
TP: 146.35
Risk/Reward: ~5:1
This move could unfold progressively throughout the week, especially as we approach the end-of-month flows and increased USD volatility. I’ll continue to monitor structure and volume for confirmation.
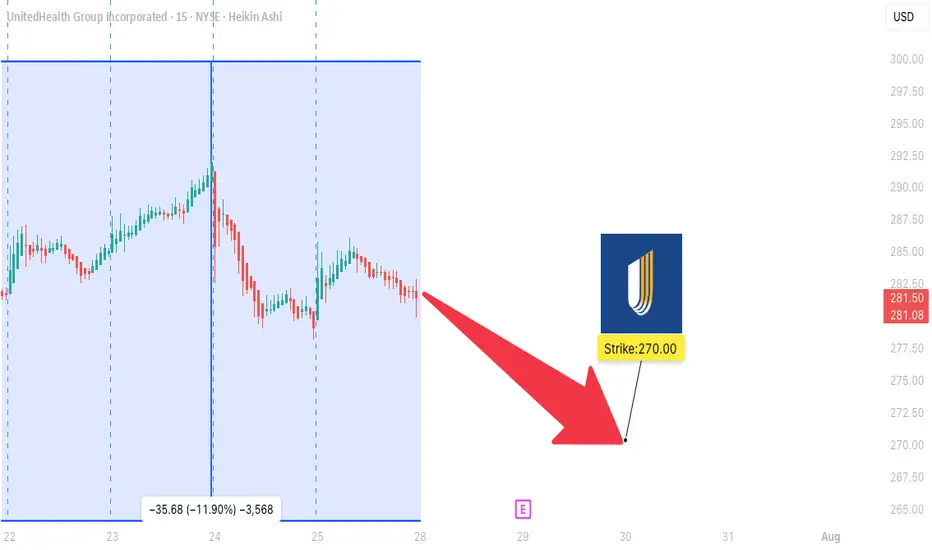
UNH WEEKLY TRADE IDEA (07/27/2025)
**🚨 UNH WEEKLY TRADE IDEA (07/27/2025) 🚨**
**Trend: Bearish Bias with Contrarian Options Flow**
🟥 **Technical Breakdown** + 🟩 **Bullish Flow Confusion** = Strategic Put Play
---
📊 **Key Technicals**
🧭 **Daily RSI:** 37.0 ⬇️
📉 **Weekly RSI:** 27.9 ⬇️ = *EXTREME BEARISH MOMENTUM*
📊 **Volume:** 1.2x prior week = *Institutional activity confirmed*
---
📈 **Options Flow Snapshot**
🟢 **Call/Put Ratio:** 1.64 → Normally bullish…
❗BUT in a falling market = **Contrarian noise** (per Gemini & Claude)
---
🔍 **Model Consensus Recap**
✅ All 5 models confirm BEARISH MOMENTUM
📉 Volume confirms downward pressure
❗ Disagreement only on *interpretation* of bullish call flow
📌 **Conclusion:** Put trade favored, but watch for surprise reversals
---
💥 **RECOMMENDED TRADE SETUP (Confidence: 65%)**
🎯 **Play:** Buy-to-Open PUT
* **Strike**: \$270
* **Expiry**: Aug 1, 2025
* **Entry Price**: \~6.10
* **Profit Target**: \$12.00 (🔁 2x Gain)
* **Stop Loss**: \$3.00 (🔻\~50%)
📆 **Entry Timing:** Market Open Monday
📦 **Size:** 1 Contract
---
⚠️ **Key Risks to Monitor:**
* 📈 If UNH moves above \$290 (Max Pain), bearish thesis invalidates
* ⚡ Gamma risk increases mid-week — *manage actively!*
* 📉 Unexpected volume dry-up could stall momentum
---
📌 **JSON FORMAT TRADE DETAILS (For Scripts/Alerts):**
```json
{
"instrument": "UNH",
"direction": "put",
"strike": 270.0,
"expiry": "2025-08-01",
"confidence": 0.65,
"profit_target": 12.00,
"stop_loss": 3.00,
"size": 1,
"entry_price": 6.10,
"entry_timing": "open",
"signal_publish_time": "2025-07-27 20:30:45 EDT"
}
```
---
💡 Summary:
Bearish momentum confirmed across models.
Flow confusion ≠ fade setup — it’s a **calculated put play**.
Trade smart, stay sharp.
🎯 Watch \$290.
💬 Tag fellow traders → \ NYSE:UNH bears unite!
\#UNH #OptionsTrading #BearishSetup #UnusualOptions #GammaRisk #MaxPain #TradingView #StockMarket
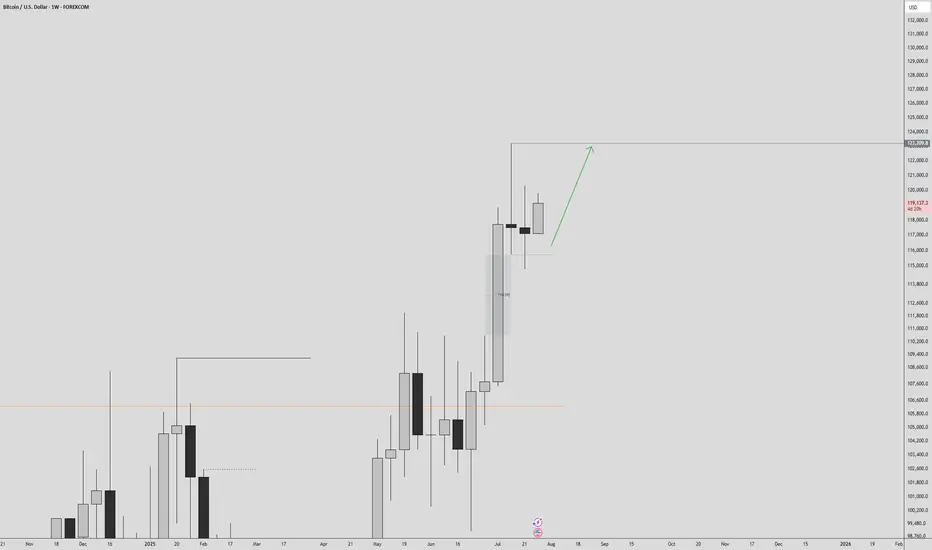
Bitcoin Weekly Seal at the Threshold 122K - No Gaps, No Retreat.⊣
⟁ BTC/USD - BINANCE - (CHART: 1W) - (Jul 27, 2025).
◇ Analysis Price: $119.374,00.
⊣
⨀ I. Temporal Axis - Strategic Interval - (1W):
▦ EMA9 - ($112.771,21):
∴ The weekly close remains above the EMA9, preserving short-term bullish structure;
∴ The EMA9 continues rising at a consistent slope, reflecting sustained upward momentum;
∴ A retracement to this level would represent the first defensive support on a tactical pullback.
✴️ Conclusion: EMA9 acts as a dynamic short-range support and trend continuation marker.
⊢
▦ EMA21 - ($104.883,22):
∴ Price remains notably above the EMA21, confirming structural strength in medium-term trend;
∴ The EMA21 was previously retested during consolidation in Q2 2025;
∴ A weekly close below it would indicate a structural loss of momentum.
✴️ Conclusion: EMA21 confirms medium-term bullish bias as long as preserved.
⊢
▦ WMA50 - ($98.605,81):
∴ WMA50 serves as a major cyclical support and remains untouched since early 2024;
∴ The gap between price and WMA50 indicates strong extension, yet risk of mean reversion rises;
∴ This level aligns with a prior demand zone around ($95K–$100K).
✴️ Conclusion: WMA50 is a latent demand zone - strategic if market reverts from exhaustion.
⊢
▦ WMA100 - ($84.570,72):
∴ This weighted average aligns with the 0.382 Fibonacci level;
∴ A long-term correction toward this band would reflect the depth of macro pullbacks in previous cycles;
∴ Currently distant from price action, but structurally significant if macro volatility increases.
✴️ Conclusion: WMA100 anchors mid-cycle recalibrations and aligns with retracement symmetry.
⊢
▦ WMA200 - ($63.181,79):
∴ The 200-week WMA remains far below price and untouched since early 2023;
∴ This is the ultimate structural support in secular bull cycles;
∴ If revisited, it signals macro-level capitulation or black swan scenario.
✴️ Conclusion: WMA200 holds the foundational line of long-term structural integrity.
⊢
▦ Fibonacci Retracement - (Range from 0 = $27.143,79 to 1 = $122.056,95):
∴ 0.000 = $27.143,79 - Genesis base from Apr 2025 cycle;
∴ 0.236 = $49.543,30 - Psychological line of control in late 2023;
∴ 0.382 = $63.400,62 - Aligned with long-term moving averages;
∴ 0.500 = $74.600,37 - Symmetry pivot of current macro-leg;
∴ 0.618 = $85.800,12 - Golden pocket lower bound;
∴ 0.786 = $101.745,53 - Golden pocket upper edge and structural resistance pre-breakout;
∴ 1.000 = $122.056,95 - Current cycle high (resistance zone);
∴ 1.618 = $180.713,28 - Projected extension target for parabolic continuation.
✴️ Conclusion: Key retracement zones for tactical reactions lie at (0.786 - $101.7K) and (0.618 - $85.8K); upside breakout target confirmed at (1.618 - $180K).
⊢
▦ Volume + EMA21 - (Last: 2.38K BTC):
∴ Volume is stable and slightly rising compared to prior weekly sessions;
∴ No high-volume sell candles indicate panic or exit;
∴ EMA21 on volume shows baseline liquidity remains active.
✴️ Conclusion: Healthy volume confirms orderly continuation rather than climax or exhaustion.
⊢
⨀ II. Momentum & Pressure Indicators:
▦ RSI (21) + EMA9 - (66.71 / 64.34):
∴ RSI approaches the 70-level but remains below overbought territory;
∴ EMA of RSI confirms rising internal strength;
∴ No divergence is observed - internal price energy remains aligned with upward momentum.
✴️ Conclusion: RSI signals strong but not overheated momentum - bulls still in control.
⊢
▦ MACD (9, 21) - (MACD: 7,887.99 | Signal: 6,362.06 | Histogram: +1,525.93):
∴ MACD histogram remains green, showing continuation of bullish trend;
∴ The spread between MACD and Signal is positive and expanding again;
∴ No bearish crossover threat imminent at current slope.
✴️ Conclusion: MACD structure reinforces bullish pressure - trend still intact.
⊢
▦ OBV + EMA9 - (OBV: 220.38M):
∴ OBV remains in an uptrend, supporting price action;
∴ EMA overlay shows no divergence or flattening;
∴ Volume accumulation remains healthy, confirming underlying conviction.
✴️ Conclusion: OBV supports continuation - no signs of distribution.
⊢
▦ Stochastic RSI (3,3,21,9) - (%K: 93.68 / %D: 90.72):
∴ Both %K and %D lines are in the overbought zone (>90);
∴ Crossovers are still bullish but nearing potential exhaustion zone;
∴ Caution warranted for short-term momentum correction.
✴️ Conclusion: Overbought levels reached - watch for tactical slowing, though no reversal confirmed.
⊢
🜎 Strategic Insight - Technical Oracle:
∴ The weekly chart exhibits a structurally intact bull trend, confirmed by the alignment and spacing of EMA's and WMA's across all horizons (short, mid, long);
∴ Fibonacci retracement levels delineate critical reaction zones, with (0.786 - $101.745,53) and (0.618 - $85.800,12) serving as dominant retrace supports in the event of a tactical correction;
∴ The presence of a projected (1.618 extension at $180.713,28) offers a sacred path forward should price breach and sustain above the current high of $122K.
∴ Momentum oscillators (RSI and MACD) continue their upward thrust without divergence, but the Stochastic RSI warns of temporal exhaustion - a typical hallmark before consolidation or rotation;
∴ Volume structure is stable and non-climactic, suggesting continuation rather than blow-off;
∴ No sign of distribution via OBV - accumulation remains intact.
✴️ Conclusion: The market remains within the upper chamber of the Fibonacci spiral. Tactical cooling is possible due to overextension in the momentum field, but no structural damage is observed. A controlled retrace into the golden pocket would be both acceptable and ritualistically symmetrical. The path to $180K remains open, but guarded.
⊣
⟁ BTC/USD - CME Futures BTC1! - (CHART: 1D) - (Jul 27, 2025):
◇ Current Price: $120.785.
◇ Chart Link:
⊣
▦ CME Futures GAP - Observation & Ritual Closure:
∴ The current chart shows a clustered consolidation near $120K–$121K with no immediate upper gap visible;
∴ The last prominent CME Gap was filled during the late June run-up and early July vertical move;
∴ No new gap formed during the weekend-to-weekday open for the last 3 sessions - continuity is intact.
✴️ Conclusion: There is no unfilled CME Gap between the current price and previous sessions. All recent discontinuities appear ritually sealed. Attention now turns to potential downside gaps from rapid bullish impulse moves around ($104K–$108K), which could remain structurally unfilled - unless tactically challenged during correction.
⊢
🜎 Strategic Insight - CME Oracle:
∴ The lack of open CME Gaps suggests a clean technical field - no magnet effect pulling price backward in the short term;
∴ The compression near $121K may precede either an explosive breakout toward the Fibonacci extension ($122K / $130K+), or serve as a false plateau before a tactical flush;
∴ Absence of gaps also removes "gap fill" traders from immediate relevance, allowing price to move freely based on liquidity and macro flows.
✴️ Conclusion: The CME chart confirms no active gravitational pull downward - the battlefield is neutral and favorably clean for bullish continuation, pending macro and liquidity alignment.
⊢
∫ III. On-Chain Intelligence - (Source: CryptoQuant):
▦ Exchange Inflow Total + 9EMA - (All Exchanges):
∴ Exchange inflows remain significantly suppressed, with no spikes above 75K BTC since Q4 2023, despite the price nearing $120K;
∴ The 9EMA of inflows is stable and near local lows, showing no abnormal movement toward exchanges;
∴ Historically, spikes in inflow coincide with distribution, fear, or profit-taking, none of which are currently present on a structural level.
✴️ Conclusion: The on-chain exchange inflow behavior confirms low distribution pressure at current highs. The lack of elevated Bitcoin deposits into exchanges indicates conviction among holders and the absence of a mass selloff attempt, even near critical Fibonacci resistance.
⊢
🜎 Strategic Insight – On-Chain Oracle:
∴ While price consolidates near its cyclical high, exchange inflows remain muted, echoing behavior observed during earlier phases of strong market conviction (e.g., late 2020);
∴ This suggests the market is not preparing for heavy liquidation;
∴ The silence of inflows reinforces the tactical hypothesis that current price action is organic and not panic-driven, preserving the ritual path toward ($122K/$180K).
⊢
⧉ IV. Contextvs Macro-Geopoliticvs - Interflux Economicvs:
▦ US-EU Trade Accord: 1(5% Unified Tariff Across All Sectors):
∴ The United States and the European Union have reached a comprehensive trade agreement, averting escalation: a 15% unified tariff will apply across most EU exports to the US, down from a threatened 30%;
∴ Exceptionally high 50% tariffs remain on steel and aluminum, while some industries such as automotive, semiconductors, and pharmaceuticals will be capped at 15%;
∴ Zero-tariff exemptions have been granted to strategic sectors, including aerospace, select chemicals, semiconductor equipment, agricultural products, and critical raw materials;
∴ In return, the EU has committed to invest $600 billion in US infrastructure and tech, and to purchase $750 billion worth of US energy and defense products over three years.
✴️ Conclusion: The trade pact imposes moderate cost adjustments for key industries but restores transatlantic stability. Although friction remains in sensitive sectors, the agreement prevents global trade disorder and enhances strategic economic visibility.
⊢
🜎 Strategic Insight - Macro Oracle:
∴ The accord mitigates systemic trade risk and clears geopolitical uncertainty, which would otherwise impair market confidence in risk-on assets;
∴ Predictable tariffs (15%/50%) reduce abrupt inflationary shocks, enhancing macroeconomic forecasting and central bank policy latitude;
∴ Massive EU commitments in energy and defense inject transatlantic liquidity and strengthen demand for US dollar-based assets;
∴ While European manufacturers face pressure, the global system benefits from lower volatility and restored economic symmetry;
∴ This opens room for speculative and structural capital to flow more confidently into high-volatility instruments, including crypto assets.
✴️ Conclusion: The macro backdrop reinforces the sacred bullish path - a re-alignment of order in the West, combined with non-disruptive trade stabilization, lays the groundwork for continuation of liquidity-driven risk flows. Bitcoin stands to benefit as a speculative vessel in a structurally stable yet monetarily dynamic environment.
⊢
𓂀 Stoic-Structural Interpretation:
▦ Structurally Bullish - Tactically Watchful:
∴ Price remains above all critical EMA's and WMA's on the 1W chart;
∴ Fibonacci structure is intact, with the $122K high acting as ritual resistance and the (0.786 / 0.618 zone ($101K / $85K) as sacred fallback;
∴ Momentum indicators (MACD, RSI) sustain positive bias with no divergences;
∴ CME Futures show no unfilled gaps - the field is clean, allowing strategic extension.
✴️ Conclusion: The macrostructure supports continuation higher into the sacred extension zone ($130K–$180K), with short-term vigilance warranted due to overbought Stoch RSI and reduced volume velocity.
⊢
▦ Tactical Range Caution:
∴ Upper Limit: $122.056 - Cycle high and Fibonacci 1.0;
∴ Mid Guard: $112.770 - EMA9;
∴ Structural Support: ($101,745 - 0.786) Fib retrace;
∴ Golden Anchor: ($85.800 - 0.618) Fib retrace.
✴️ Conclusion: As long as price remains above $101K, the bullish code remains sealed. Breach of $85K would unlock deeper structural reassessment.
⊢
◩ Codicillus Silentii - Strategic Note:
∴ The week closes at the threshold of the Fibonacci (1.0 mark - $122.056), beneath a ceiling forged by time and belief;
∴ All technical layers are aligned, yet the silence in the inflow, the clean CME field, and macro equilibrium whisper a rarer truth - no storm is seen, but no wind is promised;
∴ This is the zone of the Watcher - where action becomes hesitation, and hesitation becomes discipline.
✴️ Strategic Note & Final Seal: Do not confuse absence of danger with presence of opportunity. A vertical structure with no threat below can still falter from within. This is a time not to act, but to remain unshaken.
⊢
⧉
· Cryptorvm Dominvs · MAGISTER ARCANVM · Vox Primordialis ·
⚜️ ⌬ - Silence precedes the next force. Structure is sacred - ⌬ ⚜️
⧉
⊢

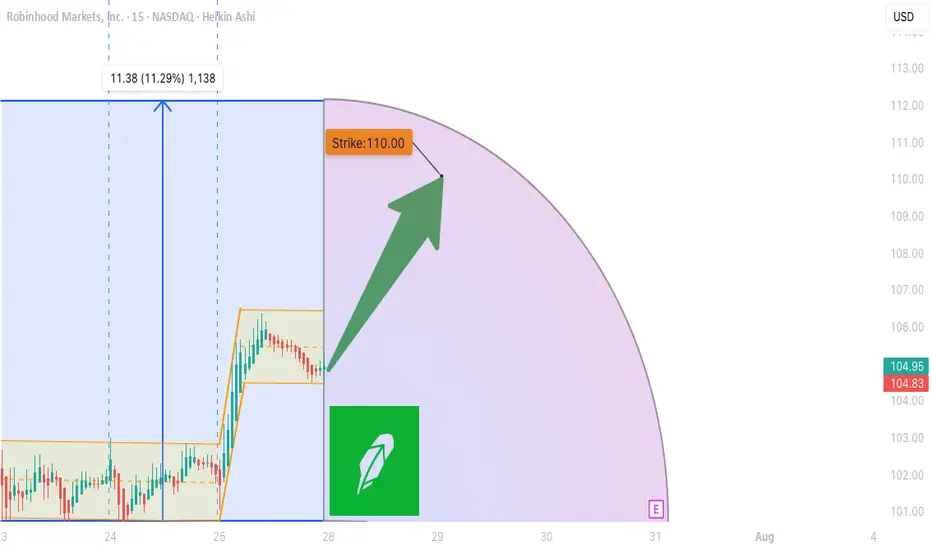
HOOD WEEKLY TRADE IDEA (07/27/2025)
**🚨 HOOD WEEKLY TRADE IDEA (07/27/2025) 🚨**
**BULLISH OPTIONS FLOW MEETS EVENT RISK CAUTION**
📊 **Options Flow Snapshot:**
📈 **Call Volume > Put Volume**
🧮 **Call/Put Ratio: 2.30** → **Institutional Bullish Flow**
📈 **Momentum Readings:**
* 🟢 **Daily RSI: Bullish**
* 🟡 **Weekly RSI: Mixed to Weak**
➡️ *Momentum is short-term positive, but not confirmed long-term*
📉 **Volume Insight:**
* **Only 0.7x** last week’s volume
➡️ *Lack of participation = ⚠️ caution*
🌪️ **Volatility Environment:**
* ✅ **Low VIX = Great Entry Timing**
* ❗ Fed Meeting ahead = Binary Event Risk
---
🔍 **Model Consensus:**
All 5 models (Grok, Claude, Gemini, Meta, DeepSeek) say:
🟢 **Moderately Bullish Bias**
✅ Bullish options flow
✅ Daily RSI uptrend
⚠️ Weak volume + Fed caution
---
💥 **TRADE SETUP (Confidence: 65%)**
🎯 **Play:** Long Call
* **Strike**: \$110
* **Expiry**: Aug 1, 2025
* **Entry**: ≤ \$2.90
* **Profit Target**: \$5.80 (🟢 100%)
* **Stop Loss**: \$1.47 (🔻50%)
📆 Entry: **Market Open Monday**
📦 Size: 1 Contract
📈 Risk-Reward Ratio: \~1:2
---
🧠 **Key Risks:**
* 📉 Volume Weakness = No confirmation
* ⚠️ **FED Event Risk** = Watch for Wednesday volatility
* ⏳ Theta decay as expiry nears
---
📌 **JSON TRADE DETAILS (for bots/scripts):**
```json
{
"instrument": "HOOD",
"direction": "call",
"strike": 110.0,
"expiry": "2025-08-01",
"confidence": 0.65,
"profit_target": 5.80,
"stop_loss": 1.47,
"size": 1,
"entry_price": 2.90,
"entry_timing": "open",
"signal_publish_time": "2025-07-27 15:09:35 EDT"
}
```
---
🔥 Stay sharp. Ride the flow, respect the risk.
👀 Watch volume + Fed headlines!
💬 Tag your team: \ NASDAQ:HOOD Bulls loading?
\#HOOD #OptionsTrading #UnusualOptions #FedWeek #WeeklyTradeSetup #TradingView #StockMarket
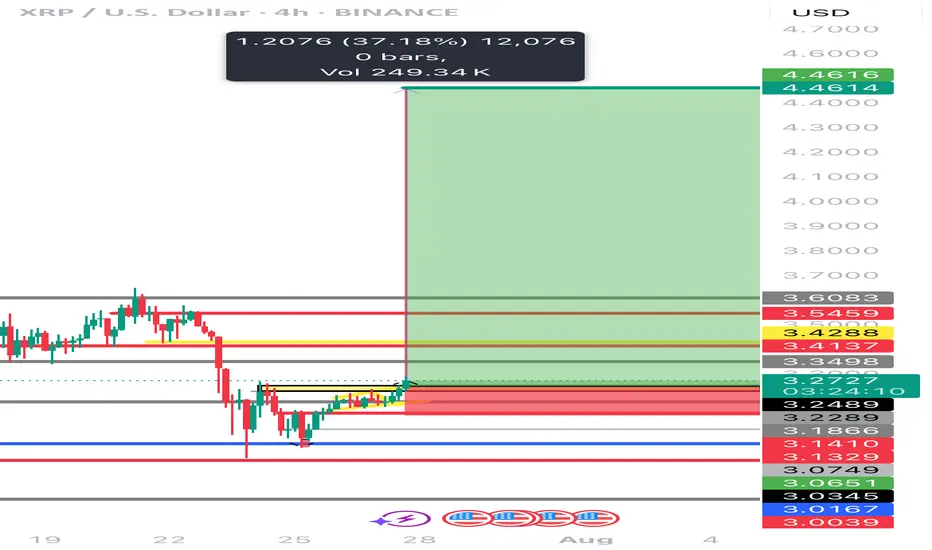
Can XRP Run 30% next week While we seen a clear cool of from XRP bullish movement in the last week are we now looking at an aggressive opportunity for the this sssest class shoot up %30 to create a new ATH of $4 and possibly beyond? Interesting times ahead with some strong news heading into next week XRP Army will have to wait and see what news comes out and will that influence XRP’s price point. The asset class sits around $3.28 at the time of this article post.
Cheers FC / EDub / AJ
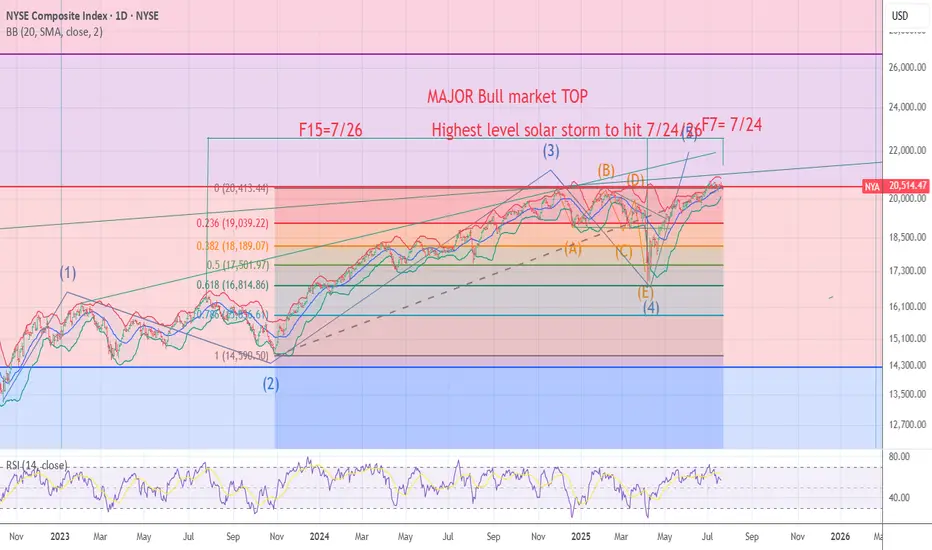
NYA chart Posted The signal for the Top is hours away .7/24/7/26The chart posted is my work based on the golden ratio and SPIRAL calendar work .We will be hit by one of if not the highest ever solar storms from 7/24 to 7/26 I will be re shorting into this date And will look for the markets worldwide to see a massive event .I have been talking a massive earthquake and the markets to begin a drop into OCT 10 to the 20th . best of trades .Wavetimer