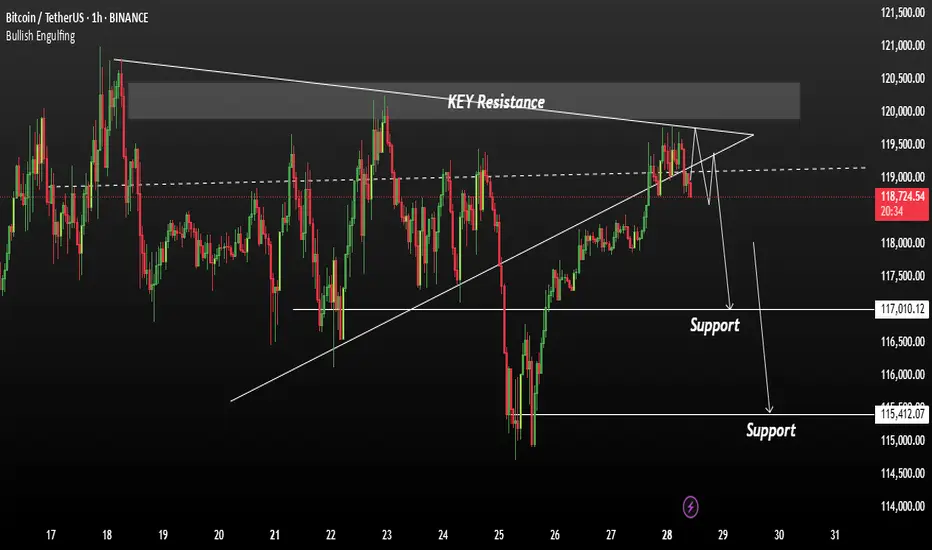
Bitcoin Could Accept bearish TrendBitcoin is currently testing a key resistance zone between 120,000 and 121,000. While price action is attempting to break higher, market conditions suggest the possibility of a false breakout rather than a sustained bullish continuation.
BTC has approached a significant resistance band, and early signs of exhaustion are visible. Unless the price decisively holds above 121,000, any breakout may lack conviction. Given the broader unresolved downtrend, a corrective move remains likely.
If the breakout fails to sustain, we anticipate a pullback toward the 117,000 to 115,000 range. This would align with a retest of previous support zones and continuation of the short-term bearish structure.
Ps: Support with like and comments for better analysis Thanks.
Beyond Technical Analysis
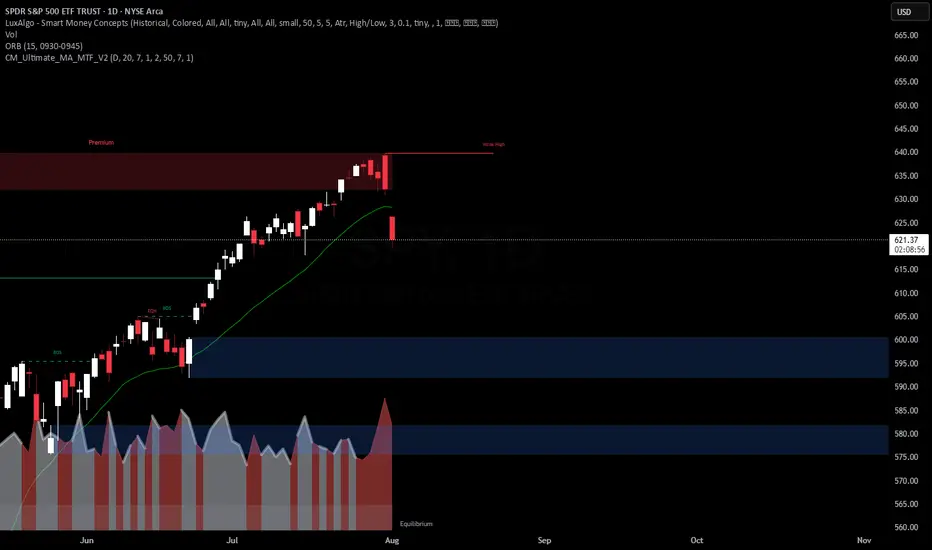
SPY: I think dollar milkshake is brewing, buying for long term📉 SPY Daily Breakdown – Aug 1, 2025 | VolanX Observations
🧠 Bot failed today, but the market taught more than any trade could have. Sitting out gave me the clarity to reassess structure and edge.
🔍 Market Structure Update:
Gap Down from Premium Zone: Today’s price action rejected the weak high and created a clean daily gap — signaling potential distribution at the top.
ORB (15-min) marked and ready: Likely to be retested on Monday. If price rallies into this zone and rejects, that’s where I’ll look for short entries.
Friday Bearish Close Rule: Statistically, when Friday closes red with strong momentum, Monday tends to follow — especially after a gap-down open.
🧭 Big Picture Outlook:
Liquidity Zones Below:
600 → First institutional reaction zone.
580 → Deeper demand and equilibrium area from previous consolidation.
Dollar Milkshake Brewing: Strong USD thesis could pressure equities short-term. This aligns with potential flow into defensives and out of high beta.
Long-Term Bias: Watching for deep discounts. If price moves into high-value demand zones, I’ll accumulate for the long haul — buying fear when it's priced in.
📌 What I’m Watching Next Week:
Monday open – will we see Gap & Go or a Gap Fill + Fade?
Reaction to ORB zone.
Volatility behavior and volume footprint in the first 90 minutes.
🔻 No trades today due to a bot error, but ironically, that gave me better vision. Sometimes, the best trades are the ones you don’t take.
VolanX Protocol engaged. Standing by.
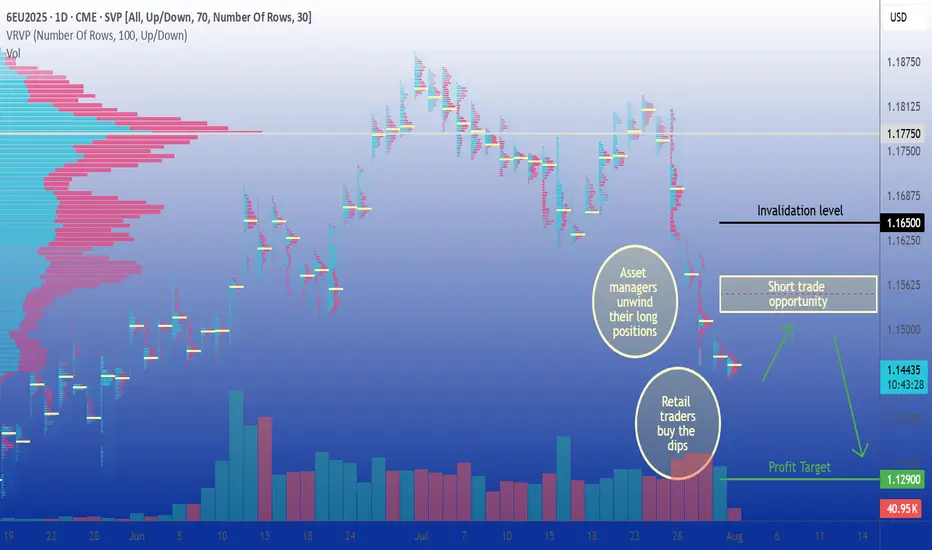
Tactical Short Setup on EURThe September 2025 Euro FX futures contract (E6U25) is currently trading around 1.1440 after topping out near 1.19 the 1st of July. This decline reflects a broader market repricing, driven by evolving expectations around monetary policy from the Federal Reserve and the European Central Bank, softening Eurozone growth prospects, and a technical backdrop that has turned decisively bearish. Coupled with shifts in sentiment and options market positioning, the current setup presents an opportunity to initiate a tactical short with an attractive risk-reward profile.
Fundamental Analysis – Central banks and diverging momentums
Monetary policies on either side of the Atlantic appear to diverge. The Federal Reserve has kept its federal funds rate steady in the 4.25%–4.50% range since December 2024, resisting political pressure to ease. In contrast, the European Central Bank has gradually lowered its deposit rate from 4% to 2.00% since mid-2024 and maintained that level in July, considering inflation is now back to its 2% target. This has widened the yield differential in favor of the U.S. dollar.
Forward guidance from both central banks suggests a cautious stance. The Fed’s June 2025 dot plot anticipates a modest rate cut by year-end, though FOMC members remain divided. Meanwhile, the ECB projects subdued inflation and modest growth, implying no urgency for further easing.
On the macro front, U.S. GDP rebounded sharply in Q2 (+3.0% annualized), though driven largely by a collapse in imports. Domestic demand and job creation have slowed, and tariffs may push core inflation above 3% again. In the eurozone, Q2 GDP barely expanded (+0.1%), with uneven performance across member states. Inflation is stable at 2%, with core pressures easing. Altogether, the dollar retains a slight edge amid firmer data and a more hawkish Fed.
Technical Outlook – Bearish shift with volume confirmation
From a technical standpoint, the E6U25 contract has clearly broken down from its prior range. The area around 1.1775, which previously served as a high-volume node and resistance, was breached with strong downside momentum. The price action has since carved out a clean pattern of lower highs and lower lows, and volume has notably increased on bearish sessions, confirming the shift in control.
The current structure suggests a vacuum between 1.1775 and 1.1500, with only minor resistance expected around 1.1545, where some residual volume lies. There is little to no support before the 1.1280–1.1300 area, which aligns with a lower volume shelf on the visible range volume profile (VRVP). If price retraces to retest the 1.1525–1.1575 zone, that area is likely to act as a tactical selling opportunity before potentially resuming the downtrend.
Sentiment Analysis
CFTC data as of late July shows asset managers holding a substantial long position in EUR/USD, though these are beginning to unwind. The positioning profile leaves the euro vulnerable to further long liquidation if the selloff deepens.
Retail sentiment reinforces this view, as most retail traders are caught on the wrong side of the move. Open interest is stable but elevated, and trading activity has begun to rise slightly, hinting at retail dip-buying that may lack conviction. No major retail capitulation has occurred yet.
Broad market volatility remains subdued, and EUR/USD-specific indicators show a similar picture. The CME CVOL Index for EUR/USD remains around 8, a level considered moderately low by historical standards, reflecting a calm, non-disruptive market environment that favors technical trading, including respect for resistance levels and trend-following strategies.
Options Analysis
According to the CME FX Options Vol Converter, the landscape for EUR/USD still exhibits a modest downside bias. Risk reversals across one to three months tenors remain slightly negative, reflecting moderate demand for euro puts.
In listed markets, CME data for August expiries shows notable open interest concentration in puts at the 1.1450 and 1.1500 strikes, with deltas indicating directional positioning rather than purely hedging activity. On the call side, interest is more dispersed but visible above 1.1650, particularly at 1.1700 and 1.1750, suggesting some appetite for upside. However, the deltas are lower.
Trade Idea
A tactical short trade is favored in the 1.1525–1.1575 zone, which coincides with a potential pullback level within a well-established downtrend. This level also aligns with a minor volume shelf, providing a natural resistance area where sellers are likely to re-enter the market.
The suggested stop level is 1.1650, just above the recent short-term swing highs, which would invalidate the current bearish structure. The target lies around 1.1290, near the next major support zone and volume cluster.
Final thoughts
The EUR/USD rally in May/June was primarily fueled by expectations of synchronized easing and softer U.S. data. However, the Fed’s reluctance to commit to a cut, combined with a relatively more aggressive ECB stance, has shifted the narrative back in favor of the dollar. With asset managers showing signs of willingness to further unwind their exposure, combined with sentiment indicators pointing to complacency, a deeper retracement remains plausible.
The technical breakdown, lack of implied vol support for a rebound, and fresh open interest on euro puts collectively argue for tactical downside continuation. The proposed trade seeks to capture that move with a controlled stop and a realistic price target. Unless EUR/USD can reclaim the 1.1650–1.1700 zone decisively, the path of least resistance remains downward.
---
When charting futures, the data provided could be delayed. Traders working with the ticker symbols discussed in this idea may prefer to use CME Group real-time data plan on TradingView: tradingview.com/cme/ .
This consideration is particularly important for shorter-term traders, whereas it may be less critical for those focused on longer-term trading strategies.
General Disclaimer:
The trade ideas presented herein are solely for illustrative purposes forming a part of a case study intended to demonstrate key principles in risk management within the context of the specific market scenarios discussed. These ideas are not to be interpreted as investment recommendations or financial advice. They do not endorse or promote any specific trading strategies, financial products, or services. The information provided is based on data believed to be reliable; however, its accuracy or completeness cannot be guaranteed. Trading in financial markets involves risks, including the potential loss of principal. Each individual should conduct their own research and consult with professional financial advisors before making any investment decisions. The author or publisher of this content bears no responsibility for any actions taken based on the information provided or for any resultant financial or other losses.
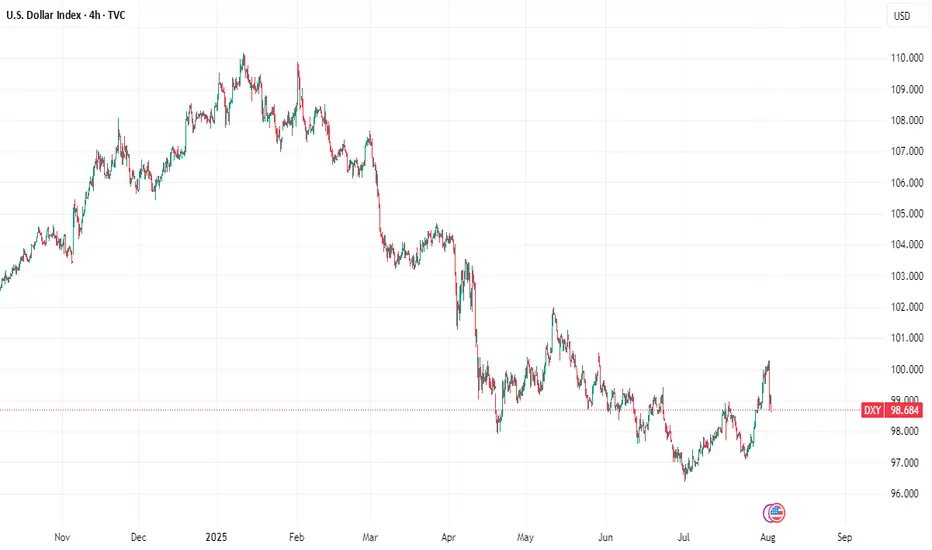
Dollar Falls as Traders Price In Two 2025 Rate Cuts on Weak JobsDollar Falls as Traders Price In Two 2025 Rate Cuts on Weak Jobs Data
Introduction
In a significant turn of events for the global currency markets, the U.S. dollar has taken a sharp tumble as traders brace for a more dovish Federal Reserve. A weaker-than-expected U.S. employment report for July 2025 has prompted market participants to price in two interest-rate cuts by the Fed before the end of the year. This shift in monetary policy expectations comes during a time of heightened global uncertainty, much of it triggered by President Donald Trump's aggressive trade policies, which have already disrupted the $7.5 trillion-a-day foreign exchange market.
The Bloomberg Dollar Spot Index, a key gauge of the dollar’s strength against major currencies, plunged as much as 1%—marking its worst single-day performance since April 21, 2025. The greenback’s decline was mirrored by strong gains in rival currencies, with the Japanese yen appreciating 2.2% and the euro climbing more than 1% against the dollar.
This article delves into the recent developments surrounding the U.S. dollar, the implications of weak jobs data, the Federal Reserve’s likely response, and how Trump’s trade policies are shaping the broader economic landscape.
________________________________________
Weak Jobs Data Sparks Policy Shift
The July 2025 employment report came in well below expectations. Non-farm payrolls growth fell short, and revisions for May and June showed fewer jobs were added than previously reported. These figures suggest that the U.S. labor market is cooling more rapidly than anticipated, raising concerns about the sustainability of the post-pandemic economic recovery.
According to Helen Given, a foreign exchange trader at Monex Inc., “It’s now clear that the U.S. labor market is cooling fairly sharply. There’s a good chance that Trump’s crusade against Chair Powell ratchets up further in the coming days, and there could be further losses for the dollar to come as a result.”
The disappointing employment data has led traders to adjust their expectations for U.S. monetary policy. Futures markets are now pricing in two 25-basis-point rate cuts by the end of 2025, a stark reversal from the earlier outlook that suggested the Fed would remain on hold or even consider tightening if inflation remained sticky.
________________________________________
The Federal Reserve’s Dilemma
The Federal Reserve now finds itself in a precarious position. On one hand, inflation has moderated in recent months, giving the central bank more room to maneuver. On the other hand, a weakening labor market could indicate a broader slowdown that might require immediate action to prevent a recession.
Fed Chair Jerome Powell has come under increasing political pressure from President Trump, who has publicly criticized the Fed for keeping rates too high. Trump argues that rate cuts are necessary to support U.S. exporters and counteract the negative effects of his own tariffs and trade restrictions.
Historically, the Fed has maintained its independence from political influence, but in an election year, the pressure to act can become intense. If the Fed moves to cut rates, it will be seen as responding to both economic data and political dynamics—a delicate balancing act.
________________________________________
The Global Currency Market Reacts
The ripple effects of the dollar’s decline are being felt across the globe. The $7.5 trillion-a-day foreign exchange market, already under strain from geopolitical uncertainty and shifting central bank policies, has seen increased volatility in recent weeks.
The Japanese yen, often viewed as a safe-haven currency, surged 2.2% against the dollar following the release of the jobs data. Meanwhile, the euro gained over 1%, reflecting investor sentiment that the greenback’s era of dominance may be waning—at least for now.
Emerging market currencies also found some relief, as a weaker dollar generally eases pressure on countries with large dollar-denominated debts. However, the overall picture remains complex, as trade tensions and capital flow volatility continue to weigh on risk sentiment.
________________________________________
Trump’s Trade Policies: A Double-Edged Sword
President Trump’s trade strategies have been a central feature of his second term in office. From imposing tariffs on Chinese imports to renegotiating trade agreements with the European Union and Canada, Trump has sought to reshape the global trading system in favor of American manufacturers.
Yet these policies have produced mixed results. While some sectors have benefited from protectionist measures, others—particularly those reliant on global supply chains—have suffered from rising costs and retaliatory tariffs. The uncertainty generated by these policies has also dampened business investment, slowed global trade, and disrupted financial markets.
“The dollar had tumbled this year as Trump’s aggressive trade policies rocked the $7.5 trillion-a-day currency market, weighing on global growth outlook,” Bloomberg reported.
Investors are increasingly concerned that continued trade friction, combined with growing political pressure on the Fed, could lead to policy missteps that undermine the U.S. economy and erode confidence in the dollar.
________________________________________
Market Implications
The dollar’s recent decline has far-reaching implications for various asset classes:
1. Equities
U.S. equities have shown mixed reactions. While lower interest rates are typically supportive of stock prices, the underlying reason—economic weakness—has investors on edge. Sectors such as technology and consumer discretionary are expected to benefit from cheaper borrowing costs, but cyclical sectors may struggle if growth slows further.
2. Bonds
Treasury yields have fallen sharply as traders anticipate rate cuts. The 10-year yield dropped below 3.8%, its lowest level in months. The yield curve has also flattened, a potential warning sign of slowing economic momentum.
3. Commodities
A weaker dollar typically supports commodity prices, as most are priced in dollars. Gold, oil, and industrial metals all saw gains in the wake of the jobs report. However, demand-side concerns stemming from a global slowdown could limit the upside.
4. Emerging Markets
For emerging markets, a softer dollar offers both relief and risk. On the positive side, it reduces debt servicing costs and can attract capital flows. On the negative side, if the dollar’s weakness reflects a broader global slowdown, risk appetite could remain subdued.
________________________________________
Looking Ahead: What to Watch
As markets digest the latest economic data and policy signals, several key developments will be closely monitored:
1. Upcoming Fed Meetings
The Federal Open Market Committee (FOMC) will meet again in September. Markets will be keenly watching for any changes in tone or new forward guidance. A rate cut in September now appears increasingly likely, especially if subsequent data confirms a labor market slowdown.
2. Inflation Trends
While inflation has moderated, it remains a key concern for policymakers. If inflation rebounds unexpectedly, it could complicate the Fed’s ability to cut rates without stoking price pressures.
3. Geopolitical Risks
Trade tensions, particularly with China and the EU, remain unresolved. Any escalation could further destabilize markets and weigh on the dollar. Additionally, developments in the Middle East, Eastern Europe, and Southeast Asia could add to the uncertainty.
4. U.S. Presidential Politics
With the 2026 presidential election campaign already underway, Trump’s rhetoric and policy decisions will continue to influence market sentiment. His ongoing criticism of the Fed could erode confidence in U.S. institutions, particularly if it leads to perceived politicization of monetary policy.
________________________________________
Conclusion
The sharp fall in the U.S. dollar following weak July jobs data marks a pivotal moment in 2025’s economic narrative. With traders now pricing in two Federal Reserve rate cuts by year-end, the stakes have never been higher for policymakers, investors, and political leaders.
While a softer dollar can provide some temporary relief to exporters and boost inflation expectations, it also reflects deeper concerns about the strength of the U.S. economy and the unintended consequences of aggressive trade policies. President Trump’s confrontational approach to global trade, combined with mounting pressure on the Fed, is creating a complex and potentially volatile environment for markets.
As the year progresses, all eyes will be on the Federal Reserve’s response, the resilience of the U.S. labor market, and the evolving political landscape. In a world where headlines can move markets in seconds, clarity, stability, and sound policy have never been more critical.
________________________________________
Disclaimer: This article is for informational purposes only and does not constitute financial or investment advice.
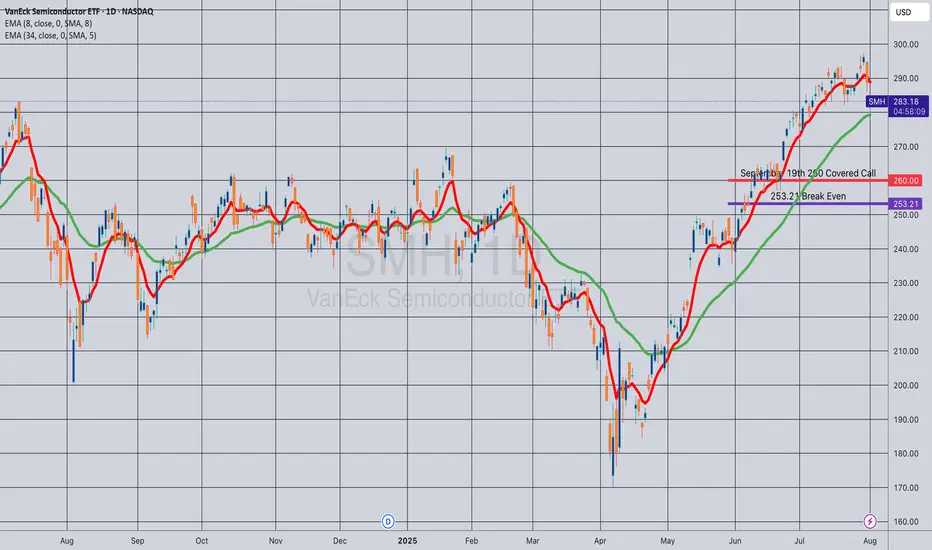
Opening (IRA): SMH September 19th 260 Covered Call... for a 253.21 debit.
Comments: One of the higher IV ETF's at the top of my board. Selling the -75 delta call against shares to emulate the delta metrics of a 25 delta short put, but with the built-in defense of the short call.
Metrics:
Break Even/Buying Power Effect: 253.21
Max Profit: 6.79 ($679)
ROC at Max: 2.68%
50% Max: 3.39 ($339)
ROC at 50% Max: 1.34%
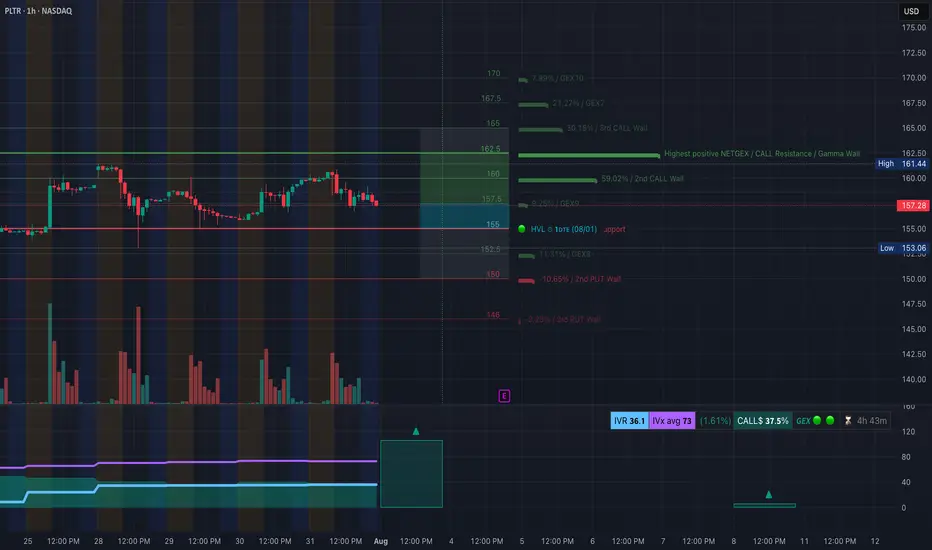
PLTR Pressured at Key Support — Can $155 Hold? 8/1PLTR Pressured at Key Support — Can $155 Hold or Is a Break to $150 Next?
🔍 GEX & Options Flow Insight (1st Image Analysis)
PLTR has been sliding after failing to hold its $160+ range and is now testing the $155–156 gamma support. The GEX profile still shows moderate call dominance, but support is thin below this level, meaning a break could bring swift downside.
* Call Walls & Resistance:
* 📍 $160.14 → 2nd Call Wall (59.02% GEX)
* 📍 $161.44 → Gamma Wall / Highest positive NET GEX
* 📍 $162.50 → 3rd Call Wall resistance
* Put Walls & Support Zones:
* 🛡️ $155.94 → Current gamma pivot and support
* 🚨 $153.06–$154.91 → 2nd Put Wall & HVL zone — break here risks slide to $150
* 📉 $146.00 → 3rd Put Wall & major downside target
* Volatility Insight:
* IVR 36.1, IVx Avg 73 → Elevated volatility
* Call flow 37.5% → Still skewed bullish, but waning
* GEX sentiment: 🟢🟡🟢 = Cautiously bullish gamma positioning but losing ground
✅ Option Trading Suggestion:
Bias: Bearish if $156 fails; bullish recovery possible only above $160
Strategy: Bear put spread if $156 breaks
* Entry Idea: Buy 155P / Sell 150P (Aug 2 or Aug 9 expiry)
* Invalidation: Strong reclaim above $160
* Target: $153 → $150
Why this works: PLTR is nearing a key gamma inflection. Below $156, dealers may need to hedge by selling, fueling a sharper drop. Bulls need to defend this pivot.
🧠 Technical Analysis (1H Chart) (2nd Image Analysis)
Market Structure & SMC:
* 🟥 CHoCH confirmed after rejection at $160+
* ❌ Broke out of ascending structure to the downside
* Sitting just above prior BOS zone at $155
Trendline Dynamics:
* Broken short-term uptrend now acting as resistance
* Downward-sloping structure points toward $153–150 retest
SMC Zones:
* 🟩 Demand Zone: $155–$153 → Current defense area
* 🟥 Supply Zone (Purple Box): $160–$162.5 → Strong resistance cluster
🔄 Price Action & Key Levels
* Support:
* ✅ $155.94 → Gamma pivot / current defense
* ✅ $153.06–$154.91 → Last key support before major drop
* 🚨 $146.00 → Next downside target
* Resistance:
* 🚩 $160.14 → First upside target if bounce
* 🚩 $161.44–$162.50 → Gamma & call wall zone
🧭 Scalping / Intraday Trade Setup
🟥 Bearish Setup (Preferred):
* Entry: Breakdown under $156
* Target 1: $153.50
* Target 2: $150
* Stop: Above $158
🟩 Bullish Reversal Setup:
* Entry: Reclaim of $160 with volume
* Target 1: $161.44
* Target 2: $162.50
* Stop: Below $158
🔁 Summary Thoughts
* PLTR is at a critical gamma support level.
* A failure here brings a quick shot to $153–150.
* Bulls must defend $156 and reclaim $160 to flip structure back bullish.
* Options positioning still leans bullish but is weakening, meaning downside acceleration risk is real.
🚨 Disclaimer:
This analysis is for educational purposes only and does not constitute financial advice. Always do your own research and manage your risk accordingly.
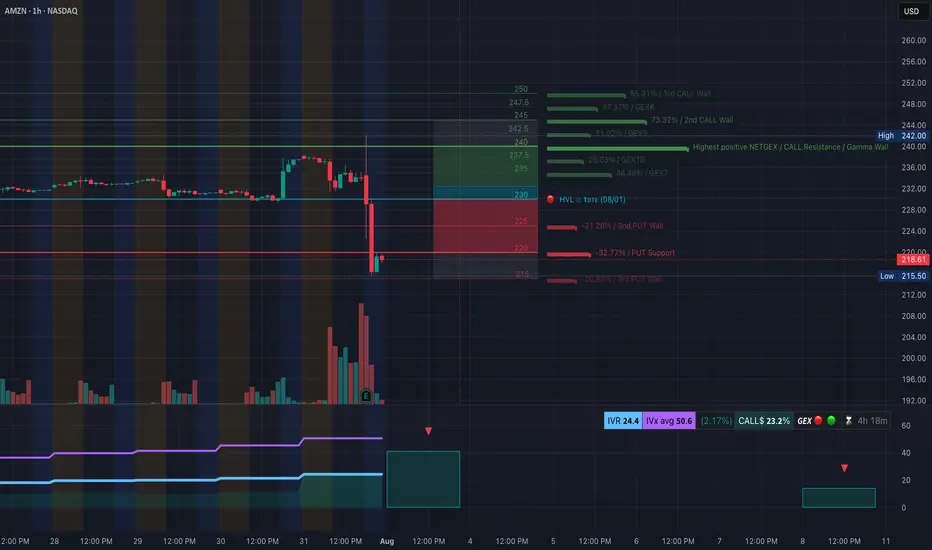
AMZN Earnings Flush — Gamma Flip to the Downside. 8/1AMZN Earnings Flush — Gamma Flip to the Downside, Eyes on $215 Support!
🔍 GEX & Options Flow Insight (1st Image Analysis)
AMZN collapsed post-earnings, breaking through major gamma support levels and flipping into a negative gamma environment. Price is now pressing against a critical $215–218 demand zone, with GEX showing heavy put concentration.
* Call Walls & Resistance:
* 📍 $230.00–$234.00 → Former gamma pivot now acting as strong resistance
* 📍 $237.50 → Prior support zone; now a sell wall
* 📍 $244.00 → Highest Positive NET GEX / Gamma Wall (too far for immediate recovery unless momentum shifts)
* Put Walls & Support Zones:
* 🛡️ $222.18 → 2nd Put Wall resistance-turned-support
* 🚨 $218.00 → Current price — key defense line
* 📉 $215.50 → Hard put wall support — losing this could accelerate selloff toward $210
* Volatility Insight:
* IVR 24.4, IVx Avg 50.6 → Elevated IV post-earnings
* Call flow 23.2% → Bearish options flow bias
* GEX sentiment: 🔴🟡🔴 = Negative gamma = higher volatility risk to downside
✅ Option Trading Suggestion:
Bias: Bearish unless AMZN reclaims $224+
Strategy: Bear put spread
* Entry Idea: Buy 220P / Sell 215P for Aug 2 or Aug 9 expiry
* Invalidation: Strong daily close above $224
* Target: $215 → $210
Why this works: Negative gamma positioning means market makers hedge by selling into weakness, accelerating downside moves. The inability to reclaim $224 confirms the bearish structure.
🧠 Technical Analysis (1H Chart) (2nd Image Analysis)
Market Structure & SMC:
* 🟥 CHoCH confirmed after earnings drop
* ❌ Lost all recent BOS levels in one sharp flush
* Price trapped under former OB resistance at $224–230
Trendline Dynamics:
* Broke out of prior bullish channel to the downside
* New descending channel forming with lower highs
SMC Zones:
* 🟩 Demand Zone: $215.50–$218.00 → Immediate defense
* 🟥 Supply Zone (Purple Box): $224–$230 → Sell wall
🔄 Price Action & Key Levels
* Support:
* ✅ $218.00 → Current defense
* ✅ $215.50 → Last line of gamma support
* 🚨 Below $215.50 → Sell momentum can accelerate to $210
* Resistance:
* 🚩 $224.00 → First reclaim needed for relief rally
* 🚩 $230.00–$234.00 → Heavy resistance
🧭 Scalping / Intraday Trade Setup
🟥 Bearish Setup (Preferred):
* Entry: Failed reclaim of $224
* Target 1: $218.00
* Target 2: $215.50
* Stop: Above $224
🟩 Bullish Reversal Setup:
* Entry: Strong reclaim of $224 with volume
* Target 1: $230.00
* Target 2: $234.00
* Stop: Back under $222
🔁 Summary Thoughts
* AMZN flipped from bullish gamma to negative gamma — puts are now driving price action.
* As long as price stays under $224, rallies are sell opportunities.
* Losing $215.50 risks an accelerated drop to $210 or lower.
* Bears remain in control unless buyers step in aggressively at support.
🚨 Disclaimer:
This analysis is for educational purposes only and does not constitute financial advice. Always do your own research and manage your risk accordingly.
META’s Monster Gap — Gamma Ceiling. 8/1META’s Monster Gap — Gamma Ceiling at $785 or Room to Run Past $800?
🔍 GEX & Options Flow Insight (1st Image Analysis)
META ripped higher on earnings momentum, gapping from the $690s into the $770s, and is now stalling just under the Gamma Wall / Highest Positive NET GEX at $784.69. Options positioning shows bullish gamma support but overhead resistance could trigger a stall or pullback before another leg up.
* Call Walls & Resistance:
* 📍 $784.69 → Highest positive NET GEX / Gamma Wall
* 📍 $800.00 → GEX10 & GEX9 ceiling = ultimate squeeze target if momentum continues
* Put Support Zones:
* 🛡️ $750.00 → Key 2nd Call Wall zone now acting as gamma support
* 📉 $700.00 / $691.30 → HVL zone + hard put support
* 🚨 Breakdown below $691 opens the door to a deep retracement
* Volatility Insight:
* IVR 5.6, IVx Avg 31.6 → Low IV = cheaper premium for directional plays
* Call flow 11.6% = Not euphoric, but bullish sentiment
* GEX sentiment: 🟢🟢🟢 = Long gamma environment, supportive of dips
✅ Option Trading Suggestion:
Bias: Bullish but extended — watch for consolidation before breakout
Strategy: Debit call spread (protects from IV crush)
* Entry Idea: Buy 780C / Sell 800C for Aug 2 or Aug 9 expiry
* Invalidation: Breakdown under 750 with volume
* Target: 785 → 800 on continuation
Why this works: META is riding strong bullish gamma positioning. As long as it holds above $750, dealer hedging supports price. Break above $785 could trigger short gamma acceleration to $800. But extended after earnings, so controlled size is key.
🧠 Technical Analysis (1H Chart) (2nd Image Analysis)
Market Structure & SMC:
* ✅ BOS + CHoCH sequence with a massive impulsive move from liquidity grab under $700
* 📈 Price is currently in the supply zone (purple box $768–$784) from historical resistance alignment
* 📊 First consolidation post-gap — watching for either breakout or gap-fill attempts
Trendline Dynamics:
* Strong bullish breakout from long consolidation
* Price is riding the upper slope of a sharp post-gap channel
SMC Zones:
* 🟩 Demand / OB Zone: $750–$724 → Ideal dip buy zone if retested
* 🟥 Supply Zone (Purple Box): $768–$784 → Current battle zone
🔄 Price Action & Key Levels
* Support:
* ✅ $750 → Former resistance, now key support
* ✅ $724 → Fib retracement confluence
* 🚨 $700 / $691.30 → HVL & hard gamma put wall
* Resistance:
* 🚩 $784.69 → Gamma Wall + supply top
* 🧨 $800 → Ultimate squeeze ceiling
🧭 Scalping / Intraday Trade Setup
🟩 Bullish Setup:
* Entry: $770–$772 dip reclaim
* Target 1: $784.69
* Target 2: $800 extension
* Stop: Close under $750
🟥 Bearish Pullback Setup:
* Entry: Rejection at $784.69
* Target 1: $760
* Target 2: $750
* Stop: Breakout above $785
🔁 Summary Thoughts
* META just printed a post-earnings breakout that could keep running into $785–$800 if gamma fuel continues.
* First consolidation after the gap is critical — if bulls defend $750, breakout setups remain strong.
* Caution chasing highs; better reward/risk comes from pullback buys into $750–$760.
* Dealers are long gamma, which supports range-bound chop with bullish bias.
🚨 Disclaimer:
This analysis is for educational purposes only and does not constitute financial advice. Always do your own research and manage your risk accordingly.

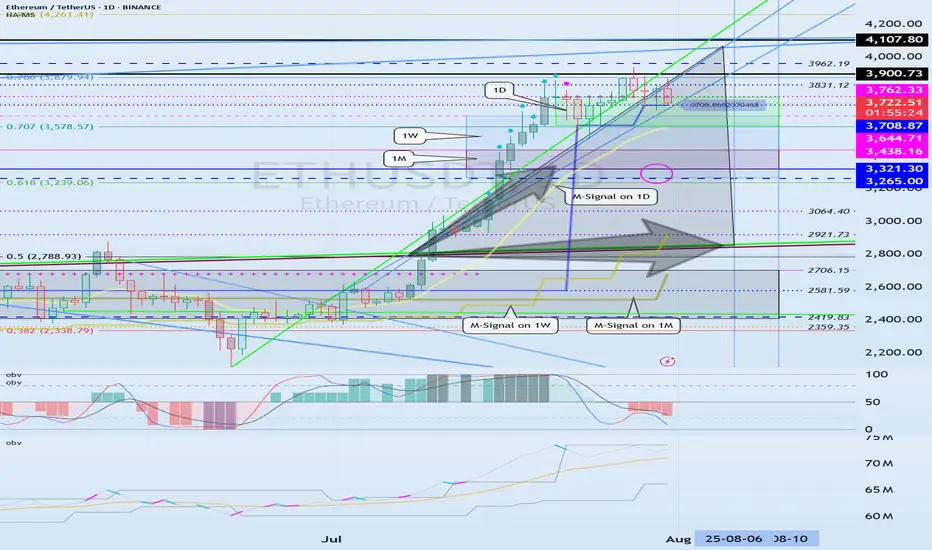
The key point to watch is whether it can rise to 3900.73-4107.80
Hello, traders. Nice to meet you.
If you "Follow," you'll always get the latest information quickly.
Have a great day.
-------------------------------------
(ETHUSDT 1D Chart)
The upward trend continues, with the M-Signal on the 1D chart > M-Signal on the 1W chart > M-Signal on the 1M chart.
Therefore, if the price holds above 3265.0-3321.30, a medium- to long-term uptrend is likely.
Currently, the HA-High ~ DOM(60) range is formed across the 3265.0-3762.33 range on the 1M, 1W, and 1D charts.
Therefore, the key question is whether support is found within the 3265.0-3762.33 range.
-
While the price is trending upward along the short-term trendline, if it falls below the short-term trendline and encounters resistance by falling below the M-Signal indicator on the 1D chart, a decline to the 3265.0-3321.30 range is likely.
ETH's volatility period is expected to last from August 6th to 10th.
The key point to watch is whether it can rise above the 3900.73-4107.80 range after this volatility period.
-
Since the StochRSI indicator has entered an oversold zone, the downside is likely to be limited.
Since the OBV indicator of the Low Line ~ High Line channel remains OBV > OBVEMA, a significant decline is unlikely.
However, since the TC (Trend Check) indicator is below zero, selling pressure is dominant.
Therefore, a decline below 3708.87 could lead to further declines. However, as previously mentioned, the decline is likely to be limited, so a significant decline is not expected.
Once the M-Signal indicator on the 1D chart is encountered, the trend is expected to re-establish itself.
-
Thank you for reading to the end.
I wish you successful trading.
--------------------------------------------------
- This is an explanation of the big picture.
(3-year bull market, 1-year bear market pattern)
I will explain in more detail when the bear market begins.
------------------------------------------------------
S&P 500 ETF & Index Hit Resistance – A Technical Warning Shot 📉⚠️ S&P 500 ETF & Index Hit Resistance – A Technical Warning Shot 🔍🧠
Following up on the video I just posted , I had to share this updated chart of the VOO ETF (Vanguard S&P 500) and US500 Index , now that both are testing key resistance levels.
On the left: AMEX:VOO has reached the very top of a multi-year ascending channel—a zone that has historically triggered sharp corrections. The level at 590.85 marks a major resistance zone.
On the right: The US500 Index is showing a similar technical overextension, trading just under 6,450, with 5,928.25 as the nearest support below.
🎯 Technicals at play:
VOO could retrace toward 526.17 and potentially 465.72, both of which are solid technical supports within this channel.
This setup doesn't mean panic—but it does argue for caution, especially after such an extended run.
🧠 And yes, the Buffett Indicator (Stocks-to-GDP) continues to point toward an overheated market . While it's not a timing tool, it adds macro weight to the technical signals.
In the video, I also touched on:
Taking profits on NASDAQ:NVDA after a near-perfect technical rejection at target.
Reviewing Rolls Royce nearing upper channel resistance.
Gold and Silver at inflection points—likely to be impacted if equities begin to unwind.
Rotational potential into Bitcoin and Ethereum, which may benefit from macro shifts.
This is how I trade: respect structure, stay proactive, and prepare before the move—not after. Let me know how you’re positioning or if you’re sitting on hands waiting for a dip.
One Love,
The FX PROFESSOR 💙
Disclosure: I am happy to be part of the Trade Nation's Influencer program and receive a monthly fee for using their TradingView charts in my analysis. Awesome broker, where the trader really comes first! 🌟🤝📈

Gold Price Outlook: Bearish Trend DevelopingGold has broken below key top resistance, indicating potential for continued downside movement.
The US Dollar's recent rise has slowed amid renewed concerns about the US-China trade truce and profit-taking ahead of this week’s key employment data, following already strong GDP and ADP reports. While the dollar remains supported overall, uncertainty is capping its momentum, indirectly adding short-term volatility to gold.
The price action suggests a bearish breakout from key resistance zones. Momentum is building toward the downside, indicating the market could continue lower unless strong support levels hold. A potential bearish flag or breakdown structure is forming, and if confirmed, we may see a decline toward next support zones.
📍 Key Levels to Watch:
Resistance: 3310 / 3320
Support: 3269 / 3240
If gold remains below the broken resistance and fails to reclaim 3320, the bearish pressure is likely to continue. Watch upcoming employment data as it could add volatility and confirm the direction.
You may find more details in the chart.
Ps: Support with like and comments for better analysis Thanks.

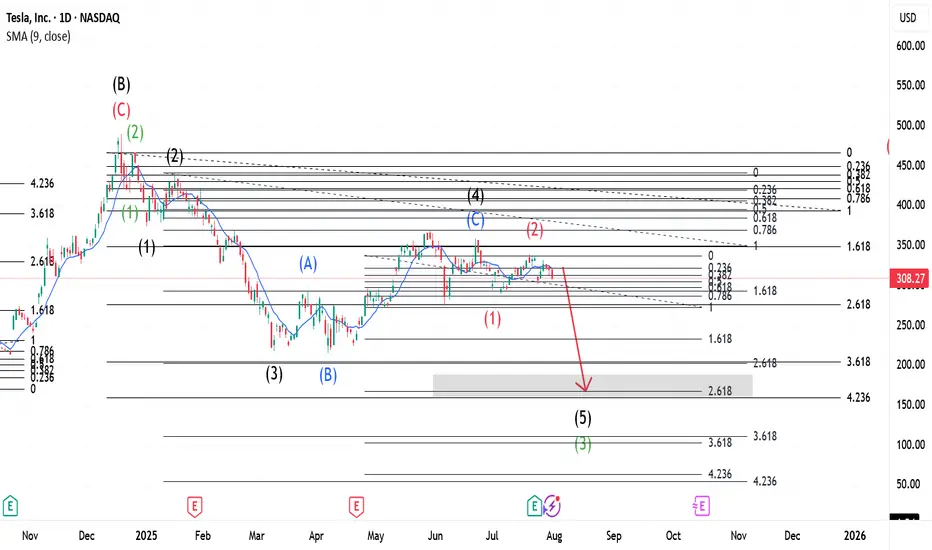
$TSLA ~ Elliott Wave Updates.This whole wave is Wave C(Black) that started when Wave B(Black) was completed. This Wave C(Black) expresses itself in 5 main waves shown in Green. Wave 2(Green) was a Zigzag and a Flat should be expected for 4(Green). Meanwhile, Wave 3(Green) expresses itself in a 5 wave move shown in Black- with Wave 2(Black) being a Zigzag, our 4 was a Flat. This Flat is shown as Blue ABC. When Wave 4(Black) completed, our Wave 5 began which upon completion, would be Wave 3(Green) of the main wave. Wave 2(Red) is a Flat and a Zigzag should be expected after 3(Red).
Go to for more information of the same.
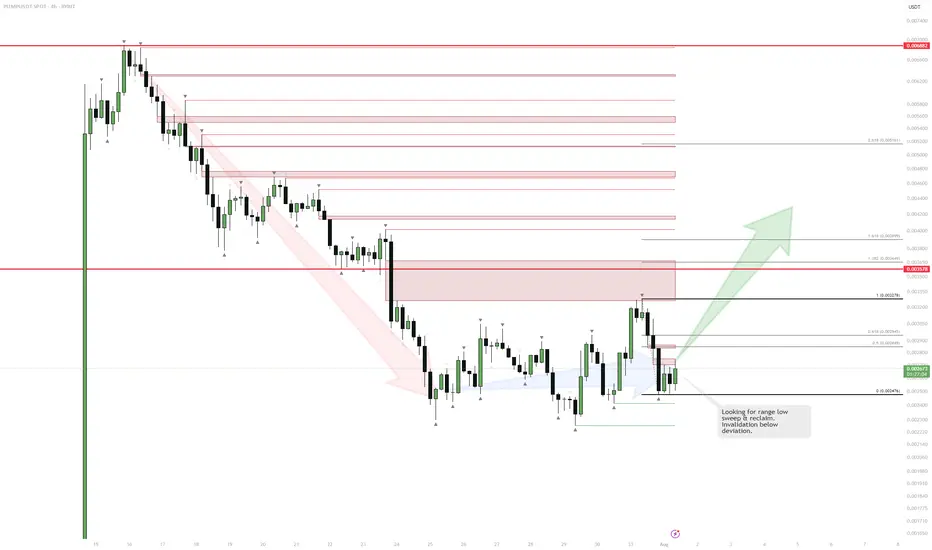
PUMP | Watching for Base ConfirmationThe sharp downtrend is showing signs of exhaustion as price starts to consolidate and build a potential range.
If we see a sweep and reclaim of the range low, that would confirm the start of a new accumulation phase and signal a potential reversal.
The invalidation for any long attempt is a confirmed breakdown below the deviation or the origin of the reclaim.
Plan:
Wait for a clean sweep and reclaim of the range low to trigger a long entry.
Target resistance levels above, with stops set below the reclaim origin.
GOOGL Slips into Bearish Gamma Territory. 8/1GOOGL Slips into Bearish Gamma Territory — Eyes on $190 Defense or Slide to $187.50
🔍 GEX & Options Flow Insight (1st Image Analysis)
GOOGL has broken down from its recent consolidation and is now testing the $190–$192 gamma support band. The GEX profile shows heavy negative gamma just below current price, increasing the risk of accelerated selling if $190 fails.
* Call Walls & Resistance:
* 📍 $194.91–$196.53 → First resistance zone
* 📍 $197.85 → Highest positive NET GEX / Gamma Wall
* 📍 $202.50+ → Out of immediate range unless a strong reversal occurs
* Put Walls & Support Zones:
* 🛡️ $190.50 → Current gamma pivot
* 🚨 $187.50 → 2nd Put Wall / Hard gamma floor
* 📉 Below $187.50 opens the door to $185–$182
* Volatility Insight:
* IVR 18.9, IVx Avg 32.5 → Slightly elevated IV
* Call flow 11.2% → Bearish leaning
* GEX sentiment: 🔴🔴🔴 = Negative gamma environment → more volatility to downside
✅ Option Trading Suggestion:
Bias: Bearish unless reclaiming $194+
Strategy: Bear put spread
* Entry Idea: Buy 190P / Sell 185P for Aug 2 or Aug 9 expiry
* Invalidation: Close above $194.91
* Target: $187.50 → $185
Why this works: Dealers in negative gamma hedge by selling into weakness, which can accelerate moves lower. Losing $190 likely brings $187.50 quickly into play.
🧠 Technical Analysis (1H Chart) (2nd Image Analysis)
Market Structure & SMC:
* 🟥 CHoCH confirmed after rejection from $197.85 supply
* ❌ Price broke BOS support from $194.91 area
* Trading in a descending structure toward $190 support
Trendline Dynamics:
* Broke short-term uptrend
* Now respecting a lower parallel channel toward $187.50
SMC Zones:
* 🟩 Demand Zone: $190.50–$187.50 → First defense zone
* 🟥 Supply Zone (Purple Box): $194.91–$197.85 → Immediate resistance
🔄 Price Action & Key Levels
* Support:
* ✅ $190.50 → Current hold line
* ✅ $187.50 → Gamma floor
* 🚨 Below $187.50 → $185 → $182
* Resistance:
* 🚩 $194.91 → First reclaim level for relief rally
* 🚩 $196.53–$197.85 → Supply + Gamma Wall
🧭 Scalping / Intraday Trade Setup
🟥 Bearish Setup (Preferred):
* Entry: Failed bounce at $194–$195
* Target 1: $190.50
* Target 2: $187.50
* Stop: Above $196
🟩 Bullish Reversal Setup:
* Entry: Strong reclaim of $196.50 with volume
* Target 1: $197.85
* Target 2: $200+
* Stop: Back under $194
🔁 Summary Thoughts
* GOOGL has shifted from neutral to negative gamma, favoring continued downside pressure.
* $190.50 is the short-term line in the sand — losing it risks a swift trip to $187.50.
* Any bounce into $194–$196 is likely to face selling pressure unless backed by volume and a gamma flip.
🚨 Disclaimer:
This analysis is for educational purposes only and does not constitute financial advice. Always do your own research and manage your risk accordingly.

NFP Friday - XAUUSD Prediction - August 2025#NFP Friday + New Month 👇
- Still leaning bearish on TVC:GOLD
- New month = re-positioning flows
- Watching 3225–3250 zone (Fib 38/50 confluence)
- Clean pullback setup near Psy level & untested orders
News Prediction:
- Labor market still holding up, I’m thinking NFP prints closer to 130k–150k, not that 110k estimate
- Yes, tech & retail saw some layoffs, but not enough to tank the whole report
- Adapt if wrong, execute if right. No stress
#XAUUSD #Gold #NFP #Dollar #NFPFriday #XAUUSD #Gold #NFP #JobsReport #Dollar #Macro #Trading #MarketOutlook #NFPFriday

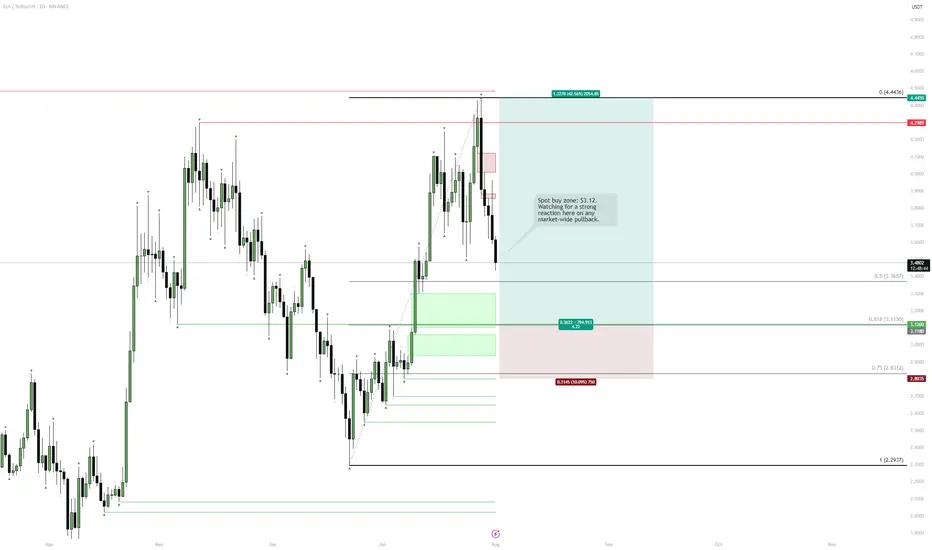
SUI | Spot Buy Zone for PullbackPrice has pulled back after a local top and is heading toward a clear demand zone.
Key buy area sits around $3.12, aligned with 0.618 retracement and recent consolidation.
Strong structure below—if majors keep retracing, this is where risk/reward for new spot buys becomes attractive.
Plan:
Waiting for price to reach the green zone to accumulate spot.
Invalidation below $2.80, targeting a move back toward $4.45 and higher if momentum returns.
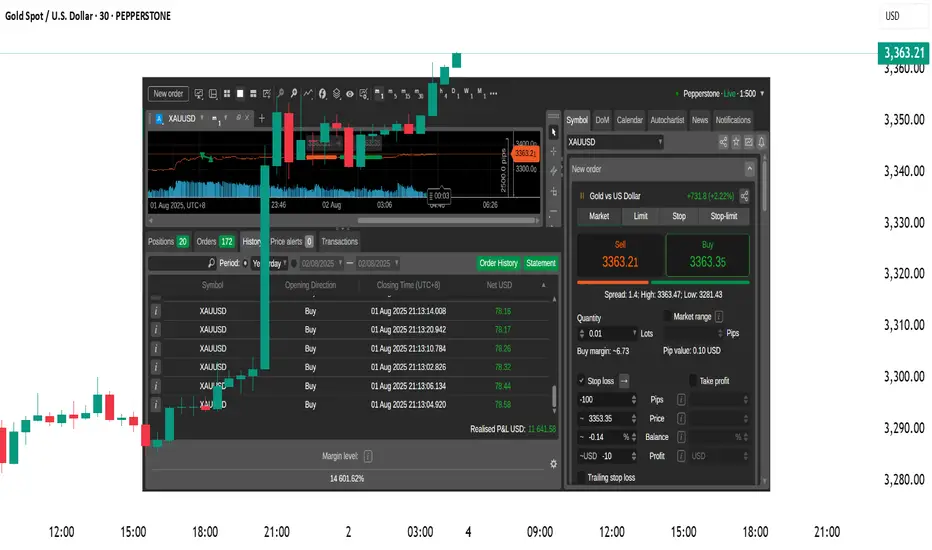
XAUUSD Live Trade Last Night (Killed it with 11,641 USD Profits)I managed to ride the momentum last night on XAUUSD and made over 11,641 usd profit on a live trading account. Gold usually create a range. It will create a top and a bottom then it will spend most of its time inside that range. That is pretty much how XAUUSD moves. If you can identify the top and the bottom then you can short it from the top and do a long trade on the bottom. The price will just travel from bottom to top and top to bottom. You can scalp your way to profits on this move if you can time it properly. Once in a while, a break from the top or the bottom happens. This is where you switch from trading the range to trading breakouts.
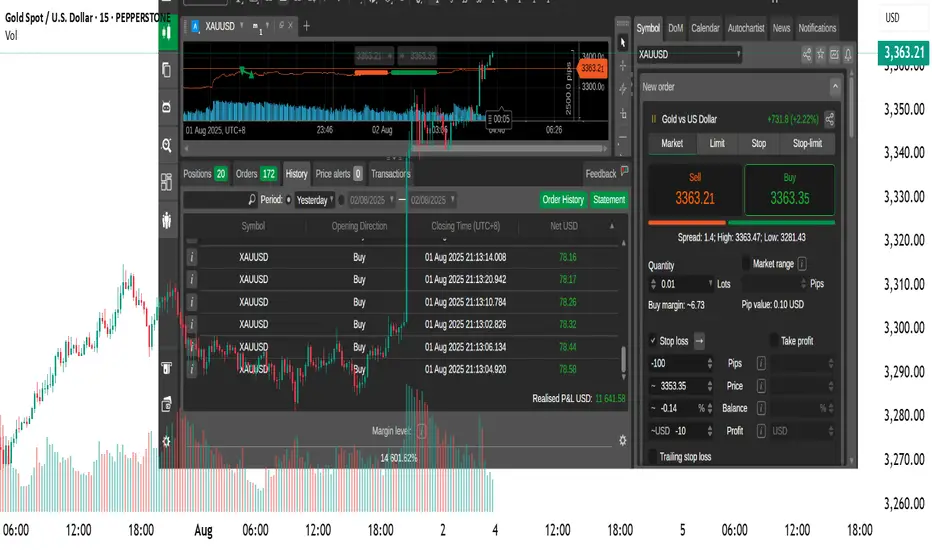
going lon after the close of 07:00 AM the price took the lequidite of a significant Low , and back to the range never close below
this low in 1H TF and 4H TF after we get HL or Swing high I enter buy

USD/CHF potential trend reversalNothing concrete yet. is the down trend over? Road Map idea correct? look for price action to confirm potential setup.
* if trend reversal is in then a major leg up for a stronger US$

XAUUSD Live Trade with 11,641 USD ProfitsI managed to ride the momentum last night on XAUUSD and made over 11,641 usd profit on a live trading account. Gold usually create a range. It will create a top and a bottom then it will spend most of its time inside that range. That is pretty much how XAUUSD moves. If you can identify the top and the bottom then you can short it from the top and do a long trade on the bottom. The price will just travel from bottom to top and top to bottom. You can scalp your way to profits on this move if you can time it properly. Once in a while, a break from the top or the bottom happens. This is where you switch from trading the range to trading breakouts.
When you trade breakouts, you must trade it with the knowledge that less than 15 percent of breakouts are successful. Failed breakouts are very common. You need to have some form of stoploss below your breakout levels. You will know that the breakout fails once your stoploss is hit. If the breakout is successful then ride it. Do not put some TP (target price or take profit price) rather just trail your profits. Move your stops a few pips behind the price. Just enough distance to let the price breathe. If the price reverses then it will hit your stops. If the breakout is strong then you will ride it for a while until it reverses.
It will form another top and bottom again and move inside that range. Switch your approach again in trading long trades near the bottom and short trades near the top.
Just remember to always have some stoploss on every trade and never try to predict what the market will do or how the price will move. Let the market do its thing and just react to its movements.
Goodluck on your trades.
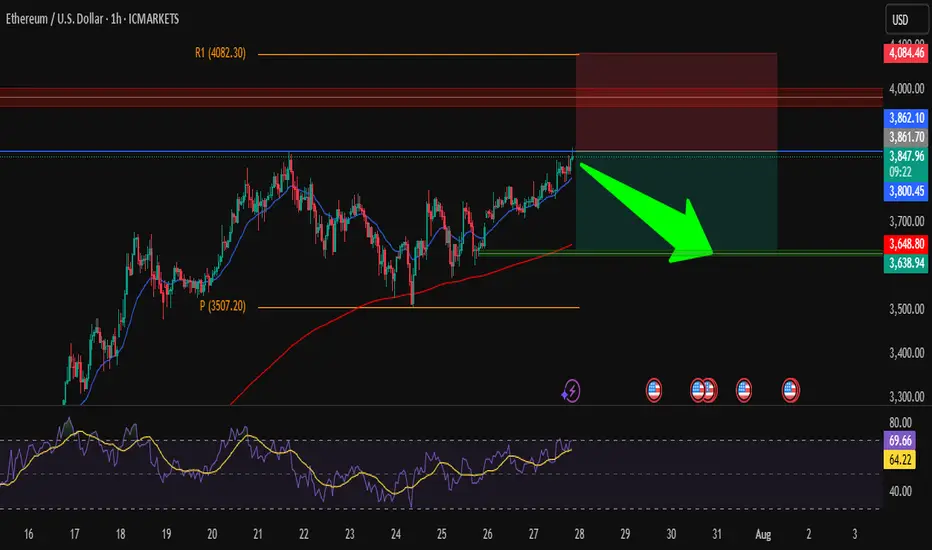
ETH/USD – Short from ResistanceHi traders ! , I opened a short position on ETH/USD as price is hitting a strong resistance zone.
Entry: 3850
SL: 4084.46
TP: 3638.94
📌 Why I took this trade:
Price is testing a strong resistance zone around 3860, RSI is overbought, and we could see a pullback toward the support area around 3640.
Nice risk/reward setup, keeping it simple.
This is just my analysis, not financial advice.
What’s your view — drop or breakout?
VIX: From “Calm Tension” to a ReboundWhy does a small uptick matter today… if we’ve already seen 60+ readings four times in the past 17 years?
The first week of August 2025 brought back a familiar market force: volatility.
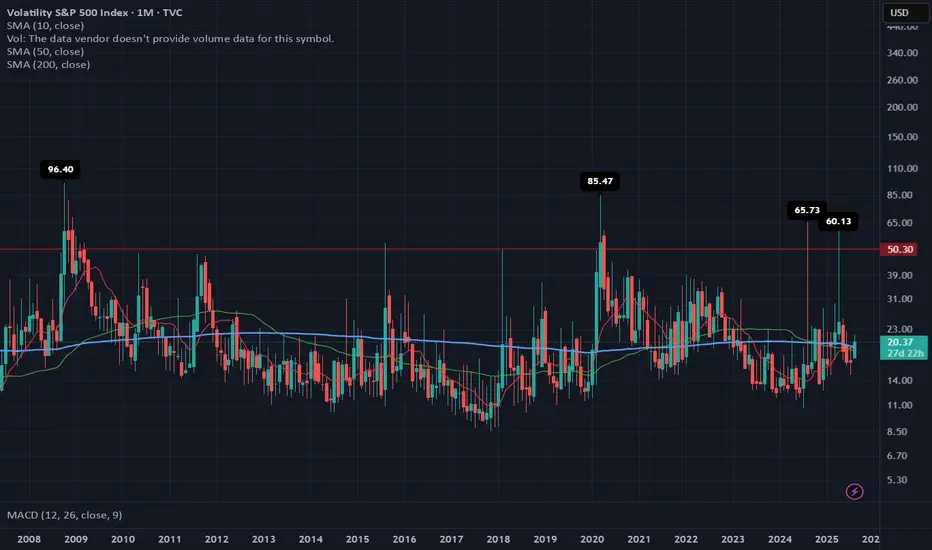
The VIX, which tracks expected fluctuations in the S&P 500, jumped 21% in just a few days, rising from 17.4 to 20.37, with an intraday high of 21.9 on August 1.
At first glance, the move may seem minor. But it broke through key long-term moving averages (SMA 50 and 200) and exited its recent comfort zone (14–19 pts). That alone is enough to make portfolio managers and traders pay attention again.
🔙 Historical context: when the VIX truly spiked
📅 Date 🔺 VIX intraday 🧨 Trigger
Oct 1, 2008 96.40 Subprime mortgage crisis, Lehman collapse, AIG bailout
Mar 2, 2020 85.47 COVID-19 global spread, border shutdowns
Aug 5, 2024 65.73 Surprise Fed rate hike + overheated jobs data
Apr 7, 2025 60.13 Panic over new U.S. tariffs on global partners
Compared to those moments, today's VIX levels look “mild.” But the technical and macroeconomic signals suggest that volatility may be establishing a new baseline.
1. 📊 Breakdown: First week of August 2025
Weekly increase: from 17.4 → 20.37 (+21%).
Technical breakout: monthly close above both the 50-day and 200-day simple moving averages (SMA 19.25 and 19.45).
MACD on the monthly chart has flipped positive for the first time since March 2023.
Key drivers:
🏛️ The Fed left interest rates unchanged on July 30, but two dissenting votes favored a rate cut.
👷♂️ Softening jobs data: July NFP came in at only +73,000 jobs (vs. +110,000 expected).
🧾 New U.S. tariffs, announced on August 1, reignited inflation concerns.
2. ⚖️ Comparing August 2025 to the August 2024 storm
Factor August 2024 August 2025 (Week 1)
🔺 VIX peak 65.73 21.9
🏛️ Fed stance Surprise 25 bp rate hike Rates unchanged, internal division
👷 Labor market Hot, wage pressures Cooling down
📉 S&P 500 reaction −12% in 3 weeks Approx. −3% decline underway
💧 Market liquidity Very low (pre-market) Normal
Conclusion:
2024 was a systemic shock.
2025 is more of a volatility warning sign—but one that matters for risk management.
3. 📍 Technical signals to monitor
The monthly MACD just turned positive, which historically precedes sustained volatility spikes.
Key short-term range: 18–22 pts. A sustained close above 22 could trigger heavy selling in high-beta stocks.
Options expiration (OPEX, Aug 16) may amplify moves via gamma flows.
4. 🔮 What could move the VIX next?
📅 Date 📌 Event ⚠️ Volatility Risk
Aug 14 Core CPI (July) Reading above 0.3% m/m could reignite hawkish Fed bets
Aug 22–23 Jackson Hole Symposium Powell’s speech could reset the policy outlook
End of Aug Q2 GDP revision Confirm whether slowdown = soft landing or stagflation
📌 Note: The VIX cannot be traded directly. Exposure is typically obtained through futures, options, or ETNs—each with specific risks like contango, low liquidity, and roll decay.
📌 Final thoughts
The VIX doesn’t need to hit 60 to send a message.
The fact that it’s breaking above long-term averages, reacting sharply to macro data, and threatening key levels is enough to suggest that the era of ultra-low volatility may be ending.
History shows us that major VIX spikes come fast and unannounced.
If you remember 2008, 2020, or even April 2025—you know that preparation beats prediction.
Targets and their point in timewe use the threshold breaks to determine targets AKA areas of liquidity. we also utilize pattern detection paired with the threshold breaks to validate cycles and where we are in said cycle.
