Bullish or Bear trapHello Traders 👋
What are your thoughts on XAUUSD
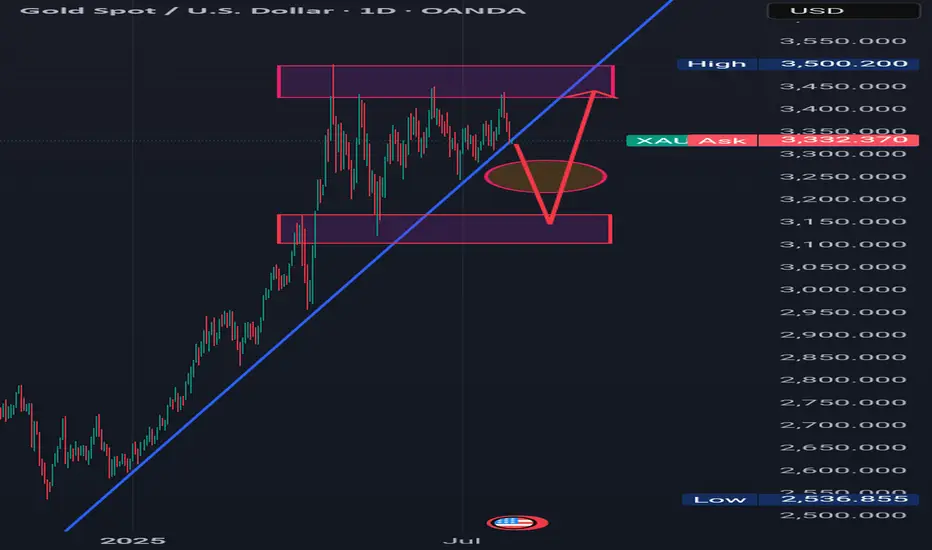
Looking at the daily timeframe I anticipate manipulation by market players on gold.
Is likely that market players will stop Hunt Traders who have their stop losses at the different lows which is indicated with a red circle.
For every buyer there must be a seller and for every seller there must be a buyer.Where they are no sellers in the market the institutions will want to trigger stop losses in order to buy,which is known as stop hunting.That is to takeout previous buyers in the market and generate liquidity to buy.
And this stop hunting usually happens in a ranging market.
Looking at the structure of gold we can see that gold is ranging,
We can see a low or support of the range which was previously resistance and turned support for the ranging market.
I see the market using sell liquidity to liquidate buyers and react at the support or low of the range and move up to the range of the resistance
Beyond Technical Analysis
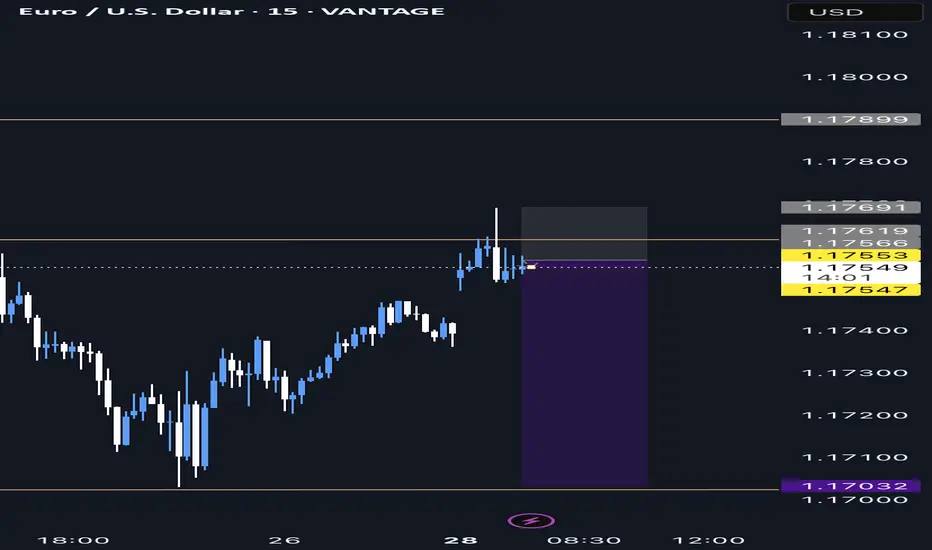
EURUSD SHORT IDEAIm looking for short positions on EUR/USD. Since Price Currently in a significant key level and swept the previous day high and previous day asian high . Also the candlestick was closed in engulfing in m15 and m30 which indicate there is seller in the market . All the best adios 🙏
The Golden Age 7000 EOY SPXThe Golden Age (year) is here!
Have cash ready for May in April. Be heavy hedges going in to 26.
We're going to juice earnings with all the investments pouring in for just about every single industry. Once the injection is complete, we will reset while all the invested money completes projects.
GL!
Better Buy Bitcoin

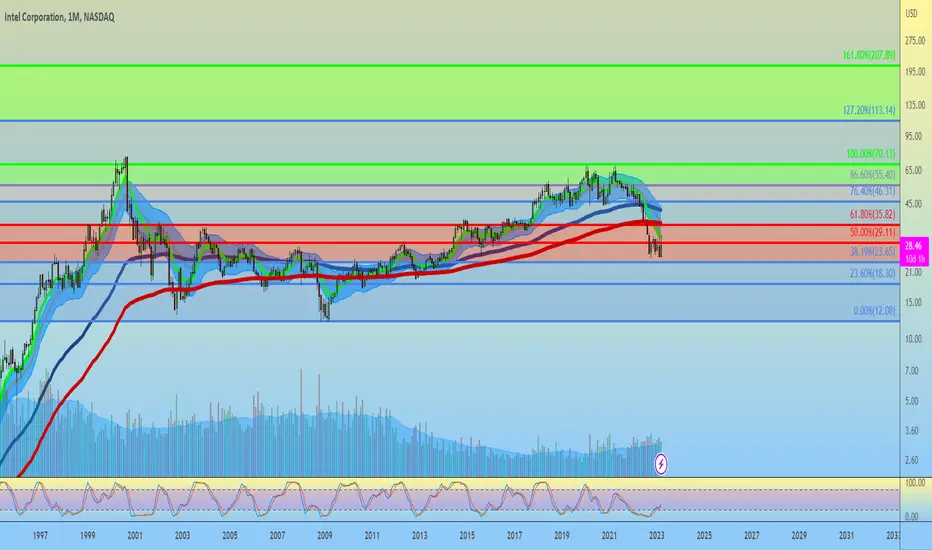
NVDA to save IntelThis may be one of the best entries you get to intel in your life time. NVDA just announced today that all of their new super computer systems are utilizing Intel chips alongside NVDA chips. This is going to push a huge surge in demand for Intel, and also help them get back on track with creating chips that the market/future market actually wants/needs.
This gives actual opportunity for Intel to turn the ship around and lead to years if not a decade of growth.
Hugely risky play. GL
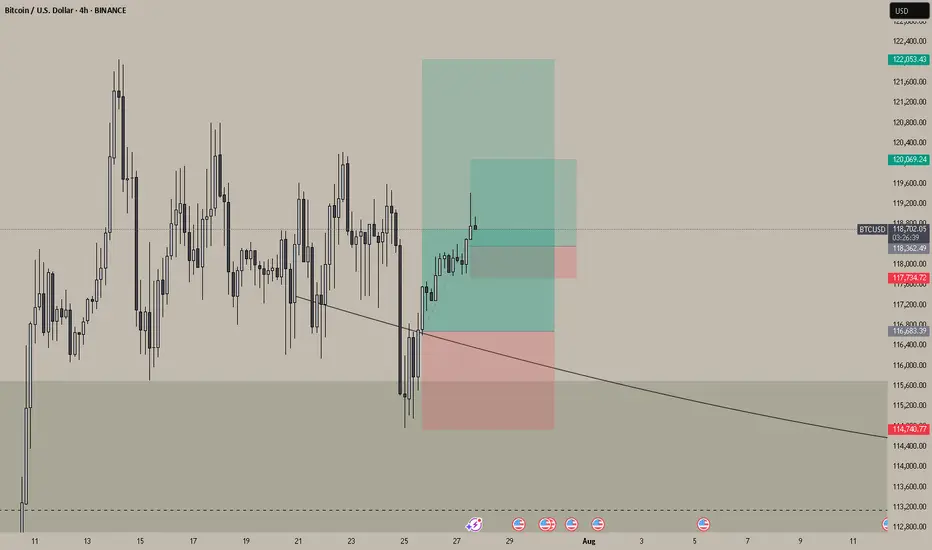
BTC/USD Buy Setup (6H Chart)📈 BTC/USD Buy Setup (6H Chart)
Strategy: Trendline Support Bounce
🔹 Entry
Price: $118,674.3
Reason: Price is bouncing off a supportive trendline and holding above the 1st Support zone.
🔻 Stop Loss (SL)
Price: $114,470.6
Reason: Below the 1st Support zone to protect against breakdown.
🎯 Take Profit Targets
TP1: $123,269.6
Reason: Near recent swing high, good for partial profit.
TP2: $127,661.4
Reason: Next resistance zone, ideal for full exit or trailing stop.
#MJTrading
#Bitcoin

A POTENTIAL TREND REVERSAL Hello Traders 👋
What are your views about EURUSD
Looking at the daily timeframe we can see that price action didn't take out liquidity at the top which is indicated with a blue rectangle.
Am seeing price action retracing to that liquidity zone which is indicated with a blue rectangle and from there reversing to the downside.
Let's look at the fundamental analysis of EURUSD.
Trump announced the conclusion of a trade agreement with the EU:
The EU will invest $600 billion more in the US than before
15% tariff on EU goods, including cars
All EU countries will open their markets to the US
EU to purchase hundreds of billions of dollars worth of military equipment
EU to purchase $750 billion worth of energy from the US. Energy is a key part of the agreement.
PS:
It is worth monitoring the market reaction from the opening. Pay attention to the market reaction during different sessions.
Markets may react ambiguously, but against the general backdrop, the following reaction should be expected:
USD → sharp rise (dollar strengthening due to capital inflows and growth in energy exports).
EUR → down, as the EU will bear the costs of tariffs and rising imports from the US.
Gold → down (correction or decline due to the strengthening of the dollar and reduced demand for hedging).
BTC → neutral or slight decline (due to USD strength):
If the agreement stimulates the economy and liquidity, this could be a bullish factor for BTC.
………………………………………….

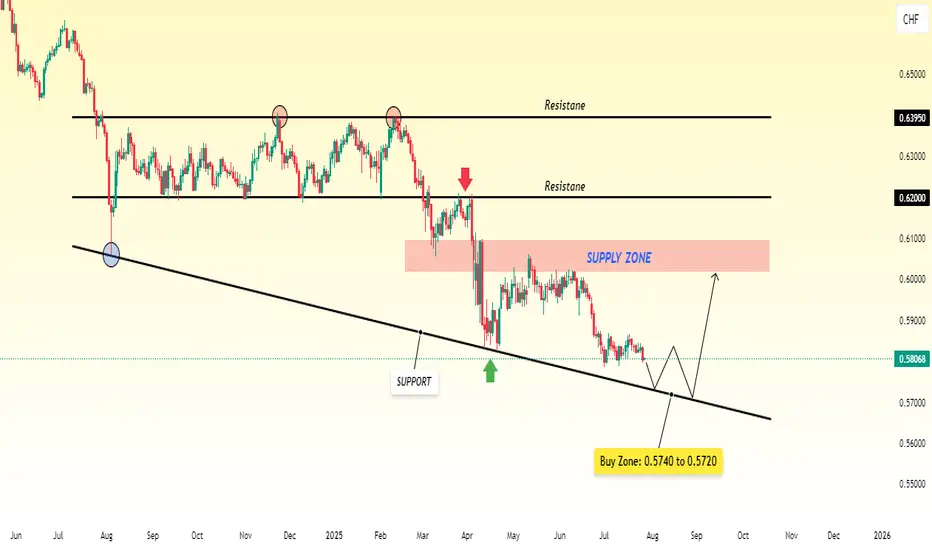
CAD/CHF Falling Toward 0.5740–0.5720: Buyers May Step In1. Trend Direction :
CADCHF is currently bearish — the price is going down consistently.
2. Price Action :
The pair is still falling and has not shown signs of reversing yet.
3. Target Area for Drop :
I expect the price to continue falling toward the 0.5740 to 0.5720 zone.
→ This is a support area, where price may slow down or bounce.
4. Support Level Importance :
This zone has acted as support in the past, meaning buyers might step in again here.
5. Buy Interest Zone :
If the price holds above 0.5720 and shows signs of strength, buying interest could return.
6. Possible Reversal :
From this support zone, there's a chance that CAD/CHF may reverse and move back up.
7. What to Watch For :
Look for bullish price action (like strong candles or a break of minor resistance) in the support area before considering long (buy) positions.
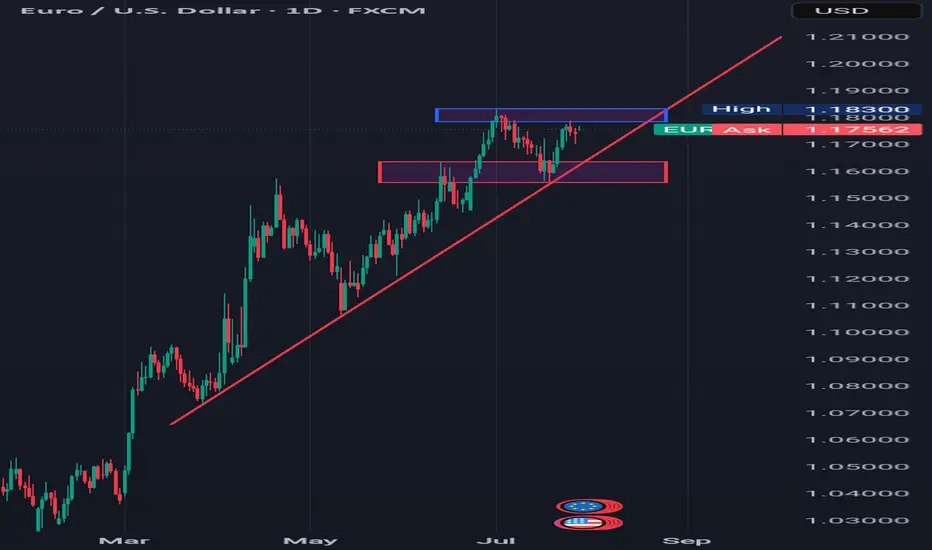
A POTENTIAL TREND REVERSAL Hello Traders 👋
What are your thoughts on EURUSD
Looking at the daily timeframe we can see that price action didn't take out the liquidity which is located with a blue rectangle which is also acting as the all-time high for EURUSD.
I'm seeing price retracing to reach the liquidity around that blue rectangle and then after start falling downwards.
Let's look at the fundamentals of EURUSD
Trump announced the conclusion of a trade agreement with the EU:
The EU will invest $600 billion more in the US than before
15% tariff on EU goods, including cars
All EU countries will open their markets to the US
EU to purchase hundreds of billions of dollars worth of military equipment
EU to purchase $750 billion worth of energy from the US. Energy is a key part of the agreement.
PS:
It is worth monitoring the market reaction from the opening. Pay attention to the market reaction during different sessions.
Markets may react ambiguously, but against the general backdrop, the following reaction should be expected:
USD → sharp rise (dollar strengthening due to capital inflows and growth in energy exports).
EUR → down, as the EU will bear the costs of tariffs and rising imports from the US.
Gold → down (correction or decline due to the strengthening of the dollar and reduced demand for hedging).
BTC → neutral or slight decline (due to USD strength):
If the agreement stimulates the economy and liquidity, this could be a bullish factor for BTC.
………………………………………….
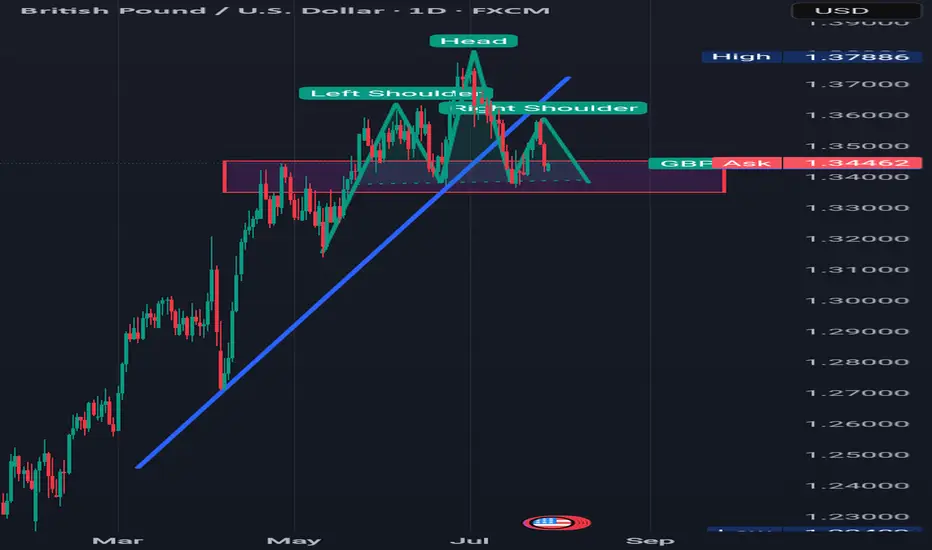
A POTENTIAL TREND REVERSALHello Traders 👋
What are your views about GBPUSD
Looking at a daily time frame we can see that press action has broken a rising trend line and also we are seeing a potential head and shoulder pattern.
For further clarification we need to see if the price action can break a demand zone which is indicator with a red rectangle.
This will give us a strong conviction that the dollar is already buying and GBPUSD is set for further downside.
Ethereum Weekly Recap & Gameplan | 27.07.2025📈 Market Context:
ETH followed the broader crypto market momentum led by Bitcoin, supported by institutional demand and positive macro policies in the U.S.
Last week’s plan played out cleanly — we saw strong gains from the 1H demand zone.
🧾 Weekly Recap:
• Price swept 4H swing liquidity and formed a 1H bullish BOS
• Created a solid 1H demand zone, from which price bounced strongly
• Momentum remained bullish as forecasted in last week’s post
📌 Technical Outlook:
→ Expecting a short retracement into 4H liquidity levels around 3761$ or 3702$
→ Then a continuation move towards ATH zone
🎯 Setup Trigger:
What I’m watching:
✅ Sweep of 4H liquidity
✅ Bullish BOS on 15M–30M
→ This will serve as the confirmation for long entries
📋 Trade Management:
• Stoploss: Below the confirmation swing low
• Target: 4100$
💬 If you found this helpful, don’t forget to like, comment, and follow — I share setups like this every week!

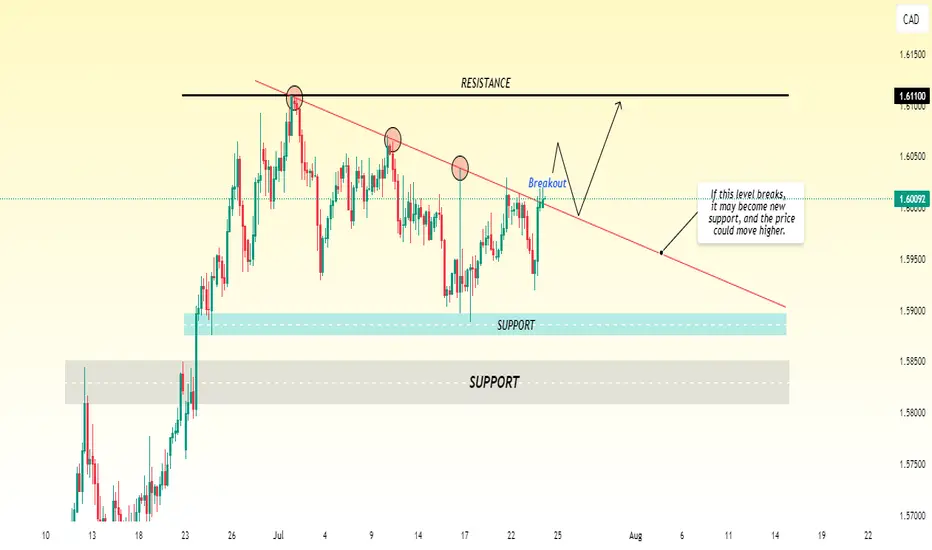
EUR/CAD Tests Resistance — Bullish Breakout in Sight?EUR/CAD appears to be showing bullish momentum and is likely heading toward the 1.6110 level. Currently, the pair is testing a key resistance zone. If the price manages to break above this resistance with strong volume or confirmation, we could see further upside continuation toward the next target at 1.6110. Traders should watch for a clear breakout and possible retest of the broken level turning into support, which could provide a good entry point for long positions.
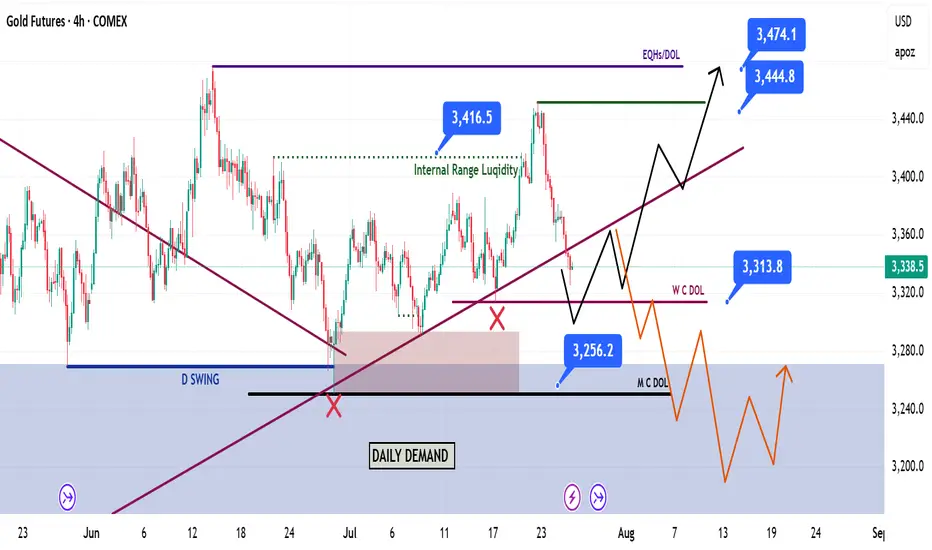
GOLD - GC Weekly Recap & Outlook | 27.07.2025🧾 Weekly Recap:
• Price tapped into the 1H Demand Zone (red box) and ran the 4H swing liquidity before bouncing to clear internal range liquidity.
• This move was followed by a retracement which led to a break of the bullish trendline.
This may signal the beginning of a broader accumulation phase. Expect choppy price action targeting internal liquidity both above and below, before a clear trend resumes.
📌 Technical Analysis:
Price has closed below the bullish trendline, leading to two possible scenarios:
1. Bullish scenario (black path):
– Price runs the W C DOL (3313$) →
– Finds rejection →
– Retests broken trendline →
– Breaks above the trendline →
– Continues toward 3444$ and potentially 3474$
2. Bearish scenario (orange path):
– Price runs W C DOL (3313$) →
– Rejects from the broken trendline →
– Fails to reclaim it →
– Continues downward to target M C DOL (3256$)
📈 Setup Trigger:
Wait for clear 1H–4H supply/demand zone creation and structure shift before initiating a trade.
🎯 Trade Management:
• Stoploss: Above/below relevant supply-demand zone
• Targets:
– Bullish: 3444$, 3474$
– Bearish: 3256$
🟡 If you liked the idea, feel free to drop a like & comment — and don’t forget to follow for more weekly updates.
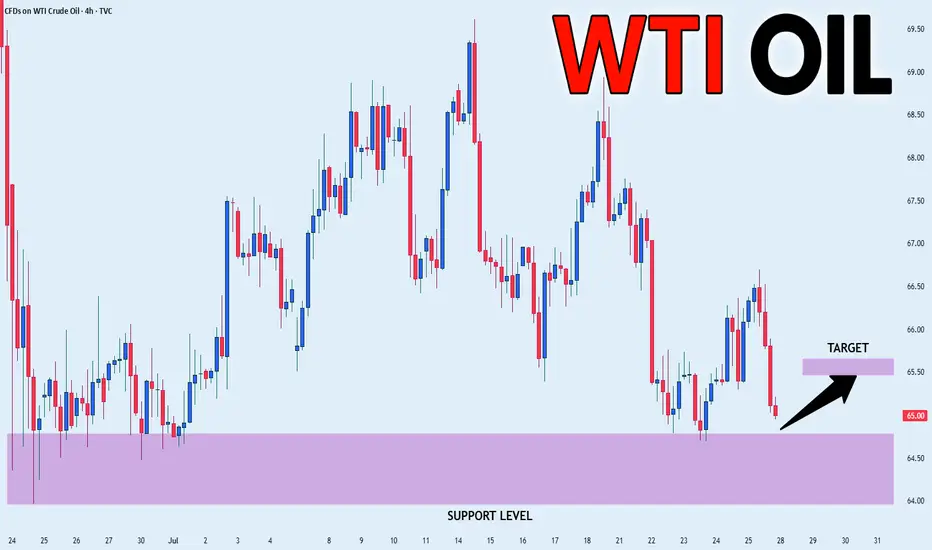
CRUDE OIL REBOUND AHEAD|LONG|
✅CRUDE OIL is going down now
But a strong support level is ahead at 64.69$
Thus I am expecting a rebound
And a move up towards the target of 65.50$
LONG🚀
✅Like and subscribe to never miss a new idea!✅
Disclosure: I am part of Trade Nation's Influencer program and receive a monthly fee for using their TradingView charts in my analysis.
SEI — Breakout & D1 OB Target1. Support 0.33–0.36 holding
2. Entry after SR breakout
3. Target: D1 OB 0.47–0.54
4. Stop below 0.33

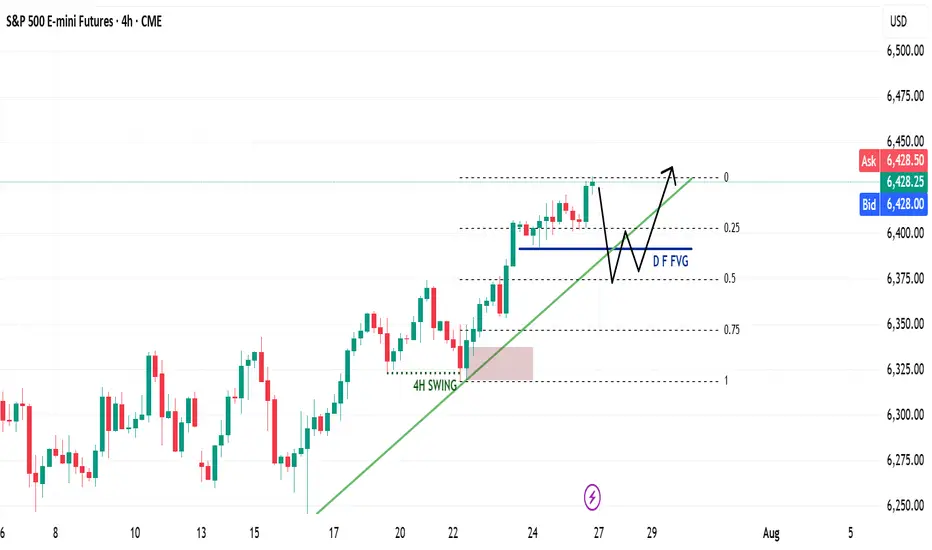
ES Weekly Recap & Gameplan – 27.07.2025🧭 Market Sentiment
The overall sentiment remains bullish, supported by:
• Declining inflation figures
• Trump’s pivot toward aggressive rate cuts
This shift reinforces a risk-on environment across U.S. indices.
🔙 Previous Week Recap
• ES continued its price discovery journey
• Price ran the 4H swing liquidity and shifted market structure
• A clean 1H demand zone was established post-MSS, leading to a strong move toward new ATH
• A bullish trendline has also formed as a visual representation of this momentum
• I anticipated a deeper retracement last week but adjusted my execution based on the ICT SMT concept — see previous week’s ES plan for details
📊 Technical Analysis
Looking forward:
• My expectation is a continued bullish price discovery
• Watching for price to tap into and potentially deviate below the Daily Fair Value Gap (D-FVG)
• This zone also aligns with the 0.5 Fibonacci equilibrium level, which I consider a discounted entry zone
• Confluence of liquidity + trendline + FVG + Fib makes this an ideal location for new long setups
⚙️ Setup Trigger & Trade Plan
Entry Strategy:
• Wait for a clear 1H–4H market structure shift
• Look for demand zone formation within the discount zone
• Execute long trades after confirmation and retracement into this zone
Trade Management:
🎯 Target: New All-Time Highs
⛔ Stoploss: Swing low beneath 1H–4H demand structure
🗨️ If you found this analysis helpful, don’t forget to like and drop a comment below — I’d love to hear your thoughts and setups for the week!
📥 Follow me for more weekly breakdowns and real-time updates throughout the trading week.
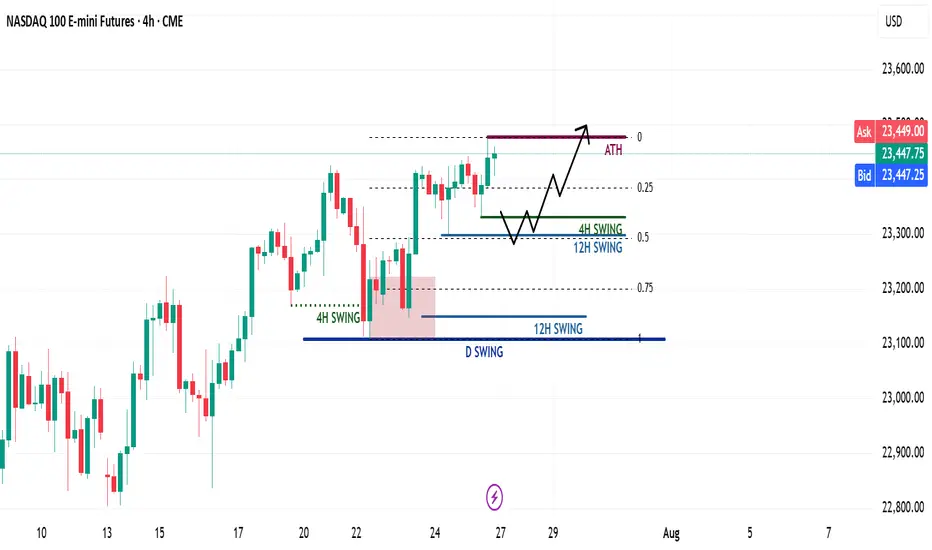
NQ Weekly Recap & Gameplan – 27.07.2025🧭 Market Sentiment
The overall sentiment remains bullish, supported by:
• Lower inflation data
• Trump’s policy shift toward aggressive rate cuts
This creates a strong risk-on environment across U.S. indices.
🔙 Previous Week Recap
• NQ continued its price discovery phase
• Price swept 4H swing liquidity and triggered a market structure shift
• A new 1H demand zone was formed after MSS
• Price revisited the 1H demand and launched toward new all-time highs (ATH)
• While I anticipated a deeper retracement, ES provided the cleaner pullback
• I executed longs on both ES and NQ using SMT divergence (ICT SMT concept)
📊 Technical Analysis
My bias remains bullish as long as the higher timeframe structure holds.
For the upcoming week:
• Watching for either the 4H or 12H swing high to get swept
• Ideally, a retracement toward the 0.5 Fib level, which aligns with my bullish discount zone
• A clean liquidity sweep into this zone could act as a launchpad for the next leg higher
⚙️ Trade Setup & Execution Plan
Entry Strategy:
• Wait for a new 1H–4H Market Structure Shift
• Identify the new demand zone post-MSS
• Look for price to return to the zone for a long opportunity with LTF confirmation
Trade Management:
🎯 Target: New ATH
⛔ Stoploss: Swing low of the 1H–4H demand zone
📌 Chart will include Fib levels, MSS zones, and execution trigger areas.
Let me know your thoughts or share your plan below.
Happy trading!
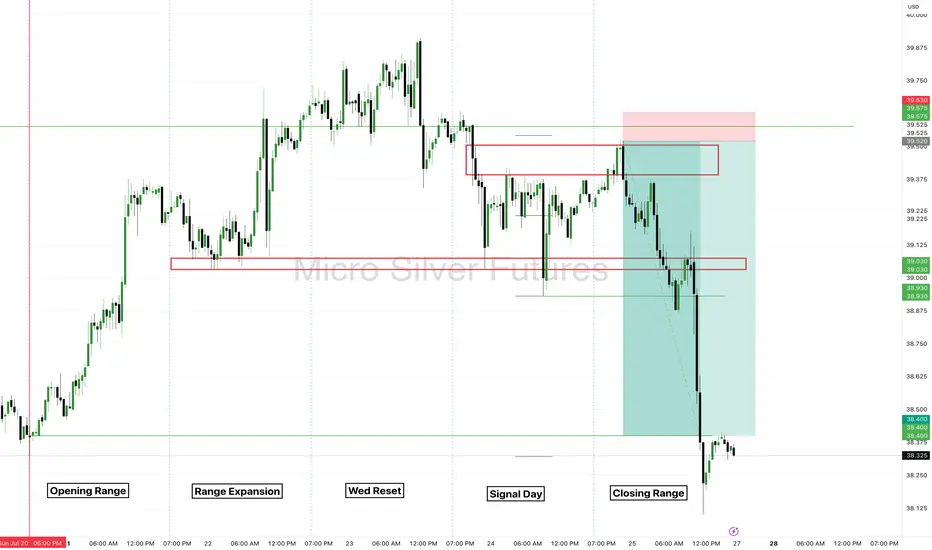
Silver Futures - Closing Range of the Week.Real trading comes down to the patience combined with emotional control to have the highest possible edge.
COMEX_MINI:SIL1!
There is no reason for your chart to filled be filled with ineffective distraction. Instead focus on simplicity to know exactly what to take a trade on. Be a hunter looking for the easy prey!
XAUUSD about to trade downwardsToo many tries on the higher high created by Gold that have failed , now the price has broken a treblndline from months back signalling a bearish move down to 3000 with few breaks to lead it there if the dollar doent slip, which the decline might take up to November according to how I see the pattern formations

double long ON BITCOIN hey .
as you saw in the previous trade and forcast we are long on the bitcoin
we got another beautiful confirmation
so i m puting a second long and already put the first on the break even :)
TOP DOWN ANALYSIS-DOW JONES-YM-LONGS-WEEKLY OVERVIEWPrice is at a key level of resistance, expecting a reaction off the 45,084 level to the downside, or a breakout to the upside, creating a new high.

BTC mid term uptdateI will be carefull at 122.000 secure positions and taking profits as one more fall is very possiblo to 113.500 before new all time highs
Levels Highlighted
GG


BNBUSDT - New ATH!"The strongest resistance level on the chart has just been broken — which was represented by the previous ATH — after nearly four attempts.
This exact pattern occurred before in 2021, and what followed was a parabolic rally.
The same scenario is unfolding now!
You’ll soon see BNB trading in four digit
When the crowd doubts — the smart money loads up.
Expect a parabolic rally once sentiment flips.
Best Regards:
Ceciliones🎯
