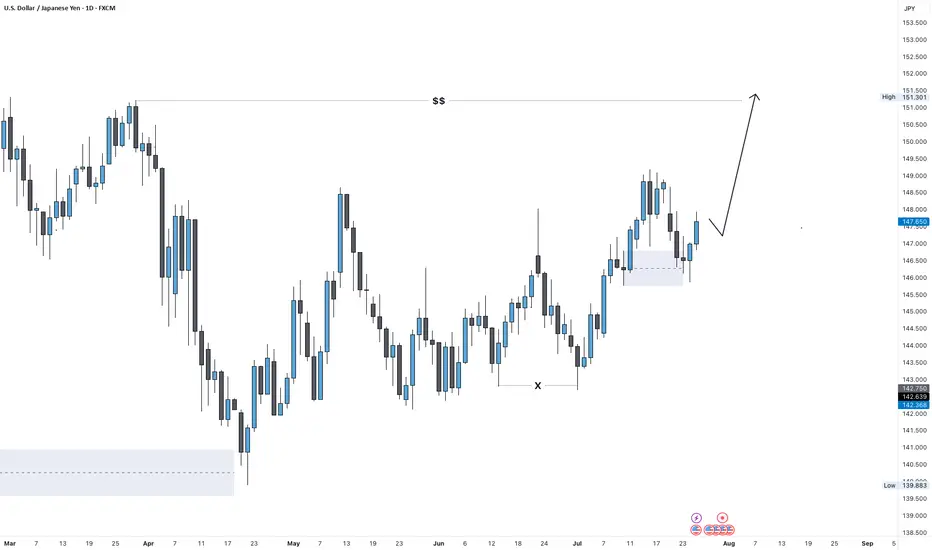
USD/JPY Outlook: Bullish Target Set at 151.0 USD/JPY Weekly Forecast – July Week 4
Last week, USD/JPY retested a weekly Fair Value Gap and closed with strong bullish pressure, confirming demand. Now, the next key liquidity level sits around 151.00 — just above the previous major highs.
On the daily timeframe, we may see a bearish retest toward 147.00 early in the week. From there, supported by both Federal Reserve sentiment and a bullish dollar, price could launch a strong bullish move to sweep the 151.00 highs.
Bias: Bullish
Key Zones:
• Support / Retest: 147.00
• Target: 151.00
• FVG Reaction: Confirmed on weekly close
The setup aligns with dollar strength and clean bullish structure.
—
Weekly forecast by Sphinx Trading
Drop your view in the comments.
#USDJPY #ForexForecast #SmartMoney #LiquidityTargets #SphinxWeekly #DollarStrength #PriceAction #FVG
Beyond Technical Analysis

Gold Outlook: Bearish Continuation in Play Toward 3,250Gold Weekly Forecast – July Week 4
Gold closed last week with a strong bearish weekly candle, rejecting from the 3,440 supply zone and closing below the key Fair Value Gap at 3,360. This confirms downside pressure, especially in the context of a strengthening dollar.
For this week, we may see a bullish opening early in the week toward 3,370, followed by a deeper bearish move targeting the major low and liquidity pool at 3,250.
Bias: Bearish
Key Zones:
• Resistance / Retest: 3,370
• Target: 3,250
• Supply Rejection: 3,440
Momentum favors further downside unless bulls reclaim key levels.
—
Weekly forecast by Sphinx Trading
What’s your bias on Gold this week?
#Gold #XAUUSD #SmartMoney #FairValueGap #BearishBias #SphinxWeekly #LiquiditySweep #GoldForecast

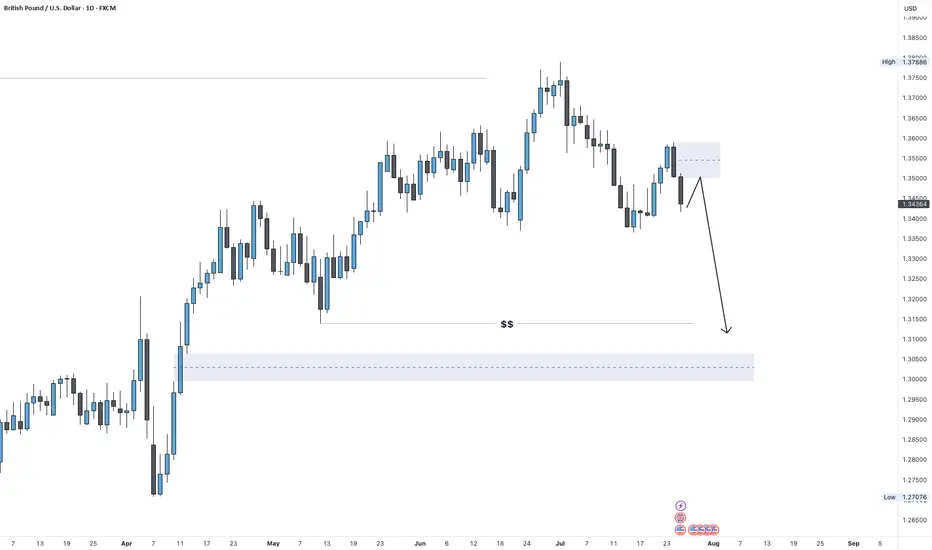
GBP/USD Outlook: Bearish Swing in Play After Weekly FVG RetestGBP/USD Weekly Forecast – July Week 4
Last week, GBP/USD retested a weekly Fair Value Gap near 1.35900 and responded with a strong bearish engulfing candle — showing clear rejection from the imbalance zone.
With the dollar expected to strengthen this week, we could see a small bullish retracement early in the week toward 1.35000, followed by a bearish swing move targeting at least the 1.31000 support zone.
Bias: Bearish
Key Zones:
• Resistance / Retest: 1.35000
• Target: 1.31000
• FVG Supply: 1.35900
Structure and macro direction both point to GBP weakness continuing.
—
Weekly forecast by Sphinx Trading
Share your bias in the comments.
#GBPUSD #Cable #ForexForecast #SmartMoney #SphinxWeekly #FairValueGap #DollarStrength #PriceAction
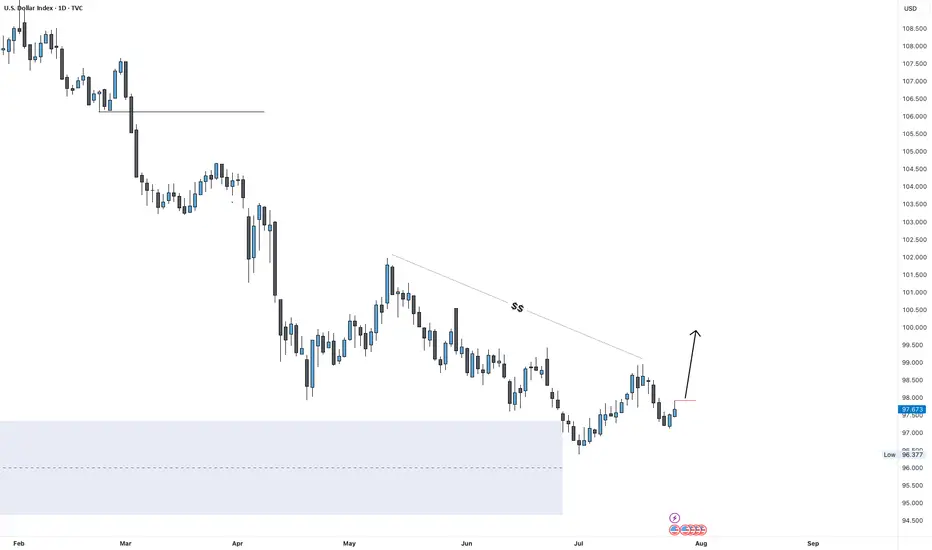
DXY Outlook: Can Fed Hold Spark a Move Toward 100?DXY Weekly Forecast – July Week 4
After reaching 96.50 early this month, DXY began showing bullish signs. Last week, price retested the extreme demand zone at 97.00 and closed with a bearish weekly candle that held some bullish pressure at the base.
This week, all eyes are on the Federal Reserve meeting. If the Fed holds rates steady, the dollar could strengthen further. A weekly close above 97.90 would confirm the breakout and open the door to a run toward 100.00 — a key psychological and technical level.
Bias: Bullish (if 97.90 breaks)
Key Zones:
• Demand: 97.00
• Breakout Level: 97.90
• Target: 100.00
This could be the beginning of a fresh bullish leg — especially if macro conditions align with technical structure.
—
Weekly forecast by Sphinx Trading
Let me know your bias in the comments.
#DXY #DollarIndex #ForexForecast #SphinxWeekly #SmartMoney #FOMC #USD #InterestRates
DXY forecast From weekly view the DXY is looking bearish at least till 95.123 key level the will see if we get a bullish power as the DXY is forming a reversal pattern. But of course many factors plays part in this economy, for example, global news like Tariffs and other factors.
So when DXY is trading on the 95.123 key level additional confluence will give us the right to put on trades, as the 95.123 key level is significant for what will take place next.
Take you all.......

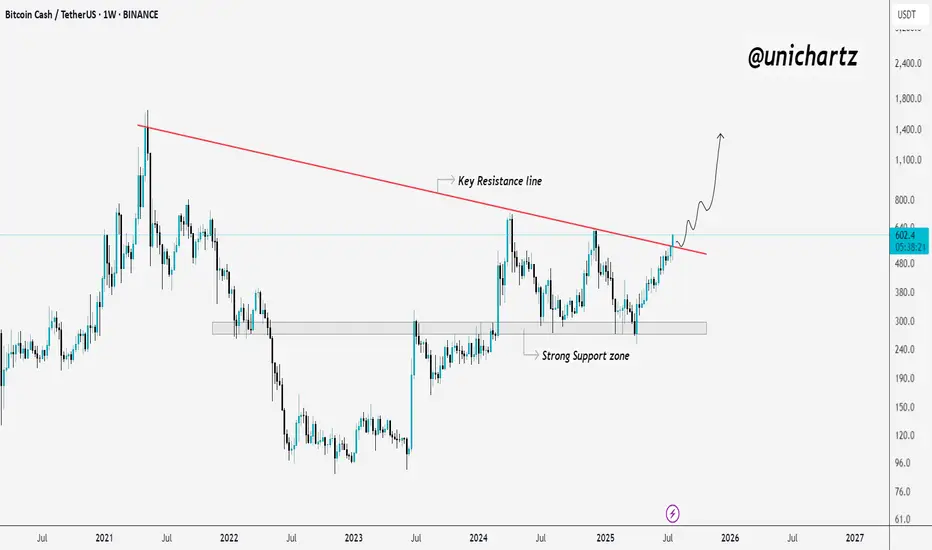
Bitcoin Cash Reclaims Momentum – Explosive Move Ahead?CRYPTOCAP:BCH Weekly Breakout 🚨
Bitcoin Cash just broke above a key multi-year resistance line, and that’s a big deal.
After months of consolidation above strong support, this breakout could trigger a powerful upside move.
If momentum holds, BCH might be gearing up for a run toward $800 and beyond.
Looks like the real move is just getting started.
Gold. GC1! Weekly Outlook. 27.07.2025, SundayCOMEX:GC1!
Outlining gold on HTF. Waiting for FOMC and NFP

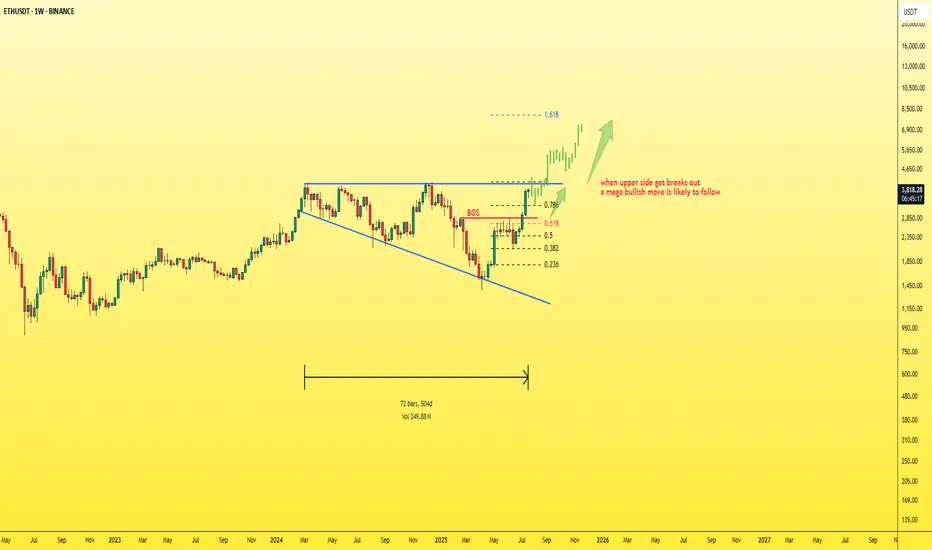
ETH - simple chart and mega moveEthereum is currently the strongest and most stable asset in the market, especially after many had lost hope in it.
Now, Ethereum is back with strength, and it’s just a few steps away from breaking out of the current pattern.
📈A breakout above the upper boundary will likely lead to a new all-time high (ATH) for ETH.
My projection: Ethereum could surpass $7,000 before the end of 2025.
Best regards:
Ceciliones🎯
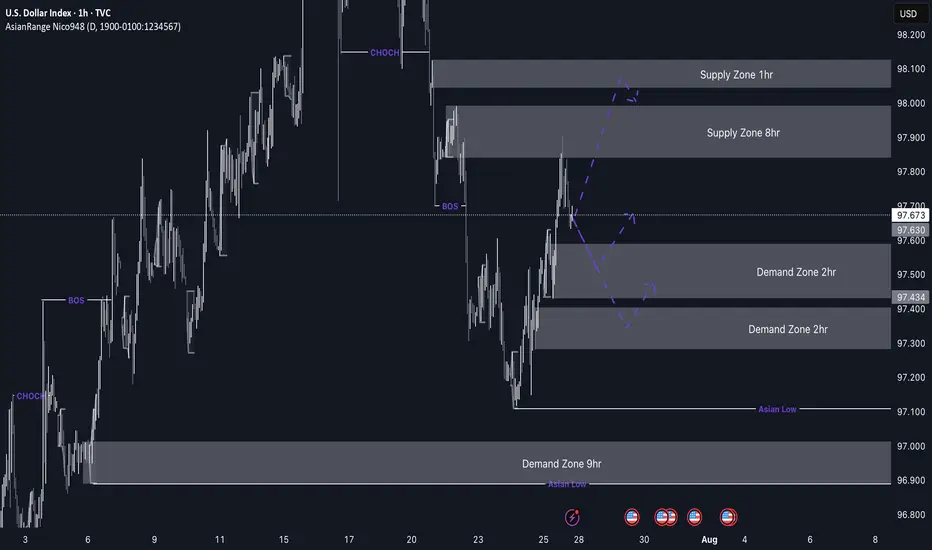
DXY weekly outlookDXY Weekly Outlook
This week, I’m watching to see if the dollar continues its bearish trend or breaks above the current supply zone. We've already seen a strong reaction from the 8hr supply, but price could still tap into the 1hr supply before making its next move.
If price drops from here, I’ll be looking at the 2hr demand zone below for a possible bullish reaction. If DXY pushes up from that zone, pairs like EU and GU could drop — which lines up with my overall short bias on those.
Gold may not always move in sync with the dollar, but DXY still gives a good idea of market sentiment.
Let’s see how it plays out and stay reactive.
TradingView Post – ETH/USD: Ethereum Pushing Toward $4,000 TradingView Post – ETH/USD: Ethereum Pushing Toward $4,000 🚀
Market Snapshot
Ethereum (ETH/USD) is currently trading near $3,821, after a slight pullback of 2.09% from its recent highs, consolidating just below the $4,000 psychological barrier. Institutional demand and network upgrades are pushing Ethereum into a strong bullish structure, with multiple indicators aligning for an upside breakout (Crowdfund Insider, 2025).
Technical Overview
Structure: ETH has broken above the $3,700–$3,800 resistance range, entering a premium supply zone (Cryptopotato, 2025).
Ichimoku Cloud: Price action remains above the Kumo with bullish Tenkan and Kijun lines, indicating strong medium-term momentum.
Volume Dynamics: Institutional flows have absorbed previous resistance, with nearly 2.8M ETH (~$10B) bought by ETFs and large holders since May (Crowdfund Insider, 2025).
Momentum: RSI hovers around 76–78, suggesting short-term overbought conditions, but MACD remains bullish (TipRanks, 2025).
Key Levels
Resistance: $3,820–$3,830 (breakout zone), followed by $4,000 and $4,100–$4,200 (extension zone).
Support: $3,650–$3,700 (former resistance flipped support), with invalidation below $3,550.
Targets: Short-term: $4,000–$4,200. Medium-term: $4,500–$5,000 if momentum sustains (Coinpedia, 2025).
Catalysts Driving ETH
Network Upgrade: Ethereum's Pectra upgrade improved scalability and reduced fees, increasing staking yields and network efficiency (Wikipedia, 2025).
Institutional Demand: ETFs and funds continue accumulating ETH, creating a potential supply squeeze (Crowdfund Insider, 2025).
Macro Trend: July saw ETH gain over 48%, echoing BTC’s 2020 consolidation-to-breakout pattern (Tickeron, 2025).
Strategy & Risk Management
Entry Zones: Add on dips near $3,650–$3,700 or on breakout confirmation above $3,830.
Stops: Tight stops below $3,550 to protect against sudden corrections.
Profit Zones: Take partial profits at $4,000 and $4,200, trailing the remainder toward $4,500+.
Outlook
Ethereum’s path to $4,000 is supported by both on-chain metrics and institutional activity, aligning with long-term forecasts projecting ETH between $5,000 and $10,000 by 2026 (TokenMetrics, 2025).
Disclaimer: For informational and educational purposes only. Not financial advice.

EUR/USD Short from the nearby 1hrI’m currently more confident in EU’s bearish setup compared to GU, as price is nearing a clear point of interest (POI) that aligns well with the developing downtrend. The 2hr supply zone has already caused a CHoCH (Change of Character), and price has been approaching it slowly and with reduced momentum — often a strong indication of an upcoming reaction.
While price isn’t near a demand zone yet, I’ll be keeping an eye on the 7hr demand zone below. If price reaches that area, I’ll be looking for a high-probability buy setup in line with the broader market context.
Confluences for EU Sells:
Price has tapped into a 2hr supply zone that caused a CHoCH to the downside
Bearish pressure remains strong, supported by DXY strength
Clean liquidity to the downside that needs to be swept
Slowing momentum and signs of distribution as price approaches supply
P.S. If price continues lower from this point, I anticipate another break of structure, which could form a new supply zone to work with later this week.
Let’s stay patient, follow the flow, and execute smart. 🔥📉💼

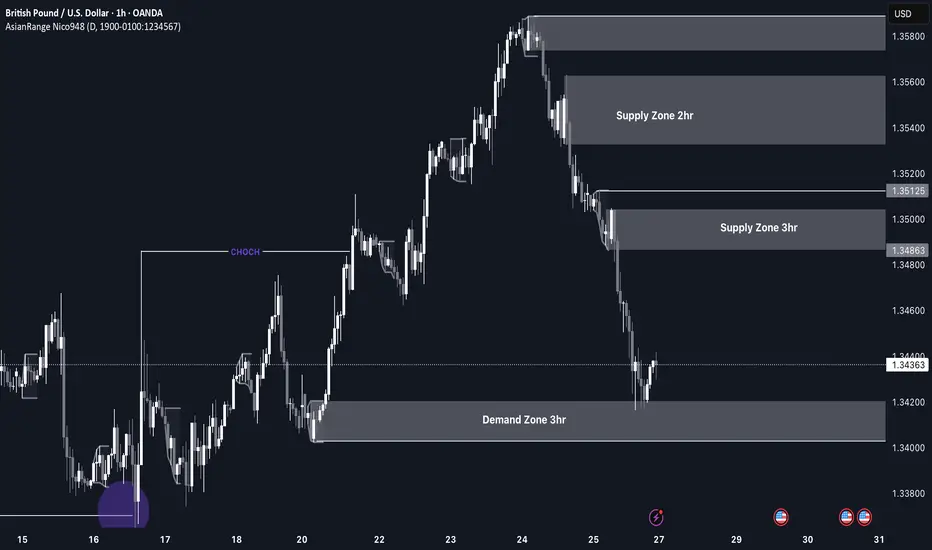
GBP/USD Longs to Shorts GU has been very bearish recently and is currently reacting from a clean demand zone with multiple confluences. While we may see a short-term push to the upside, I’ll be watching to see if price reaches the 3hr supply zone sitting at a premium level.
If price does reach that zone, I’ll be on the lookout for signs of Wyckoff distribution and a slowdown in momentum, which could signal the start of another bearish leg.
Confluences for GU Shorts:
Overall bearish trend remains intact — this is a pro-trend setup
Price may retrace to mitigate a 3hr supply zone
Liquidity to the downside still needs to be taken
Current demand zone may simply serve as a trigger for a retracement up to supply
P.S. If price fails to reach the supply zone and continues dropping, we’ll likely see a new break of structure and the formation of a fresh nearby supply zone, which we can then trade from.
Let’s stay sharp and have a profitable trading week ahead! 🔥📊💰
GOLD imminent possible buys up to 3,370 This week’s price action on GOLD is shaping up to be very interesting. After weeks of sustained bearish pressure, price has now entered a discounted 2hr demand zone sitting at a swing low, which makes it a high-probability area for a bullish reaction, especially as markets open.
If we do get the expected bullish reaction from this level, I’ll be watching the 3,370 region, where there’s a clean 5hr supply zone. If price reaches that level, I’ll be looking out for distribution and a potential short setup from there.
Confluences for GOLD Longs:
Price has been very bearish recently, so a retracement is expected
Currently sitting in a discounted 2hr demand zone
The overall long-term trend is still bullish
Early signs of accumulation and bullish reaction from this zone
P.S. If price fails to hold this current demand zone and breaks lower, then bearish momentum may continue. In that case, I’ll look for new long opportunities around 3,290 where a deeper demand zone exists.

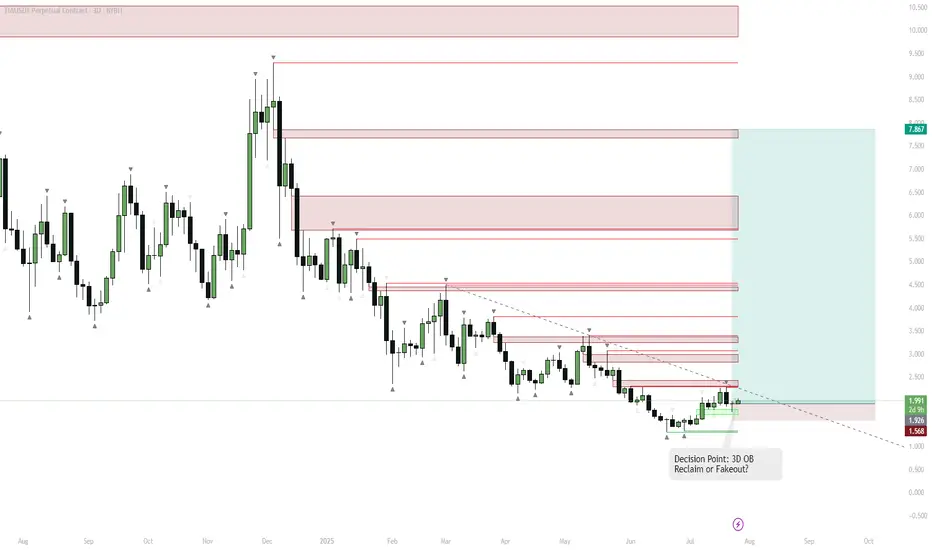
TIA — Pivot Point: 3D Order Block Reclaim or One More Breakdown?Key Observation
LSE:TIA has been in a prolonged downtrend, with a recent strong bounce from multi-month support (highlighted green).
Multiple supply zones (red) are stacked above, representing resistance.
Swing Short Context
Despite the bounce, the asset has a history of fakeouts and failed breakouts ("cursed asset").
A classic "10/10 top/bottom" pattern appears, suggesting a possible short-term top is forming.
However, a 3D bullish order block (OB) has been reclaimed on this candle.
Trigger Confirmation
If this 3D candle closes green and holds above the OB, momentum may flip bullish rapidly.
This reclaim would invalidate the bearish thesis and open up quick moves toward the next supply zones ($2.5–$3.5).
Bearish Alternative
If price fails to hold above the OB, or closes the candle red, the risk of a fakeout and move back to the lower support remains.
The downtrend line is a key resistance; rejection here can trigger another sweep of the lows ($1.56).
Swing Strategy
Short bias as long as price is below the OB and trendline, targeting a move back to $1.56–$1.92.
Flip to long/bullish bias only on a 3D close above the OB zone and trendline — this could trigger a rapid run to $2.5, $3.2, and higher.
Reasoning
The setup is a classic "pivot point" — either a breakdown from resistance for another leg down, or a confirmed breakout above the OB for a strong bullish reversal.
With stacked supply zones overhead, any breakout will likely see aggressive moves as shorts cover and new buyers chase.
Momentum traders should wait for the 3D close for confirmation.
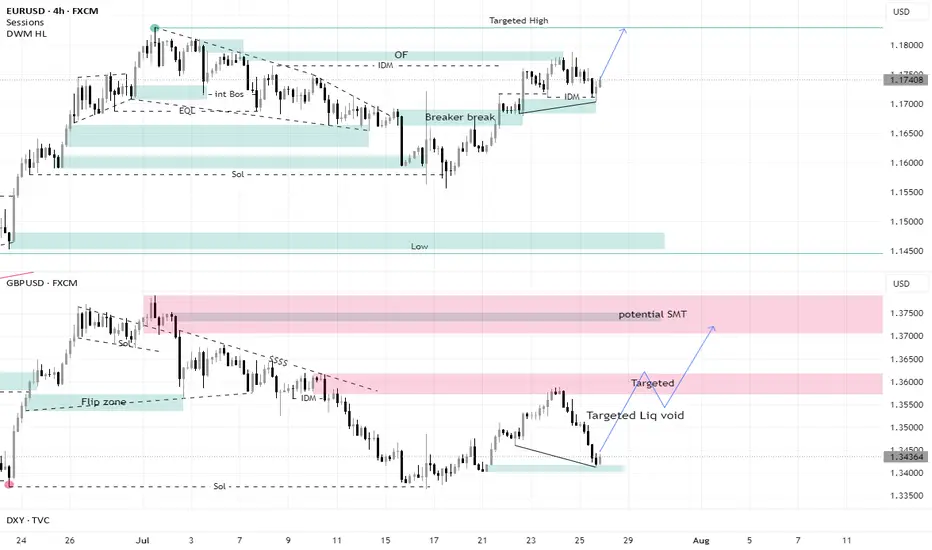
SMT in EU and GU + Targeting Liquidity voidI did not expect the GBPUSD to fall with all this force, but the EURUSD’s refusal to fall with it all these points indicates the strength of the current Low from which it rebounded, and it is expected that this bottom will hold
It is clear that GBPUSD was looking for more liquidity and that is why it dropped all these points. With this drop, it created a liquidity void that allowed it to rise and take all these pips back.
Bitcoin - Strategic Coil Within the Arcane Band.⊢
⟁ BTC/USD - BINANCE - (CHART: 4H) - (July 27, 2025).
◇ Analysis Price: $118.309,59.
⊣
⨀ I. Temporal Axis - Strategic Interval - (4H):
▦ TEMA9 - ($118.338,48):
∴ Price is currently below TEMA9, indicating near-term resistance;
∴ Curve is upward-sloping but flattening, suggesting fading acceleration;
∴ Acts as reactive signal line; minor rejection occurred on contact.
✴️ Conclusion: Momentum fading as price struggles to hold above dynamic resistance.
⊢
▦ HMA21 - ($118.324,83):
∴ Smooth curvature maintaining upward bias;
∴ Close proximity to TEMA9 shows compressed volatility regime;
∴ Price interacting with HMA without definitive breakout.
✴️ Conclusion: Tactical direction remains constructive, but confirmation is lacking.
⊢
▦ EMA50 - ($117.794,89):
∴ Strong medium-term support; price remains above it with clear respect;
∴ Acts as lower bound of the current compression channel;
∴ No bearish cross detected with TEMA or HMA.
✴️ Conclusion: Mid-term bullish support structure intact.
⊢
▦ EMA200 - ($113.979,81):
∴ Structure well below active price; rising and stable;
∴ Indicates long-term bullish posture is unbroken;
∴ No signs of major breakdown or transition to bear structure.
✴️ Conclusion: Structural uptrend remains unthreatened.
⊢
▦ SuperTrend Arcanvm - (ATR 10, 1.5 - $117.640,25):
∴ Price trades above the SuperTrend line, indicating continuation zone;
∴ Support zone lifted slightly, confirming minor trend maintenance;
∴ No signal reversal or close below since last shift.
✴️ Conclusion: Tactical upward bias protected by volatility-based support.
⊢
⨀ II. Momentum & Pressure Indicators:
▦ Stochastic RSI (3,3,21,9) - (%K: 88.23 / %D: 88.27):
∴ Deep into overbought zone; potential reversal region;
∴ Minor negative crossover forming (%K < %D);
∴ Pattern shows repeated false breaks from high zone.
✴️ Conclusion: Overextended with local fatigue building.
⊢
▦ MACD (9,21,9)- (Line: 164.40 / Signal: 106.94 / Histogram: +57.47):
∴ Bullish crossover confirmed and holding; histogram positive;
∴ Increasing MACD separation suggests underlying momentum;
∴ No divergence yet; consistent short-term upside energy.
✴️ Conclusion: Momentum favors bulls but remains immature.
⊢
▦ MFI (14) - (68.20):
∴ Trending toward overbought zone without breach;
∴ Steady increase reflects sustained volume-backed inflows;
∴ Not yet extreme; still has energy potential to fuel move.
✴️ Conclusion: Volume pressure supports bullish case with room left.
⊢
▦ Accumulation/Distribution + HMA21 - (74.89M):
∴ Line remains stable above short-term base; no outflow signals;
∴ Slight incline observed, confirming ongoing accumulation;
∴ No divergence with price; consistent flow.
✴️ Conclusion: Capital positioning remains supportive of continuation.
⊢
🜎 Strategic Insight - Technical Oracle:
∴ The current 4H structure on BTC/USD exhibits a compressed upward bias where dynamic resistance (TEMA + HMA) is being tested persistently but without explosive breakout;
∴ Momentum indicators (MACD, MFI) confirm early-stage bullish pressure, while structural supports (EMA50, SuperTrend) remain intact and responsive;
∴ However, Stoch RSI is saturated, suggesting that any continuation would likely require a cooling cycle or shallow retracement before sustainable thrust;
∴ This configuration aligns with a “Pre-Break Range Staging” - a technical limbo where buyers are present but cautious, and sellers are absorbed without significant follow-through.
✴️ Strategic Focus: Watch for confirmation above ($118.600) with volume expansion and MACD histogram follow-through, or a soft retest toward ($117.640/117.800) as reloading zone.
∴ Logic sealed. Tactical silence until resolution.
⊢
𓂀 Stoic-Structural Interpretation:
▦ Structurally Bullish - (Tactically Fragile Continuation):
∴ The long-term structure (EMA 200 rising, unbroken) confirms a preserved bullish frame;
∴ Mid-term support (EMA 50 + SuperTrend) is active and functioning as a technical base;
∴ However, price struggles to sustain above dynamic resistance (TEMA/HMA), and Stoch RSI signals short-term exhaustion.
✴️ Conclusion: The structure is upward, but the current tactical zone is sensitive. Any bullish continuation demands confirmation and discipline - no chasing.
⊢
▦ Tactical Range Caution:
∴ Support Zone - (Defensive): $117,640 / $117,800;
∴ Resistance Ceiling - (Breakout Trigger): $118,600;
∴ Tactical Neutral Band: $118,000 / $118,300.
✴️ Conclusion: No trade zone expands if compression persists. Breakout or breakdown must be decisive and accompanied by volume/momentum synchrony.
⊢
◩ Codicillus Silentii - Strategic Note:
∴ In moments of compressed structure near resistance, the market does not reveal itself through price - but through how it refuses to move. Silence becomes signal;
∴ What is observed here is not a lack of momentum - but deliberate withholding of directional intent;
∴ The system is balanced between emergent buy pressure (MACD, MFI, Accum/Dist) and short-term saturation (Stoch RSI), forming a strategic standoff:
No major actors are retreating, but none are charging forward either.
The candle bodies shrink while oscillators extend - a classic sign of non-confirmed bullish bias.
Emotional traders will chase; initiated ones will wait for the candle that breaks the silence, not the one that whispers hope.
✴️ Final Seal: The stoic operator does not react to pressure - he reacts to structure.
Tactical inaction is a move; Watching is positioning; Discipline is participation.
⊢
⧉
· Cryptorvm Dominvs · MAGISTER ARCANVM · Vox Primordialis ·
⚜️ ⌬ - Silence precedes the next force. Structure is sacred - ⌬ ⚜️
⧉
⊢

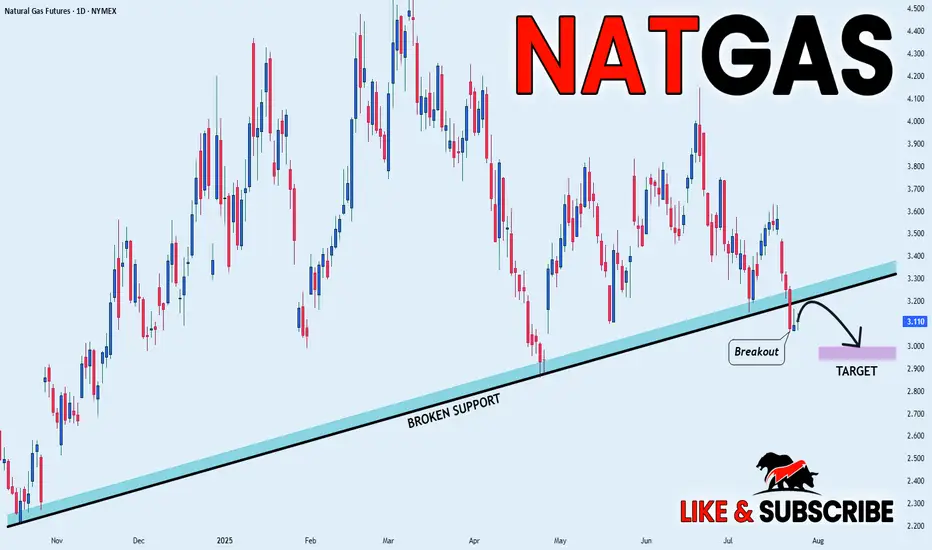
NATGAS BEARISH BREAKOUT|SHORT|
✅NATGAS broke the rising support
While trading in an local downtrend
Which makes me bearish
And I think that after the retest of the broken line is complete
A rebound and bearish continuation will follow
SHORT🔥
✅Like and subscribe to never miss a new idea!✅
Disclosure: I am part of Trade Nation's Influencer program and receive a monthly fee for using their TradingView charts in my analysis.
Why Everyone’s Stop Loss Gets Liquidated?!!...Why does your stop loss always get hit first?
Is it possible that everyone else placed theirs exactly where you did?
Maybe it's time to face an uncomfortable truth about the market and crowd psychology.
Hello✌️
Spend 3 minutes ⏰ reading this educational material.
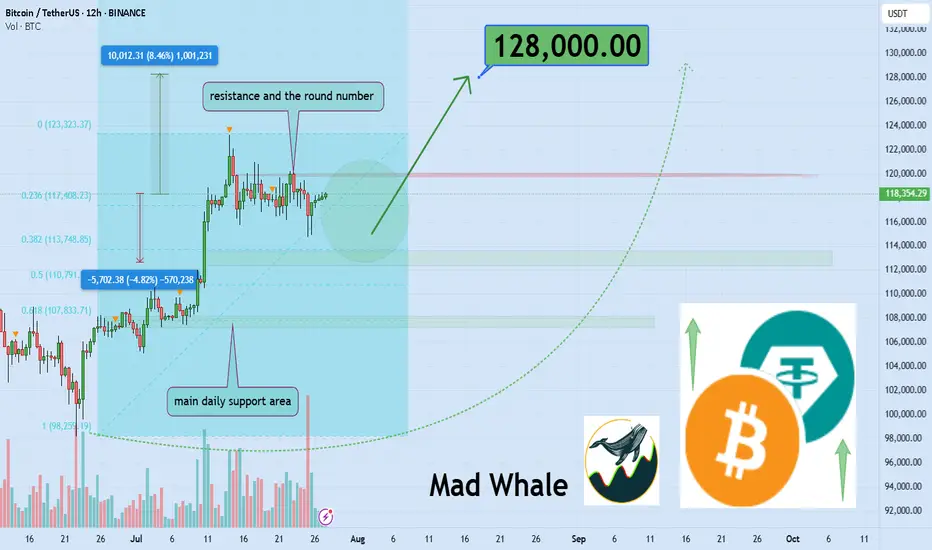
🎯 Analytical Insight on Bitcoin:
BINANCE:BTCUSDT has established a well-defined range in this zone, triggering multiple stop hunts and now approaching a fresh daily resistance. A confirmed breakout above this level could open the door for an 8% upside move toward the 128,000 area. 📈🧠
Now , let's dive into the educational section,
🎯 Crowd Psychology: The Fixed Target of the Market
In crypto markets, when everyone thinks the same, they tend to lose the same way. One of the clearest signs of this is where stop losses are placed. When a level becomes too obvious to too many traders, it becomes a magnet for liquidity hunters.
Public stop losses are usually placed right below obvious lows or above clear highs. These are areas that everyone has mentally marked as strong support or resistance. Ironically, that’s exactly where a sudden wick appears, takes out stops, and then the market goes right back in the original direction.
🧠 Your Brain Wants Safety, The Market Wants Liquidity
New traders search for “safe” places to hide their stops. That very logic makes those places unsafe. The market needs liquidity to move, and the most liquidity sits right where people feel safe placing their stops.
Remember: stop losses are actual market orders, buy or sell triggers. When yours gets hit, someone else enters a position. Your loss is their entry. This is a zero-sum game.
🐋 Whale Activity Before the Trap
Ever noticed how, just before your stop gets hit, there’s a small move in the opposite direction? That’s bait. Right after, a strong wick sweeps through, takes out public stops, then reverses. It’s not an accident. It’s planned.
If you observe these small shifts with suspicion rather than trust, you’ll often catch the trap before it happens.
💡 Your Trigger Shouldn't Be Where Everyone Else Sets It
There’s a smarter way to manage your stops, ways that avoid the obvious traps:
Use ATR to dynamically calculate distance
Place stops based on candle structure, not just price levels
Wait for confirmed reversal patterns before setting stops
Consider mental stops based on invalidation logic, not fixed price points
⛔️ Blind Trust in Repeated Zones
When a support or resistance level holds multiple times, people begin to trust it blindly. That collective trust becomes a weakness. The market doesn’t respect obvious levels, it exploits them.
If you see it, everyone else sees it. And so does the market. But the market plays a different game. You seek safety, it seeks liquidity.
🎲 Is It Really Your Fault?
Many traders blame themselves when their stop gets hit. The truth? You’re not the problem, your thinking pattern is. Most traders make the same decisions because they learned the same textbook strategies. That’s what makes their stops predictable.
It’s not always about poor analysis. Sometimes, it’s just about being part of the herd.
📉 Practical TradingView Tools to Track Public Stop Zones
Here are a few powerful TradingView tools and indicators you can use to figure out where stop loss clusters are likely hiding. Use them together for better accuracy:
Session Volume (Fixed Range)
Apply this tool to recent ranges or high-volatility zones. Peaks in volume often reveal where most traders are entering or exiting, which means stops are likely nearby.
Liquidity Pools Finder
This indicator estimates areas with potential liquidity pools. These are often the next targets for large moves.
Horizontal Ray or Box Tool
Use these to mark the areas just above highs and below lows. These zones are where most public stops typically sit.
Fair Value Gap (FVG)
Gaps in price action can act as magnets. It's no coincidence that public stops often get hit in these areas during fakeouts or trap moves.
📌 Final Thoughts
When everyone looks at the same level, the market attacks it. Public stop losses are a primary fuel source for liquidity-based moves. Use TradingView tools, train your eye, and place your stops where no one else dares. That’s how you stay out of the trap.
✅ Wrap-Up
If your stop always gets hit right before the big move, it’s not a coincidence, it’s a mindset issue. Stop thinking like the crowd, and the market will stop treating you like one.
✨ Need a little love!
We pour love into every post your support keeps us inspired! 💛 Don’t be shy, we’d love to hear from you on comments. Big thanks , Mad Whale 🐋
📜Please make sure to do your own research before investing, and review the disclaimer provided at the end of each post.
Watch Uniswap’s $10 Defense For 16% Breakout Toward $12.5Hello✌
Let’s analyze Uniswap ’s upcoming price potential 📈.
BINANCE:UNIUSDT is currently trading near a key confluence zone that includes the psychological round number of 10, a daily timeframe support level, and a Fibonacci retracement area. If this zone holds, there is potential for a 16% upside move toward the 12.5 level , making it a setup worth monitoring in the coming sessions. 📊🔍
✨We put love into every post!
Your support inspires us 💛 Drop a comment we’d love to hear from you! Thanks , Mad Whale

Short Probably!Hello all. before all I wanna tell you that I am not a crypto trader and it is unknown market to me but if it works as Forex market, market will go down from here. be happy(wink)
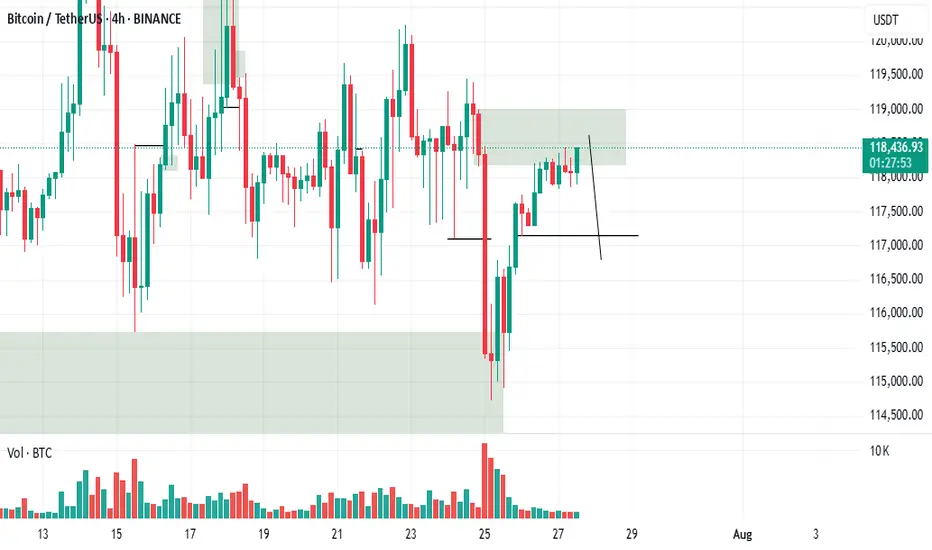
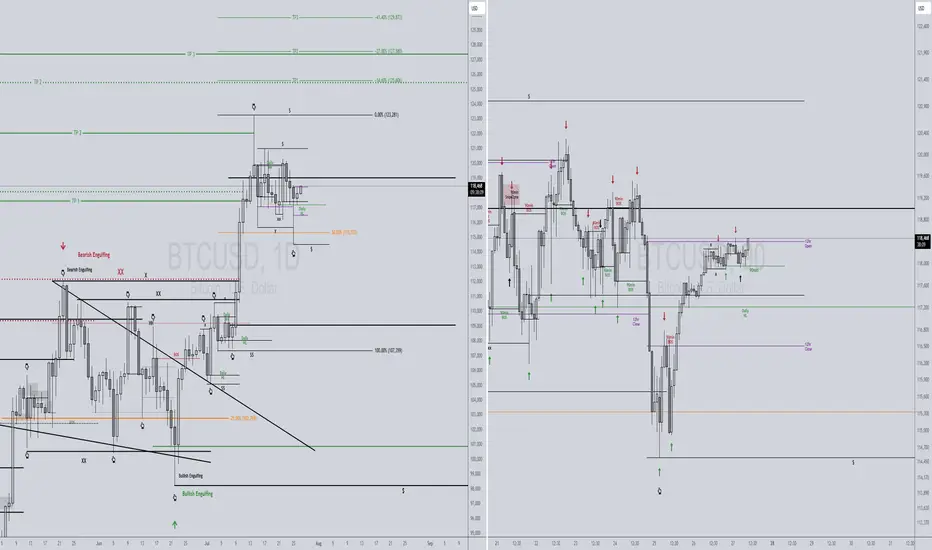
BTCUSD 7/27/2025Just a nice pic update aligning to my last callout in my previous video.
New Video dropping later today...
_SnipeGoat_
_TheeCandleReadingGURU_
#PriceAction #MarketStructure #TechnicalAnalysis #Bearish #Bullish #Bitcoin #Crypto #BTCUSD #Forex #NakedChartReader #ZEROindicators #PreciseLevels #ProperTiming #PerfectDirection #ScalpingTrader #IntradayTrader #DayTrader #SwingTrader #PositionalTrader #HighLevelTrader #MambaMentality #GodMode #UltraInstinct #TheeBibleStrategy
DXYJULY 21-25 recap
Net was -296 last week
Price dropped until Wednesday
Hit the weekly demand zone (strong support)
Sellers paused or covered shorts there
Buyers stepped in → possible bounce or reversal
