Smart Robbery Plan: LINK/USDT Long Setup | Swing/Day Trade Idea🚨CHAINLINK HEIST PLAN 🚨 | LINK/USDT Market Robbery (Thief Trader Style) 💰🔐
🌍 Hola! Bonjour! Hallo! Marhaba! What’s up, Money Makers & Market Robbers?! 🕶️💵
Get ready to raid the LINK/USDT vault with Thief Trader’s high-precision strategy based on 🔥 Technical & Fundamental fusion 🔥.
This is not your regular setup. This is a robbery roadmap. Designed for swing & day traders, and spiced with smart DCA entries, risk control, and a bold vision. Let's get into the game plan before the market alarms go off! 🚓📉📈
🎯 Master Plan – LINK/USDT | Bullish Setup
Entry:
📌 “The vault is open – grab the loot!”
Start entering long anywhere within the nearest price pullback zone. Use 15m to 30m TFs for sniper-style limit entries.
🛠️ Deploy DCA-style multiple limit orders (layered strategy), preferably around recent swing lows or major liquidity zones.
Stop Loss:
🔐 Place SL just below the 4H swing low wick (Currently at $16.50), adjusting for your risk, lot size, and how many limit orders you're stacking.
Take Profit:
🎯 Main TP target: $21.50
⛔ Or bail early if momentum weakens. Your profit, your decision.
⚡️Scalper’s Memo:
Only scalp on the bullish side – stay with the smart money.
Have deep pockets? Jump in now.
On a budget? Join swing traders and follow the full heist plan.
📉 Use trailing SL to secure profits during volatile rallies.
🔍 Fundamental & Sentiment Snapshot:
LINK is gaining bullish traction due to a combo of strong sentiment, favorable macro outlook, and on-chain flows aligning.
📊 Keep eyes on COT reports, intermarket data, and liquidity metrics.
🧠 Sentiment leans bullish while late bears are trapped in the supply zones above.
🛑 Risk & News Management Alert:
🚨 News releases can spike volatility and mess with clean entries.
📵 Avoid placing trades during high-impact events.
📍 Use trailing stop-loss to protect your running profits and preserve capital.
💖Support the Plan, Join the Heist:
Love the trade idea? 💥Hit the BOOST💥 button and show some love to the strategy that lets traders "rob the market" with confidence.
Every like helps build the strongest heist crew on TradingView.
✅ Stay sharp. Stay patient. Stay profitable.
👤 Thief Trader signing out… until the next raid. 🐱👤💰🚀
#LINK #LINKUSDT #CryptoTrading #ThiefTrader #SwingTrade #DayTrade #DCA #BullishSetup #TradingPlan #TA #RobTheMarket #ChainlinkHeist #SmartMoneyMoves
Beyond Technical Analysis

MKR ANALYSIS🔮 #MKR Analysis
🌟🚀 As we said earlier #MKR moved around 48%. Right now #MKR is trading in an Ascending Triangle Pattern and here we can see that #MKR moving again towards its neckline. We see see more bullish move in upcoming days
🔖 Current Price: $2260
⏳ Target Price: $2664
⁉️ What to do?
- We have marked crucial levels in the chart . We can trade according to the chart and make some profits. 🚀
#MKR #Cryptocurrency #Breakout #DYOR


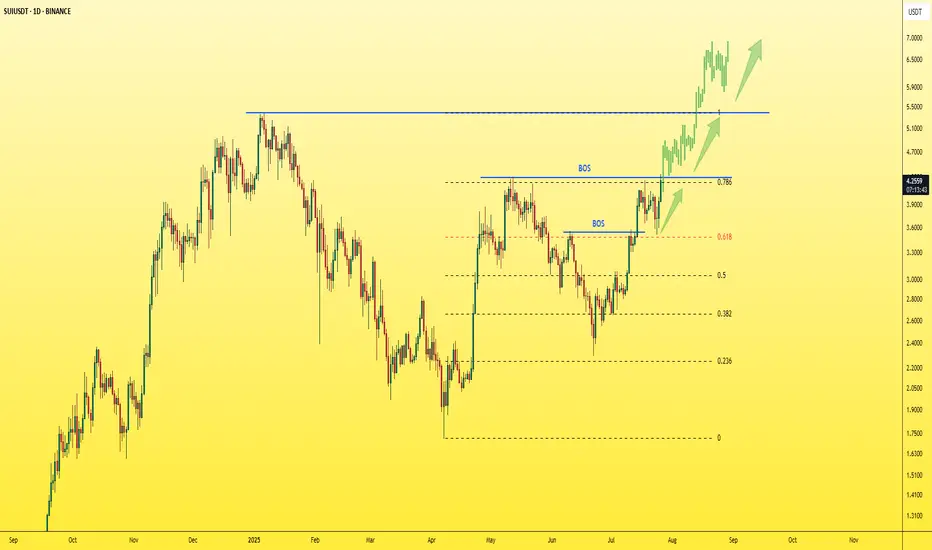
SUI - Just one step away from the explosion!The last candle on the daily chart just confirmed a BOS (Break of Structure) — a clear and strong sign of bullish continuation for the asset.
✅ This is a textbook entry for a long position.
🎯 Next target: $5 — and so far, no bearish signs in sight.
Best regards,
Ceciliones 🎯
TEM – Bullish Continuation to $74+ | Institutional Catalyst fromTEM – Bullish Setup Targeting $74+ | Strong Institutional Backing
VolanX DSS, WaverVanir AI, and SMC confluence confirm a STRONG BUY signal for TEM, with a 15–20% upside potential over the next 30 days.
Key Highlights
AI Forecast:
Current Price: $64.49
30-Day Target: $74.56 (+15.6%)
Model Confidence: Strong Buy
Technical Confluence:
Price has reclaimed equilibrium and is holding above EMA 20/50/100.
Fib levels and channel support point to an upside breakout towards $74–75.
Breakout of $66.3 (0.618 fib) would confirm bullish continuation.
Institutional Catalysts:
Recent Russell 3000E inclusion and increased institutional ownership.
Strong partnerships (AstraZeneca, Pathos AI) and expanding AI-driven healthcare initiatives.
Upgraded 2025 financial outlook.
Trade Plan
Entry: $64.50 (current levels)
Stop Loss: $56.96 (below EMA 100)
Target 1: $65.78 (partial)
Target 2: $74.56 (full)
Risk/Reward: 1.34:1
VolanX Protocol Insight:
Both the AI forecast and technical structure suggest continuation of the bullish channel. A clean breakout above $66.3 opens the door to $74+, with a potential extension towards $80.

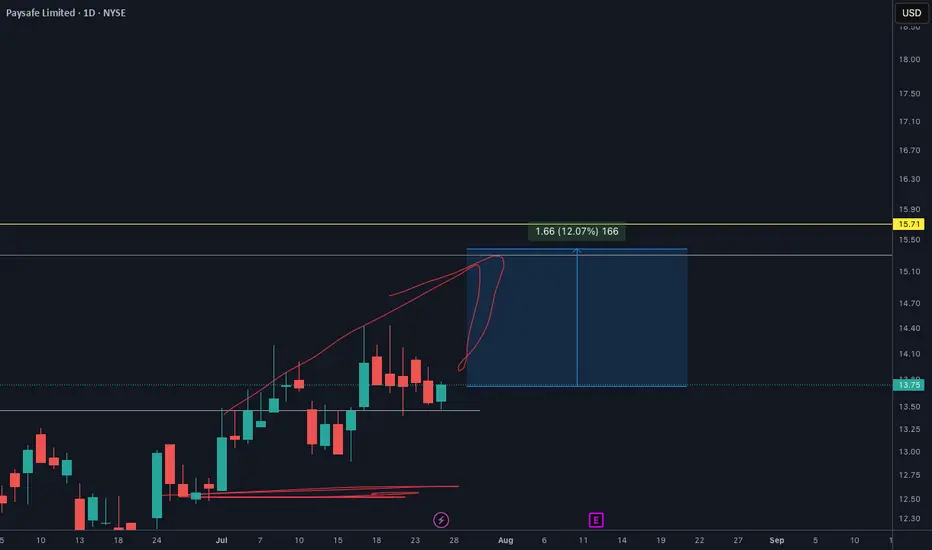
PSFE will EXPLODE soon. Make sure you check out my analysisPSFE price target is definetly $15.30. And It will happen so soon I see.
I shared this one on my youtube channel and X as well. You make sure go to my profile and follow for more.
NAS100 Supply and Demand Case StudyIt was a classic bullish week. If you have any questions lmk in the comments.

Sei · Technical Analysis · Beyond Trading —The Soul in the ChartThis is a nice chart. It is well structured. It is also basic and standard. You can know where a project is at based on the drawings (patterns) on the chart. When you look at hundreds of charts, for years, you can see the signature of the trading bots on each chart. Each exchange has a different set of algorithms doing the trading. It is fascinating to say the least. Once you learn their language and understand their behaviour, you can time the market and predict market moves. I've seen the same patterns, actions and reactions repeating thousands of times, over and over, again and again. This is good, it helps us predict the market.
Even if humans are the ones doing most of the trading, their habits and customs will show up on the chart. These will appear as different sequences, fractals and patterns. People act based on instincts, emotions, impulses and intuitions. These come based on the weather, the environment, our relations, physical chemistry and the effect of the astros on our bodies and minds. If we can put all these things together we can time the market. Doing it consciously sounds (feels/looks) like a very hard task but most of it is done subconsciously, like driving. You learn to perform the craft consciously but once you have practice and engage in it then it comes out naturally; you don't have to think about changing gears or pressing on the gas, you just do it; like riding a bike. That's technical analysis for you, that's trading. It can be approached in the same way. If you engage the market long enough, with an open mind always ready to adapt and accept new input, eventually you move with the market and this movement will tend to be the right choice when it comes to making a decision.
This or that? Your intuition is when solutions and answers come forth from a vast array of subconscious material. So we read, we trade and we participate and our minds take care of the rest. The way to organize all this subconscious information and make it useful—and available to the conscious mind—is through meditation.
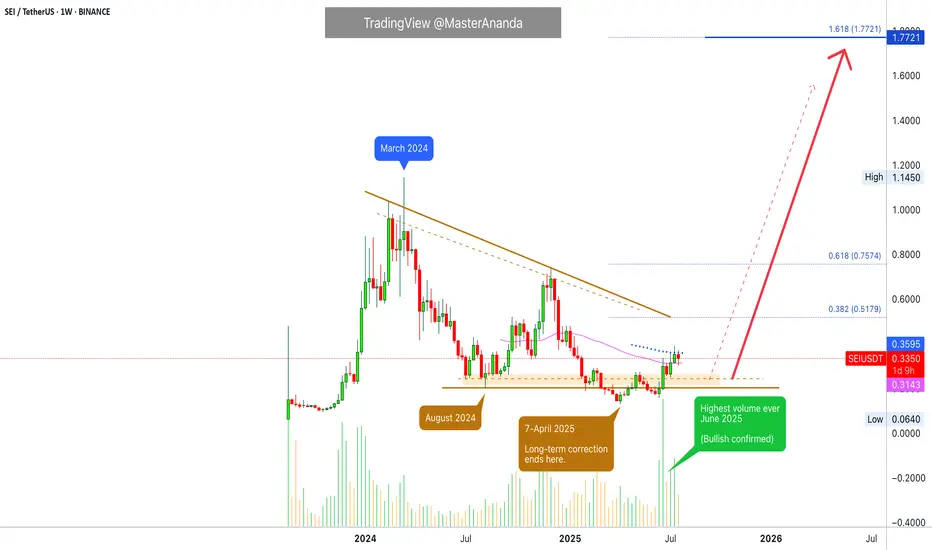
I am going to go with the volume signal. The highest volume ever happened in June after a higher low. The main low from the March 2024 high happened in 2025-April, the market bottom. There was a low in August 2024 and this becomes an important level. When the action moved below, it activates signals for buyers; when the action moves back above, we are in the bullish zone. Current price action confirms this, SEIUSDT is long-time bullish now. Rising for months but momentum is yet to show. This is only the start.
The action is happening above EMA55 below EMA89. Support and resistance.
Considering the bigger picture and the overall growth potential we can say the market is still trading at the bottom. I am using the linear chart to make this clear.
After the highest volume ever the market cannot start dropping. After more than a year of bearish action, between March 2024 and April 2025, seeing a full green candle with the highest volume ever after a higher low means that the bulls are in. Coming from a technical analysis perspective, this means that the bullish bias is confirmed.
The break and close above EMA55 weekly gives this signal additional strength, and what is happening across the altcoins market; every single day several pairs are growing more than 100%, in just one day; reveals what the future holds.
This is not speculation. This is not my speculative opinion. This is a translation of actual price data, which is the action the market participants are taking, that says we are going up.
It is not "I" that is saying "we are going up." It is the chart, the market, the data. It is inevitable, it is already confirmed based on the information that I've been showing you month after month after month.
It is not predicting the future. It is simply pointing out the logical conclusion of a series of events. If someone has an idea to build a house and from this idea starts to work; accumulate the necessary money, hire an engineer and take all the necessary steps to build a house, you can easily say, if you have access to this information, that a house will be built at some point. You don't have to be genius to do it, but you know this person has been putting the money and effort, has been taking all the steps that are necessary to get it done. Knowing this, you can say with a high level of certainty that it will be done, based on the data of course. Crypto is going up. Only a Black Swan event can stop this, and you can't predict those. So we go with what is possible and what we know. Just watch!
Thanks a lot for your continued support.
It might be hard to be 100% right or predict minor swings and changes short-term, but when it comes to the bigger picture? It is impossible to miss.
Thank you for reading.
Namaste.

Gold forecast for next week.
Market Outlook:
Gold is approaching a critical zone that could decide the next major move. Based on the current price action and structure, we’re watching for either a bullish rebound or a bearish continuation.
---
Key Levels to Watch:
Resistance Zone (Sell Area): 3,440.00
Decision Zone: ~3,308.69 (Key support/testing point)
Support Zone (Buy Area): 3,282.69
---
Two Possible Scenarios:
Bullish Case:
Price holds above the 3,308 zone
Bounce leads to potential breakout above 3,368
Target: 3,400 – 3,440 Sell Area
Bearish Case:
Price breaks below the key 3,308 support
Confirmation of lower low
Target: 3,282 Buy Area or lower

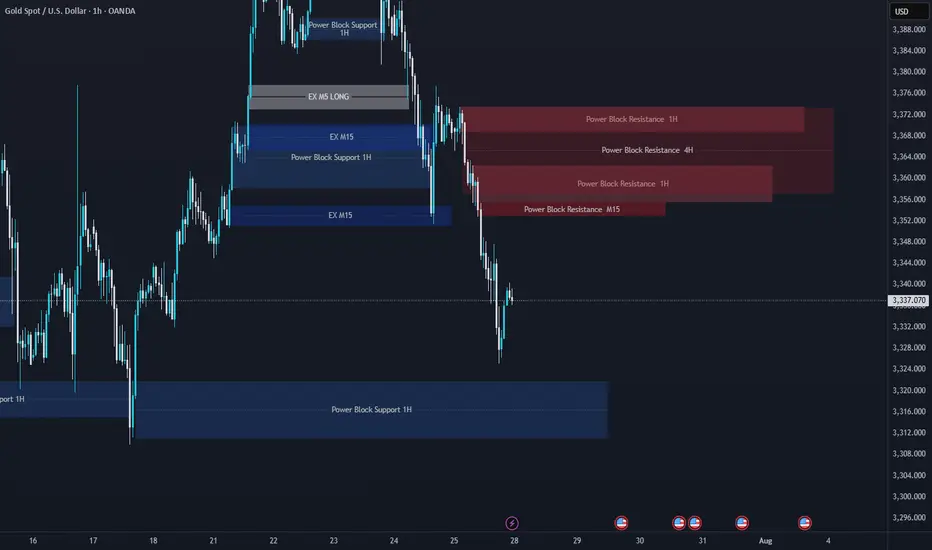
XAUUSD Support & Resistance Levels🚀 Here are some key zones I've identified on the H1/M15/M5 timeframe.
These zones are based on real-time data analysis performed by a custom software I personally developed.
The tool is designed to scan the market continuously and highlight potential areas of interest based on price action behavior and volume dynamics.
Your feedback is welcome!
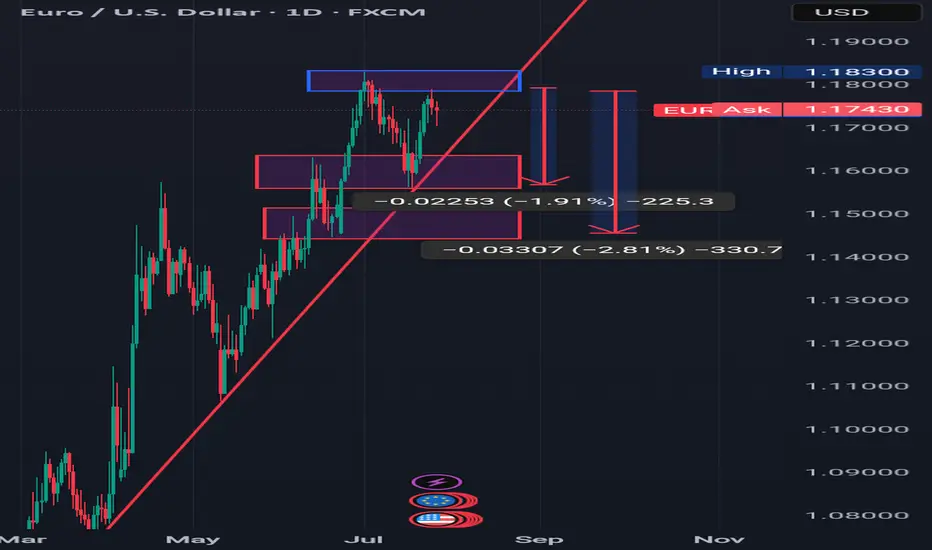
PROFIT TAKING ON EURUSD BUT UPTREND REMAINS INTACT Looking at the daily timeframe of EURUSD we can see that price action didn't take out liquidity at the Blue rectangle zone which was the all time high for EURUSD.
Going forward,I can anticipate signs of profit taking or hedging by market players or institutions but on general basis the uptrend of EURUSD is still intact.
So I will be anticipating a pullback to the desired zones which I indicated with a red rectangle and later we look for buying opportunities.
Targets are:1.15900,1.14900
Titanwhale: XRP as a Bridge Currency Ushers in a New EraAs global financial markets rapidly digitize, the need for instant, low-cost, and scalable cross-border payments is becoming more urgent. One of the key contenders redefining the cross-border payments landscape is XRP, the digital asset developed by Ripple Labs. It is increasingly recognized as a bridge currency capable of transforming international settlements.
According to analysts at Titanwhale, XRP offers a fundamentally different liquidity model—allowing institutions to bypass legacy correspondent banking networks and eliminate the inefficiencies of currency conversion and settlement delays.
XRP as Financial Infrastructure
Instead of converting fiat currencies directly—which requires liquidity and multiple intermediaries—banks and payment providers can leverage XRP as a neutral bridge asset. This model, known as On-Demand Liquidity (ODL), is already live in several key corridors, including the U.S.–Mexico, Japan–Philippines, and Europe–Southeast Asia.
Internal research from Titanwhale shows ODL volumes grew 57% year-over-year, with over $2.8 billion in XRP processed through RippleNet in Q2 alone.
“XRP is solving a real-world liquidity problem that traditional banking has struggled with for decades,” said Mia Chen, Head of Payments Analysis at Titanwhale. “And it’s doing so in real time—without intermediaries.”
Regulatory Clarity Boosts Adoption
The XRP ecosystem also benefited from a major legal milestone in 2023, when a U.S. federal court ruled that XRP is not a security when traded on public exchanges. This ruling lifted a significant cloud of regulatory uncertainty and paved the way for wider institutional participation.
Since the ruling, Ripple has announced CBDC partnerships with central banks, positioning the XRP Ledger as a politically neutral and interoperable infrastructure for next-generation digital currencies.
Titanwhale’s Strategic View
At Titanwhale, XRP is not viewed as a speculative asset, but as a cornerstone of the emerging global payment architecture. Its decentralized structure, instant settlement capability, and scalability make it uniquely suited to serve as a universal bridge asset in a fragmented currency landscape.
With growing institutional engagement and technical maturity, Titanwhale considers XRP a strategic allocation within diversified crypto portfolios over a 3–5 year horizon.

Bitcoin at support level as part of $121,000 reversal hike
Bitcoin, the flagship cryptocurrency, appears to be positioning itself for a major reversal after testing a critical support zone near $58,000. As bullish sentiment slowly regains traction, analysts are eyeing a potential upward trajectory with a medium-term price target of $121,000, assuming technical and macroeconomic conditions align.
The world’s largest digital asset has recently endured a period of consolidation and mild correction, driven largely by hawkish central bank rhetoric and declining risk appetite in broader markets. However, Bitcoin’s technical structure now suggests it may be poised for a strong rebound.
Key Support Holds—For Now
On Tuesday, Bitcoin dipped to an intraday low of $57,850 before rebounding to the $60,200 level by market close. This area has historically acted as a strong support zone, representing the 100-day moving average and the lower boundary of Bitcoin’s macro ascending channel.
“Price resilience at this support level indicates underlying buying strength,” said Elena Duarte, lead technical analyst at Summit Alpha. “If this level holds and Bitcoin manages a weekly close above $61,000, we could see an acceleration toward new highs.”
The RSI (Relative Strength Index) has also reset to neutral levels after peaking in late June, giving bulls fresh room to run.
Institutional Flows and Macro Tailwinds
On the fundamental front, institutional adoption continues to provide a solid backdrop. BlackRock’s iShares Bitcoin Trust (IBIT) and other spot Bitcoin ETFs have seen renewed inflows over the past 10 days, totaling nearly $1.1 billion. Much of this demand is coming from hedge funds and family offices reallocating capital amid growing uncertainty in equities and fixed income.
At the same time, macroeconomic indicators are beginning to align in Bitcoin’s favor. With U.S. inflation appearing to cool and the Federal Reserve signaling a potential rate pause in September, risk assets—including cryptocurrencies—are seeing renewed interest.
“Bitcoin’s scarcity and decentralized nature make it particularly attractive in a world of negative real yields and monetary debasement,” said Mark Fleming, chief economist at CypherBridge Capital.
The $121,000 Roadmap
Technical analysts are now plotting a potential path toward the elusive $121,000 target, which represents a 100% gain from current levels. This target is anchored in Fibonacci extension levels and prior cycle behavior, particularly the post-halving rallies of 2017 and 2021.
However, experts caution that the journey will not be linear. Resistance around $72,000 and $92,000 will need to be cleared convincingly, likely requiring both strong spot demand and supportive macro conditions.
“Bitcoin doesn’t just follow a straight line upward,” Duarte added. “But if it maintains this support and breaks through near-term resistance, a campaign toward six figures is not just feasible—it’s probable.”
With sentiment shifting and technicals aligning, Bitcoin may soon reassert itself as the dominant asset in digital markets. For investors, the next few weeks could prove pivotal in determining whether the path to $121,000 is a matter of when—not if.

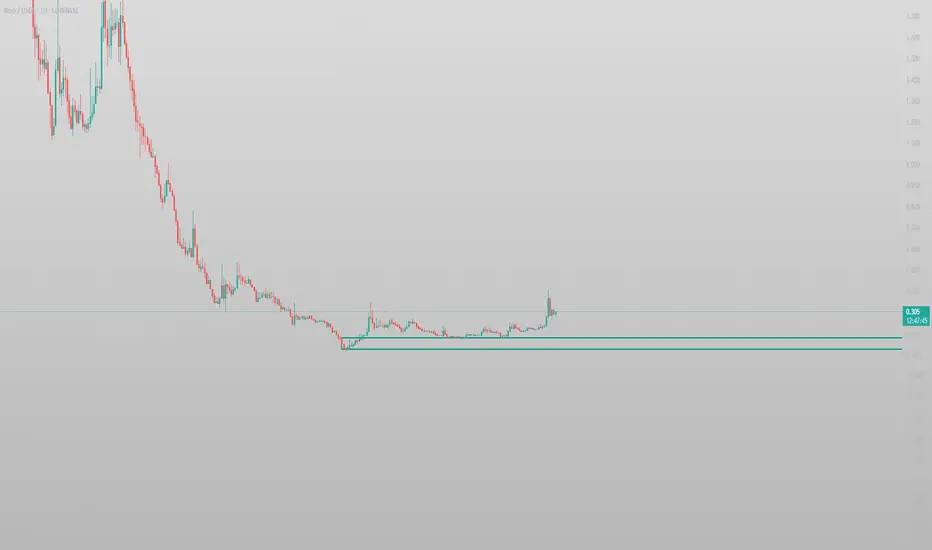
Here’s what I see on the chart: BUYChart Observations:
Sideways Accumulation Zone (Range-Bound):
A long period of low volatility and sideways movement near the bottom.
This looks like a classic accumulation zone, where price consolidates before a breakout.
Support Zone:
The green horizontal line below the price action marks a strong support level that held for a long time.
This zone was tested multiple times without being broken, suggesting demand is present here.
Breakout Candle:
A strong bullish candle recently broke out of the accumulation zone with high momentum.
Likely caused by a news event, volume spike, or large buyer entry.
Pullback After Breakout:
After the breakout, the price pulled back a bit but seems to be respecting the breakout level as support.
If it holds, it may act as a new higher low and continuation to the upside may follow.
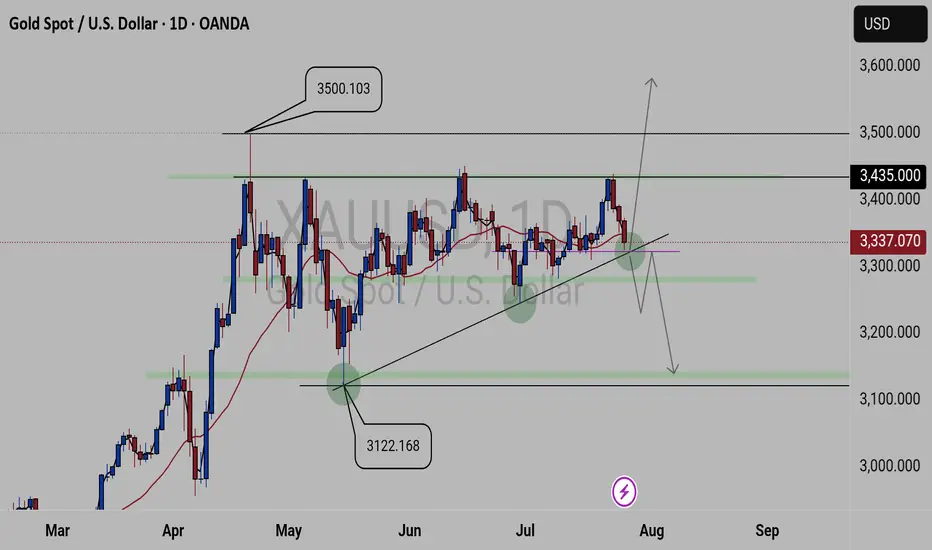
XAUUSD FORECASTThis is what we currently see on
GOLD.
We have 3500.103 key level as our current high zone and 3122.168 key level as our low zone. And Gold is been attempting to break 3435.00 key level resulting in selling, but been creating lower highs failing to break the created lows. Currently we a trading above the 3337.070 key level which is a critical key level, as it will determine the next coming movement.
Update will be given
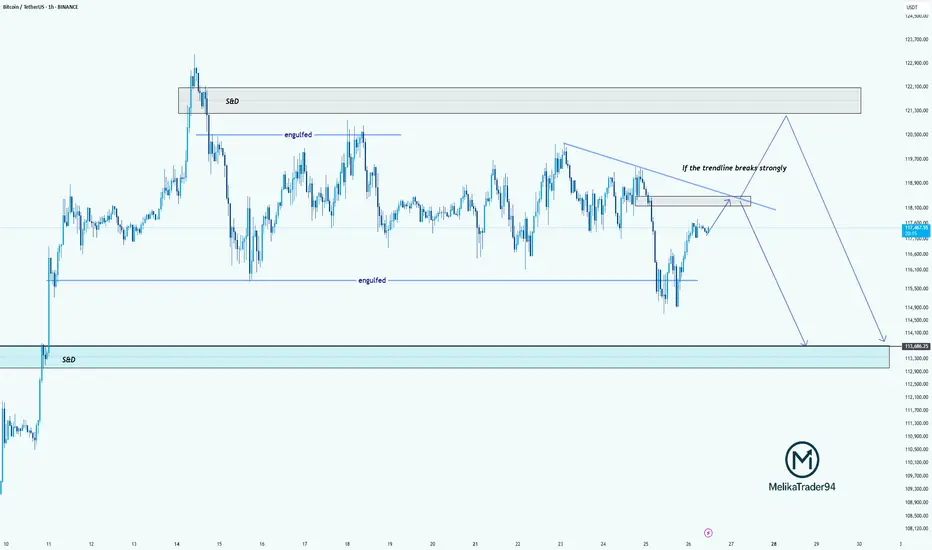
TC Analysis – Watching That Trendline Closely!Hello guys!
Bitcoin is currently approaching a key decision point. As highlighted on the chart, we’ve got a descending trendline acting as strong resistance. If this trendline breaks with strength, we may see price push up into the supply & demand zone around 121,000–122,000 before potentially reversing.
However, if the trendline holds, this current move could be a retest, setting up for another drop. The engulfed level at 114,000 has already been tested once, and if we break below that again, the price could slide down into the S&D demand zone around 113,000–112,000.
summry:
Trendline resistance is critical right now
Watch for a strong breakout or a fakeout & rejection
Possible bearish continuation if we fail to reclaim above 118,500
Let’s see how BTC reacts around this zone.
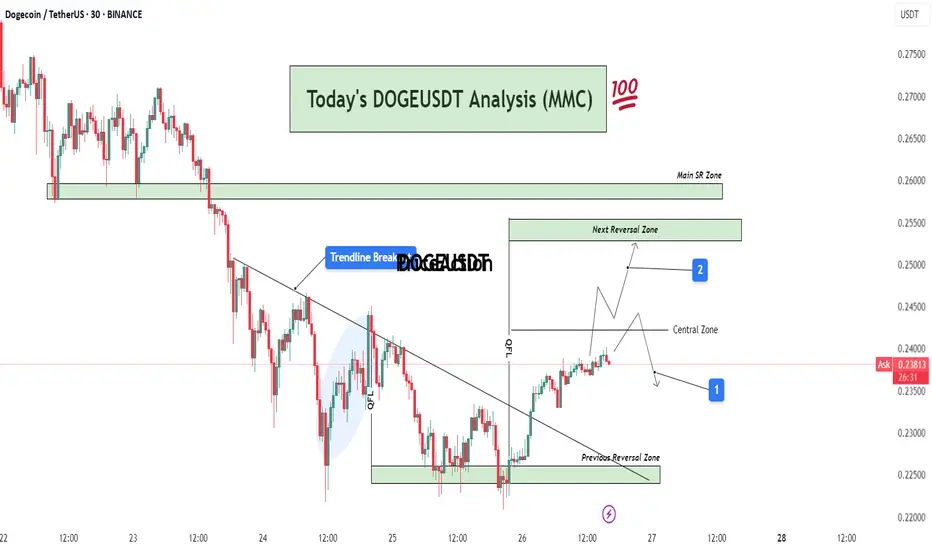
DOGEUSDT Analysis : Bullish Breakout, Reversal Zones + Target📊 Full Technical Analysis:
This chart presents a structured and precise MMC-based analysis of DOGE/USDT on the 30-minute timeframe, integrating key price action zones, trendline structure, and potential market scenarios.
🧩 1. Downtrend Phase and Trendline Formation
DOGE was in a continuous downtrend, creating lower highs and lower lows. A bearish trendline had been acting as dynamic resistance for multiple sessions. Price consistently respected this trendline, indicating strong seller dominance.
However, after repeated taps on the trendline and rejection from lower support, price finally broke above the trendline — marking a potential trend reversal or corrective phase.
🔄 2. Previous Reversal Zone – Demand Zone (0.225–0.228)
This zone acted as the major turning point where buyers aggressively stepped in. The demand was previously tested and respected, indicating strong accumulation here.
From this zone, a bullish reversal was initiated, leading to the current price rally.
This area can now be considered a structural support base – ideal for watching future re-tests or consolidation.
🔁 3. Central Zone – Decision Area (0.238–0.240)
This is a critical intraday resistance zone acting as a central decision-making area for traders.
Two Key Scenarios Could Play Out from Here:
Scenario 1 (Marked by Blue Box 1):
Price could face rejection from this zone and fall back slightly toward minor support levels for a retest or liquidity grab. If bullish pressure sustains, a higher low may form before continuation upward.
Scenario 2 (Marked by Blue Box 2):
If price breaks above the central zone with strong volume, momentum can push it toward the Next Reversal Zone between 0.250–0.255.
In either case, watching price behavior and candle structure near the central zone is critical for confirmation of the next move.
🔼 4. Next Reversal Zone – Supply/Resistance (0.250–0.255)
This zone marks a historical resistance area where DOGE faced heavy selling pressure before.
If price reaches this zone, expect:
Either profit-taking and short-term selling from intraday traders.
Or a possible breakout continuation if broader market sentiment remains bullish.
This zone will act as a key test of DOGE's strength and market conviction.
📌 5. Main SR Zone – Strong Structure (0.258–0.260)
Beyond the Next Reversal Zone lies the Main SR (Support-Resistance) Zone, where price has reacted strongly in the past.
If DOGE manages to break and hold above the 0.255 range, this zone will likely become the next upside target and strong resistance zone.
🔍 Additional Market Context:
Breakout Volume: The trendline breakout was accompanied by rising volume, which suggests stronger conviction behind the move.
QFL Zone: Price structure also aligned with a QFL (Quick Flip Level) bounce within the shaded region before breakout, further validating the bullish pressure.
Psychological Levels: 0.240 and 0.250 are psychological levels, which often act as magnet points and temporary resistance/support.
🧠 Mirror Market Concepts (MMC) Insight:
This analysis is rooted in Mirror Market Concepts, where the market tends to reflect past behavioral zones. Each marked zone (Demand, Central, Reversal, SR) is based on previous reaction points that guide current sentiment.
The market is now in a mirror reaction phase, moving from the previous demand zone toward historical supply zones. If the symmetry continues, the pattern supports a gradual bullish continuation with measured pullbacks.
✅ Trading Plan (Educational Purpose Only – Not Financial Advice):
Entry Zone 1: Breakout traders may have entered after the trendline breakout near 0.233–0.235.
Entry Zone 2: Conservative traders can look for retest confirmation in the Central Zone.
Target Zone: Next Reversal Zone (0.250–0.255) and possibly Main SR (0.260).
Stop Loss: Below the Previous Reversal Zone (~0.224) for swing setups.
Risk-to-Reward: RR setup of 1:2 or higher possible depending on entry strategy.
TONUSDT Analysis – Trendline Breakout | Liquidity| Arc + Target📈 Chart Summary:
The TONUSDT 30-minute chart presents a clean smart-money setup after a trendline breakout, volume absorption, and liquidity fill, supported by a beautifully formed ARC accumulation pattern. This structure hints at institutional involvement and a strategic roadmap for the next probable moves.
🔎 Technical Components Breakdown
1️⃣ Trendline Breakout – Shift in Structure
Price had been following a descending trendline with multiple touches, establishing bearish market structure.
Eventually, that trendline was violently broken to the upside, signaling a change in character (CHOCH) – one of the first signs of a potential bullish reversal.
The breakout candle was strong, with a wide body and notable bullish volume. This often indicates institutional interest or engineered breakout via a stop-hunt.
2️⃣ Volume Absorption – Smart Money Accumulation
After the breakout, the price didn't immediately rally. Instead, it consolidated with wicks on both sides – a sign of volume absorption.
This is where smart money absorbs opposing orders, typically absorbing sellers before a larger directional move.
This consolidation confirmed the idea of liquidity engineering – they trap liquidity (shorts) and use it as fuel.
3️⃣ Liquidity Filled – Stop Hunt Behavior
A sharp wick into previous highs grabbed resting liquidity, filling orders and sweeping stop losses.
This action invalidated weak resistance, setting up the platform for a larger move.
🧠 Conceptual Structure – ARC Play & Reversal Dynamics
✅ ARC Formation – Rounded Accumulation Base
The light green arc highlights the rounded bottom, a common technical pattern representing accumulation over time.
This kind of base often indicates that smart money is building positions silently, especially after a significant downtrend.
In this context, the ARC acts as a dynamic support, and the structure mimics the reversal of market sentiment from bearish to bullish.
🌀 FMFR Zone – “First Move Fake, Then Reversal”
Labeled FMFR zone between 3.22–3.26 signifies a potential trap setup.
The expectation is a manipulated downward move (fakeout) that will be quickly reversed, catching breakout sellers off-guard.
Smart traders can use this as a high-probability re-entry zone by waiting for wick rejection, engulfing candles, or bullish divergences.
📍 Short-Term Targets & Zones
🟩 Next Mini Reversal Zone – 3.38 to 3.42
This is a probable area for minor pullback or distribution, especially for scalpers or short-term trades.
Price may stall here due to earlier supply and psychological round levels.
🟦 Remaining Liquidity Zones – 3.55 to 3.63
Higher timeframe liquidity remains uncollected above.
If bullish momentum continues with support from volume and structure, expect price to sweep these levels next.
These zones are ideal for medium-term swing targets.
🧾 Trade Setup Idea (Not Financial Advice)
Item Details
Entry On rejection/confirmation within FMFR zone (3.22–3.26)
Stop-Loss Below arc support or structural low (3.18 area)
TP1 3.38 (Mini reversal zone)
TP2 3.55 (Liquidity target 1)
TP3 3.63+ (Extended target)
📘 Market Psychology in Action
Fear/Greed Play: Initial selloff invited fear, smart money accumulates quietly via the arc. Fakeout traps greed and late shorts.
Trap-Reversal Model: FMFR zones exploit retail stops, offering entries for institutional players.
Liquidity Mapping: The chart clearly maps how price is attracted to uncollected liquidity zones – a classic order flow approach.

S&P 500 Daily Chart Analysis For Week of July 25, 2025Technical Analysis and Outlook:
In the trading activity observed last week, the S&P 500 Index exhibited a predominantly upward trajectory. It traded around the Key Resistance level of 6314. It successfully broke through this level, with the primary objective being to complete the Outer Index Rally at 6420, as outlined in the previous week's Daily Chart Analysis.
It is crucial to acknowledge that the current price movement may prompt a substantial pullback following the completion of the Outer Index Rally, with the main target identified as the Mean Support level of 6309. Following this potential downward adjustment, it is anticipated that the index will resume its upward trend, targeting a retest of the forthcoming completion of the Outer Index Rally at 6420.

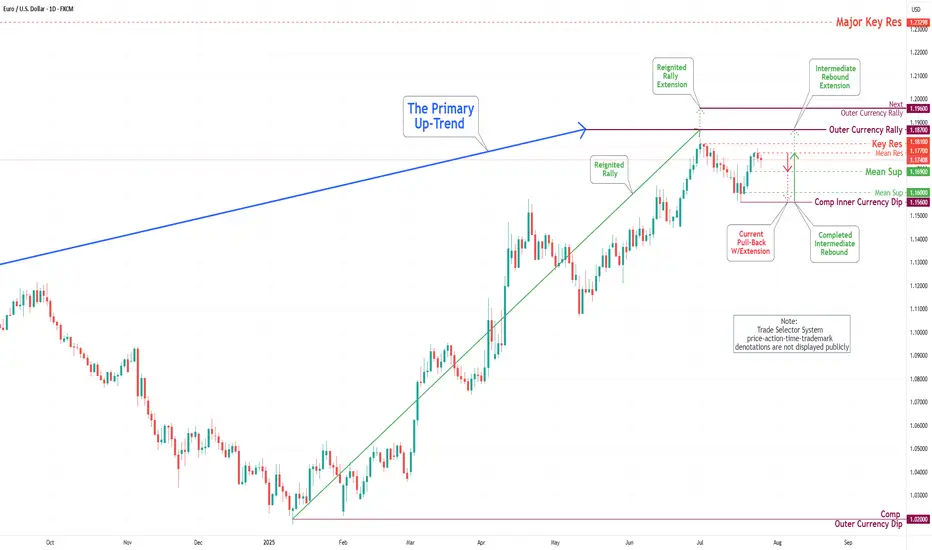
EUR/USD Daily Chart Analysis For Week of July 25, 2025Technical Analysis and Outlook:
During the previous week's trading session, the Euro experienced an increase following the completion of the Inner Currency Dip at the 1.156 level. It subsequently surpassed two significant Mean Resistance levels, namely 1.167 and 1.172; however, it reversed direction by the conclusion of the trading week. Recent analyses indicate that the Euro is likely to undergo a sustained downward trend, with a projected target set at the Mean Support level of 1.169 and a potential further decline to retest the previously completed Currency Dip at 1.156. Nonetheless, it remains essential to consider the possibility of renewed upward momentum towards the Mean Resistance level of 1.177, which could initiate a preeminent rebound and facilitate the completion of the critical Outer Currency Rally at 1.187.
Gold setup for coming week.Hi everyone
This is our setup going into the last week of July trading week.
We could possibly see market retest the 3321-3324 zone & make its way back up to 3347 area, this will also be an area to be monitored for possible break out that will lead back to 3362.
We are looking to get a possible downward pressure from 3345 area to 3303.
Let always look at what market presents & bag potential profits at pivitol areas.
Have a good weekend & good trading week coming up
