RUT Echoes IWM – The Livermore Playbook?The Russell 2000 (RUT) is painting a structure that mirrors the IWM ETF – a widening accumulation channel, setting up for a potential breakout. The VolanX protocol flags this as a classic Livermore Speculative Chart pattern, where phases of quiet accumulation lead to an explosive markup.
Channel Support: ~2,245 is holding as the battleground for bulls.
Short-Term Projection: Expect a possible ping-pong move between 2,260 – 2,300 before the real momentum ignites.
Breakout Level: Above 2,310, the price could rip toward 2,390–2,400 (Livermore’s “point 10” territory).
VolanX suggests that this structure is not random – IWM and RUT are moving in tandem, with mid-cap risk appetite quietly building. If liquidity inflows continue, this setup could fuel a sharp vertical rally into August.
"Are you seeing the same Livermore-style accumulation in IWM as VolanX does?"
#RUT #IWM #VolanX #Livermore #Accumulation #BreakoutWatch #TradingView
Beyond Technical Analysis

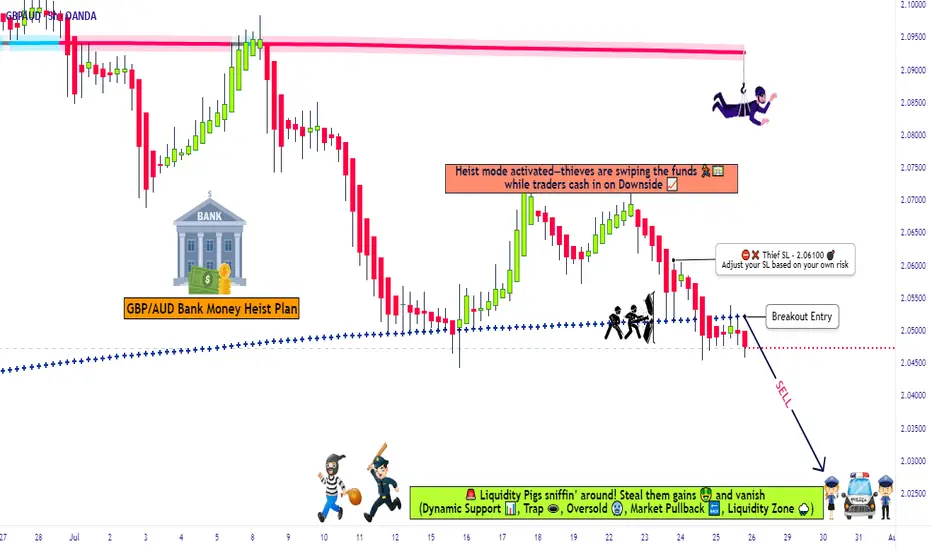
High-Stakes GBP/AUD Short Plan – Grab the Bag & Escape Early!💥🔥GBP/AUD HEIST OPERATION: The Pound vs Aussie Bear Trap Masterplan 🔥💥
(Thief Trader Exclusive TradingView Drop – Smash Boost If You’re Ready To Rob The Market!)
🌍 Hi! Hola! Ola! Bonjour! Hallo! Marhaba! 🌍
Welcome, Money Makers & Market Robbers! 🤑💰✈️
This isn't just analysis — it's a high-stakes forex heist, engineered using Thief Trading Style's elite blend of technical, macro, sentiment, and quantitative insights. We're cracking the GBP/AUD vault with sharp bearish setups targeting a major liquidity zone — aka the Police Barricade Support Area! 🚨🔫
📉 Plan of Attack – Short Entry Setup
This isn’t your typical chart — this is blueprint-grade precision. Here's the GBP/AUD short strategy for Day & Swing Traders:
🚪 ENTRY ZONE
Initiate bearish positions at or near recent highs (wick level).
Use limit orders stacked (layering/DCA style) on the 15m or 30m retest zones for sniper entries.
Look for wicks with rejection — that’s where the fake bullish robbers get trapped!
🛑 STOP LOSS
Place SL just above recent 4H swing highs (2.06100 as a reference).
Adjust according to position size and the number of orders you’re layering.
🎯 TARGET ZONE
Aim for 2.02500, or book partial profits earlier if the heist gets heat.
Escape before the alarms ring! Secure the bag and vanish like a pro.
🔍Fundamental & Sentiment Heist Intel 📚
This bearish pressure on GBP/AUD isn’t random — it’s triggered by a perfect storm:
COT Positioning flips 📊
Aussie strength from commodities & RBA commentary 📈
GBP uncertainty from macro tightening & economic data ⚖️
Sentiment exhaustion at highs + false bullish trap 📉
Consolidation zone breakdown = smart money move! 💼
Wanna go deep? 🧠
Tap into COT, Macro Trends, Intermarket Analysis & Thief’s proprietary scoreboardsss 📡🔗
⚠️ News & Position Management Alert 🚧
📰 Avoid entry around key news drops
🔒 Lock in profits with trailing SL
💼 Secure capital > Chase greed
🔥 SHOW SOME LOVE 🔥
💖 Smash that ❤️ BOOST button — it powers our next big heist!
Together, we rob the market with style, skill, and precision.
See you on the next breakout robbery mission, legends!
Stay dangerous. Stay profitable. Stay Thief. 🐱👤💵🚀
link buy midterm"🌟 Welcome to Golden Candle! 🌟
We're a team of 📈 passionate traders 📉 who love sharing our 🔍 technical analysis insights 🔎 with the TradingView community. 🌎
Our goal is to provide 💡 valuable perspectives 💡 on market trends and patterns, but 🚫 please note that our analyses are not intended as buy or sell recommendations. 🚫
Instead, they reflect our own 💭 personal attitudes and thoughts. 💭
Follow along and 📚 learn 📚 from our analyses! 📊💡"

GBPUSD Idea – Demand Zones & Potential Reversal Play🧠 MJTrading:
After a steady downtrend, GBPUSD is now approaching a strong 4H demand zone (Support 1), where we previously saw explosive bullish reactions.
Price is also extended from both EMAs, showing potential for a technical pullback or full reversal.
💡Scenarios to consider:
🔹 If Support 1 holds → we may see a bounce toward 1.3500+
🔹 If broken → Support 2 & 3 offer deeper liquidity and high-probability demand zones
👀 Watch for:
Bullish reversal candles (engulfing / hammer)
Bullish divergence on lower timeframes
Volume spikes on reaction
⚠️ Invalidation:
If Support 3 breaks with strong momentum, we might enter a bearish continuation phase.
#GBPUSD #Forex #ChartDesigner #SmartMoney #PriceAction #MJTrading #ForexSetup #TrendReversal #SupportZones


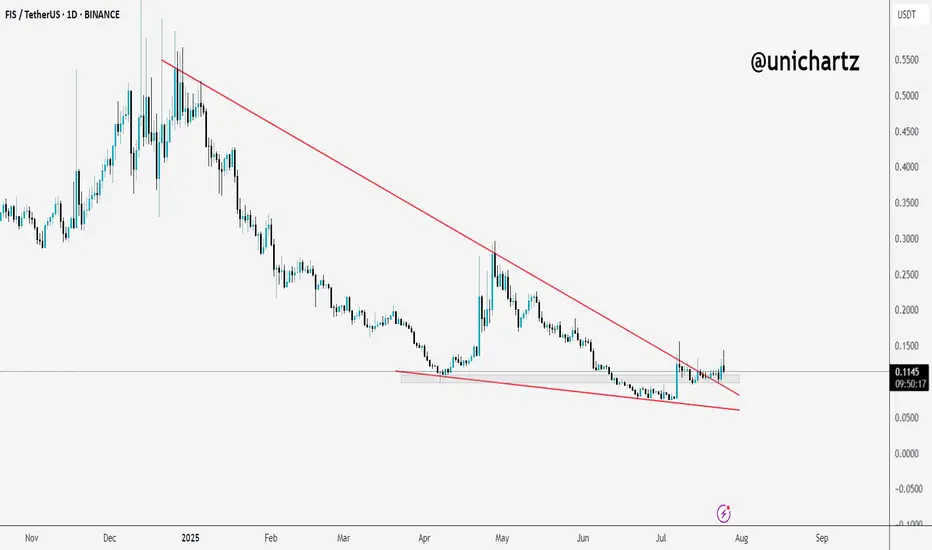
FIS Breaks Out of Falling Wedge – Reversal in Play?$FIS/USDT has finally broken out of a long-term falling wedge pattern, a structure that often signals reversal.
Price is now holding above the breakout zone, showing signs of strength.
As long as it stays above the wedge, we might see further upside in the coming days.
DYOR, NFA
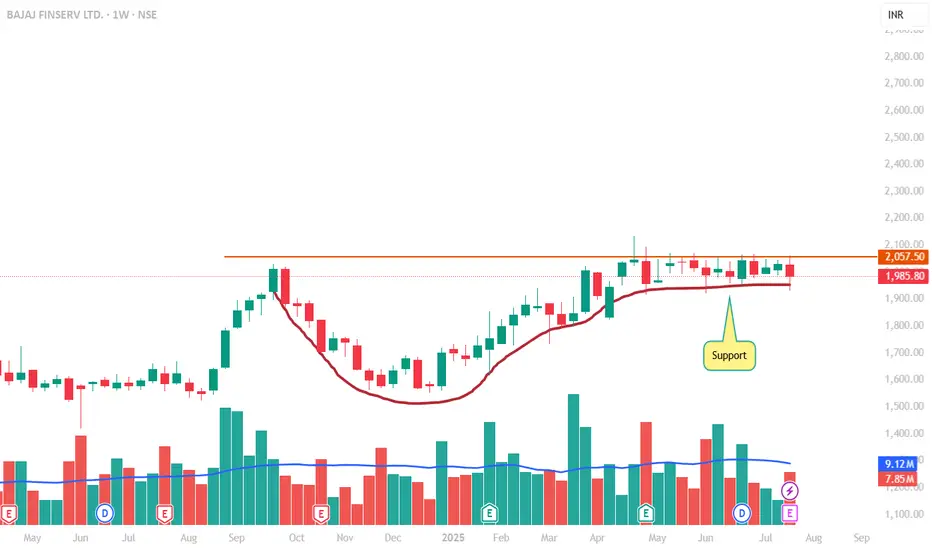
BAJAJ FINSERV LTD. Cup & HandleBAJAJ FINSERV LTD. Cup and Handle Structure on weekly chart. place Stoploss according to Table shown in chart.
Regulatory Note: We are an independent development team. Our private indicator and services are not registered or licensed by any regulatory body in India, the U.S., the U.K., or any global financial authority. Please consult a licensed advisor before making trading decisions.
COIN 0DTE Trade Breakdown – July 25, 2025
📉 COIN 0DTE Trade Breakdown – July 25, 2025
Put Play or Pass? Let’s break it down 👇
📍 Price: $392.34
🧠 Sentiment: Neutral → Bearish
📊 Call/Put Ratio: 1.08 (Balanced flow)
⚠️ Gamma Risk: HIGH
⌛ Time Decay: Accelerating (0DTE!)
⸻
🎯 TRADE IDEA: 0DTE PUT
✅ Strike: $380.00
💵 Entry Price: $0.69
🎯 Profit Target: $1.00
🛑 Stop Loss: $0.37
📆 Expiration: Today (Jul 25)
📈 Confidence: 65%
📍 Entry Timing: At Open
⸻
⚠️ Why This Trade?
🔻 RSI trending down
🚫 Weak institutional volume
⚠️ High volatility expected from gamma squeeze
🕒 Tick. Tock. Time decay’s your biggest enemy here.
📌 Strategy:
➡️ Naked PUT (speculative short-term play)
⛳ Goal? Quick move → quick exit
⸻
🚨 Risk Warning:
❗ 0DTE = Massive swings
❗ One wrong move = rapid premium decay
❗ Stay nimble. Know your exit.
⸻
💬 Drop a 🔥 if you’re watching COIN today
#OptionsTrading #0DTE #COIN #DayTrading #PutOption #TradingView #StockTok #GammaRisk #TradeSetup

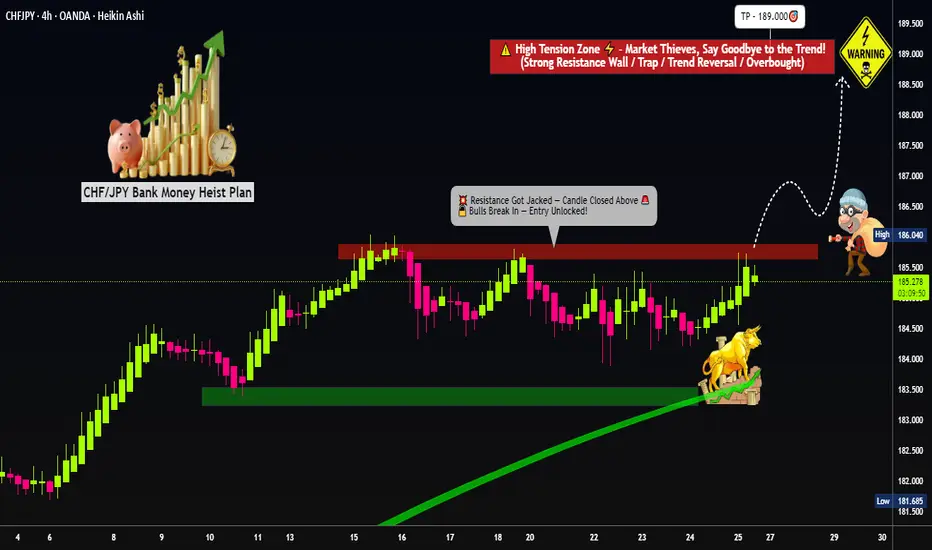
"Master Plan to Rob CHF/JPY – Breakout Trading Idea"💣CHF/JPY Forex Heist: Swiss vs Yen 🔥Master Robbery Plan Unfolded!
🌟Hi! Hola! Ola! Bonjour! Hallo! Marhaba!🌟
Dear Money Makers, Bandits & Chart Pirates 🤑💰💸✈️
It's time to reload your gear and lock in the blueprint. Based on our 🔥Thief Trader Technical + Fundamental Intelligence🔥, we’re all set to ambush the CHF/JPY "Swiss vs Yen" battlefield. This ain’t no casual walk—it’s a full-scale market operation targeting the High Voltage Reversal Trap Zone⚡. The pressure is real: Overbought, Tricky Consolidation, and Bears camping at resistance. Your job? Steal profits before they smell the breakout! 🏆💪💵
🎯 Entry Point — "Let the Heist Begin"
🗝 Entry Level: Wait for the Breakout @ 186.000. When price shatters the Moving Average ceiling—that's your greenlight!
🚀 Execution Choices:
Place Buy Stop above the breakout point
Or, use Buy Limit Orders near recent swing highs/lows on the 15/30-min chart using Layering/DCA tactics (that’s how the real thieves sneak in 🕶️).
🔔 Set an alert to stay sharp—don’t miss the vault crackin’ open!
🛑 Stop Loss — “Cover Your Escape”
🎯 SL Level: Just under the recent swing low on the 4H timeframe (around 184.000)
🚫 Never place the SL before the breakout confirms! Let the move prove itself first.
🧠 SL sizing depends on your capital, lot size, and number of entries stacked. You control the risk, not the other way around!
🎯 Target — "Cash Out or Vanish"
💎 First Take-Profit: 189.000
🚪Optional Escape: Secure the bag early if momentum fades. Better leave rich than be late!
👀 For Scalpers & Swing Robbers Alike
🔍 Scalpers: Only ride the Long wave.
💼 Big pockets? Hit straight entry.
👟 Small capital? Tag in with swing trades and trail that SL like a pro.
🎣 Use a Trailing SL to lock profits as price sprints toward resistance.
📰 The Bigger Picture: Why CHF/JPY?
The pair is pumped by:
📈 Macro Economics
📊 Quant Analysis
📰 COT Reports
📉 Intermarket Correlations
🧠 Sentiment Heatmaps
🔥 Future Price Dynamics
Don’t pull the trigger blind. Read the battlefield before charging in.
⚠️ Thief’s Caution Zone: News Traps Ahead
🛎 News = chaos.
📌 Avoid entering fresh trades during major data drops.
🔐 Use Trailing SLs to protect ongoing plays.
📉 Let the market dance, but you control the music.
💥Hit the Boost Button!💥
If this heist plan pumps your portfolio, smash that boost. That’s how we fund more blueprints, fuel the Thief Gang’s vault, and keep the robbery cycle alive.
🤑💵 Together, let’s rob this market clean—Thief Style.
New plan drops soon. Stay locked. Stay sharp. Stay profitable.
🧠💰🏴☠️
— Thief Trader Out 🐱👤🔓🚀
XAUUSDHello Traders! 👋
What are your thoughts on GOLD?
Gold entered a corrective phase after reaching the top of its ascending channel. Price is now approaching the channel bottom, which coincides with a key support zone.
As long as the channel support holds, we expect a bullish reaction from this area, potentially driving price back toward the next target level.
The uptrend remains valid as long as price does not break and close below the lower boundary of the channel.
A rebound from channel support may signal the start of the next upward leg.
Invalidation occurs only if price breaks and holds below the channel.
💡 Will gold bounce from channel support and resume its rally? Share your view in the comments! 🤔👇
Don’t forget to like and share your thoughts in the comments! ❤️
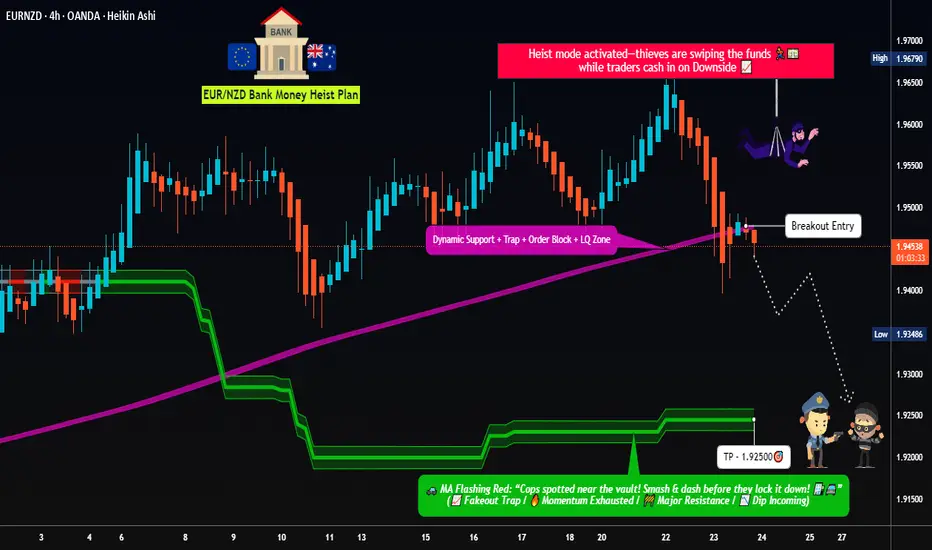
Dynamic Entry Alert – EUR/NZD Bearish Heist Execution!💣 EUR/NZD Robbery Blueprint: The Kiwi Vault Bearish Heist Plan 💰🕵️♂️
🌟Hi! Hola! Ola! Bonjour! Hallo! Marhaba!🌟
Dear Money Makers & Robbers, 🤑💰✈️
This ain't your usual trading tip — it’s a Thief Trading Masterstroke 🎯. We're gearing up for a high-stakes heist on the EUR/NZD forex market. Time to crack open the Kiwi vault and rob those bullish bandits blind! 😼💣
🧠 Strategic Mindset:
🔍 We're targeting the oversold consolidation zone. Bullish traders think they’re safe? Think again. This area is a trap — the perfect bait for our bearish ambush. Expect trend reversal vibes, layered with juicy liquidity grabs.
🕵️♂️ Entry Plan:
🎯 Sell Entry Trigger: Wait for a clean break below 1.94500.
💣 Setup:
Place Sell Stop Orders below the MA Support Breakout
Or... go stealth: Sell Limit Orders at nearest swing highs (15m or 30m timeframe)
Use DCA / Layering Method for multiple entries (scalp or swing tactics)
📌 Set your Alert 🚨 — no breakout, no entry. Patience pays.
🛑 Stop Loss Strategy (SL):
No premature moves! Don’t place that SL till we get the confirmed break.
🔥 SL Recommendation:
Just above 1.95700 (4H candle wick swing high)
Adjust based on lot size and number of layers
📍 Remember, the market’s a jungle — stay sharp or get sliced.
🎯 Take Profit (TP):
💵 Target Zone: 1.92500
(But hey, escape early if the vault starts shaking. Protect your gains like a pro.)
📊 Macro Intel – Why This Works:
This isn’t random — it's backed by our 🔥 combo of:
COT Reports
Sentiment Analysis
Quant/Algo Bias
Intermarket Correlation
Fundamental + Technical Confirmation
📌 You can dig deeper — but trust me, this setup’s been scouted like a pro job.
⚠️ Risk Protocols:
Avoid entries during high-impact news
Use Trailing SLs to lock in the loot
Adjust position size to suit your personal bankroll & risk appetite
🔥 Final Word from the Thief:
Smash that 💥Boost Button💥 if you're vibing with the heist plan!
Support the squad, stay profitable, and rob the market — legally, of course.
We don’t trade, we infiltrate.
We don’t predict, we execute.
📡 Stay tuned… More robbery blueprints coming soon!
🤑🐱👤🚨💸💪 #ThiefTrader #ForexHeist #EURNZDShortPlan
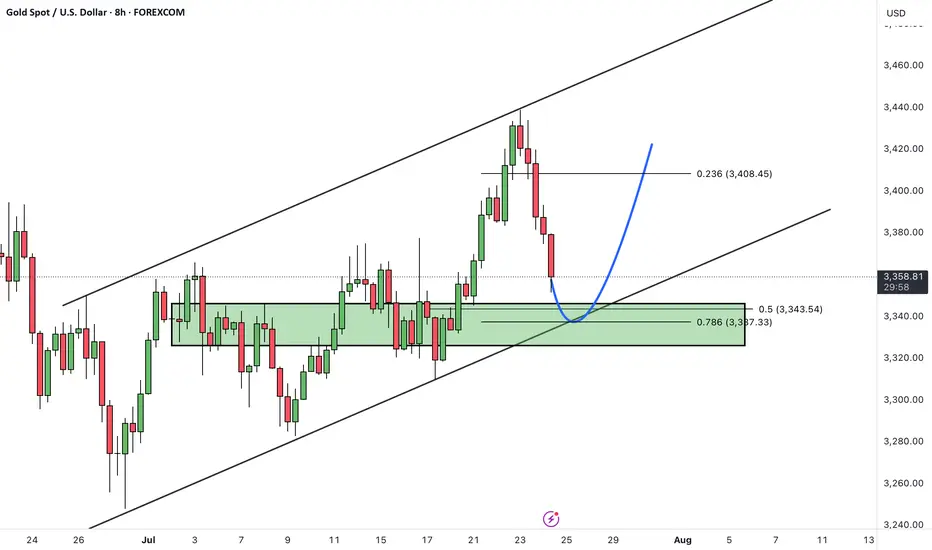
GOLD 30min Buy Setup (High Risk - High Reward)📍 TVC:GOLD 30min Buy Setup – MJTrading View
After an extended bearish leg, price has tapped into a strong support zone that previously acted as a launchpad. Also touching the main Uptrend...
We now see initial signs of absorption with potential reversal setup forming just above the ascending trendline.
🔹 Entry Zone: 3344–3346
🔹 SL: Below 3335 (under structure & wick base)
🔹 TP1: 3355
🔹 TP2: 3365
🔹 TP4: 3385+ (if momentum sustains)
🔸 RR: Up to 1:4 depending on target selected
🧠 Context:
– Still inside broader bullish structure (macro HL)
– Support zone coincides with rising trendline
– Potential for bullish reaccumulation after sharp drop
– Volume spike near zone suggests active buyers
Stay sharp and manage your risk please...
See the below Idea for full concept:
"Support isn't just a level — it’s a battlefield. If buyers win, they don’t look back."
#MJTrading #Gold #BuySetup #PriceAction #SmartMoney #ChartDesigner #ReversalSetup #MarketStructure
Psychology Always Matters:
ETHUSD: Road to 4K today after a breakout. ETH/USD – 4H Outlook: Targeting $4,000+
Ethereum is coiling within a descending wedge, signaling potential breakout momentum. Volume compression indicates that once ETH breaks above the wedge resistance (~$3,750), it could accelerate toward the $4,000–$4,050 supply zone.
Key Levels:
Resistance: $3,750 → $4,000
Support: $3,650 → $3,550
Breakout Target: $4,007 (mid-term)
VolanX Protocol Insight:
Institutional liquidity clusters sit above $3,800. A clean breakout with strong volume could trigger stop runs and a swift rally to 4K.
Risk Management:
Entry after breakout retest above $3,750.
Stop-loss: Below $3,640.
Take-profit: $3,980–$4,050.


PIUSDT Time is NOW - BullishWe saw change of character.
i think It is now time to get in.
good luck to all!
Report - 25 jully, 2025U.S.–EU Tariff Negotiations Stabilizing Markets
Reports confirm the U.S. and EU are nearing a deal for 15% reciprocal tariffs—lower than the initially threatened 30% by President Trump. This easing of tensions led to moderate equity gains in both blocs, with the Stoxx 600 reaching a 6-week high before closing +0.2%. Pharmaceutical and auto stocks outperformed (Volkswagen +2.3%, Bayer +2.3%).
Forecast: If the 15% deal is finalized by the August 1 deadline, it would remove a key overhang on equities and boost cyclical sectors reliant on transatlantic trade. A failure, however, risks escalation, triggering retaliatory tariffs by the EU on $93bn of U.S. goods, dragging risk assets sharply lower.
DXY Outlook: Tariff de-escalation boosts safe-haven flows and investor optimism, supporting USD strength.
S&P 500: Short-term relief rally expected if the 15% tariff framework is signed. However, margin compression risks remain from lingering supply chain disruptions.
Tesla vs Trump: Policy Shock Rattles EV Sector
Elon Musk warned that Trump's anti-EV stance and trade war posture will sharply erode Tesla’s regulatory credit revenue and remove the $7,500 EV tax credit. Tesla's stock has cratered 37% since December, with a sharp 8% drop yesterday. Adjusted Q2 net income was down 22%, revenue -12%.
Risk Forecast: Loss of EV subsidies + political fallout between Musk and Trump could drag Tesla further and dampen broader EV sector growth.
XAUUSD: Rising political uncertainty and risks to the U.S. tech sector may drive safe-haven flows into gold.
Dow Jones: Tesla's underperformance and anti-EV policies could limit industrial sector gains.
ECB Holds Rates Amid Trade Risk Fog
The European Central Bank paused its easing cycle, holding the benchmark rate at 2%. Lagarde emphasized a "wait-and-watch" stance, signaling uncertainty due to unresolved trade talks and tariff volatility.
Market Implication: Eurozone government bond yields rose (10Y Bund at 2.70%), paring rate-cut bets. The euro softened to $1.1760.
EURUSD: Lack of further ECB accommodation and weaker consumer confidence amid trade frictions.
Fed Independence in Jeopardy? Market Confidence Wobbles
Pimco warned that White House pressure on Fed Chair Powell—including potential firing and scrutiny over $2.5bn HQ renovations—could destabilize markets. Trump continues pushing for aggressive 1% rates, diverging from current 4.25–4.5% levels.
Fiscal/Political Implication: Undermining Fed autonomy risks flight from U.S. bonds, undermining monetary policy credibility and capital inflows.
USDJPY: Yen may gain if markets lose faith in U.S. institutional integrity, despite rate differentials.
DXY: Temporary support from yields, but structural downside if Fed credibility erodes.
Deutsche Bank and BNP: Diverging Strengths in Volatile Landscape
Deutsche Bank posted its strongest Q2 in 18 years, driven by litigation charge reversals and stable investment banking performance. BNP Paribas also reported solid FICC trading (+27%), though equity trading lagged due to weak derivatives demand.
Equity Implication: Strong capital returns and stable European banking profitability support DAX resilience amid trade noise.
DAX: Boosted by banking and auto outperformance.
China–EU Trade Strains Escalate
Von der Leyen directly confronted Xi Jinping over trade imbalances and support for Russia. EU exports to China are down 6% YoY while Chinese imports to the EU are up 7%. Xi defended Beijing’s stance, warning against "decoupling" rhetoric.
Geostrategic Implication: EU may escalate anti-dumping and export control measures. Markets may see renewed volatility in European industrials and luxury sectors reliant on China.
XAUUSD: Rebalancing of power and heightened East–West tensions favor gold.
Oil Oversupply Warning from TotalEnergies
Total warned of an oil glut due to OPEC+ production increases and weakening global demand. Q2 profits fell 30% YoY. Brent now likely to stay within $60–70 range barring major geopolitical flare-ups.
Crude Oil: Short- to medium-term downside risk with soft demand and oversupply fears.
Energy Stocks: Dividend maintenance remains but debt levels and margin pressures may weigh.
AI Spending Surges – Alphabet and SK Hynix
Alphabet posted a 19% Q2 profit jump as AI integration boosts search volumes. Google’s cloud revenues rose 32%. Capex raised to $85bn. SK Hynix also posted record revenues from high-bandwidth memory chip sales, extending its lead over Samsung.
S&P 500: AI-driven earnings upside bolsters tech sector. Expect multiple expansion in mega-cap AI-exposed names.
XAUUSD : Robust AI investment supports risk appetite but inflationary fears could lift gold marginally.

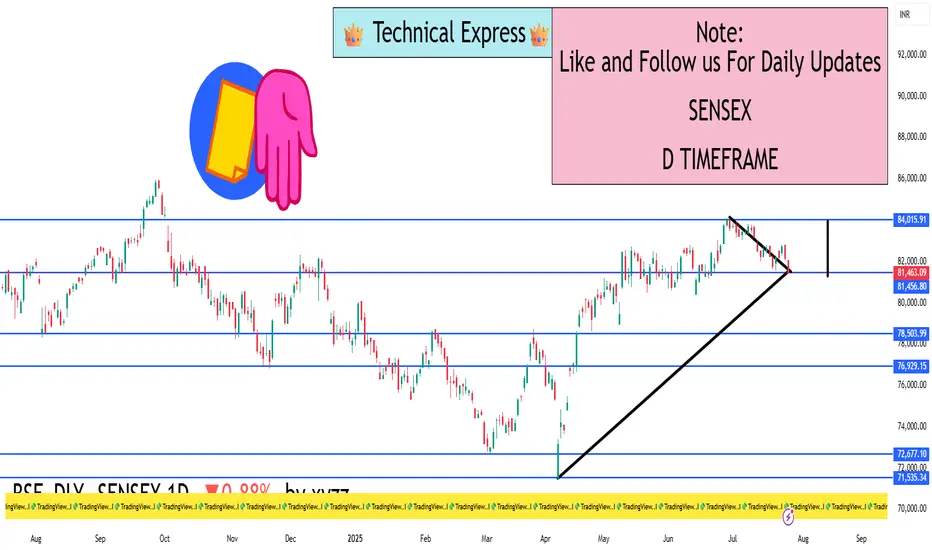
SENSEX 1D Timeframe📉 SENSEX Daily Overview (as of July 25, 2025)
Current Price: Around 81,460
Daily Change: Down by approximately 720 points (–0.9%)
Day’s High: About 82,070
Day’s Low: About 81,400
Previous Close: Around 82,184
📊 1-Day Candlestick Analysis
The candle for today is bearish, indicating strong selling pressure.
The price opened near previous levels but faced resistance at around 82,000.
Sellers dominated most of the day, pushing the index toward the 81,400 support zone.
🔍 Key Support and Resistance Levels
Level Type Price Range
Resistance 82,000 – 82,200
Support 81,400 – 81,000
If Sensex breaks below 81,400, the next target could be around 80,500 or 79,900.
If it holds above support and bounces, it could retest 82,200.
🧠 Technical Trend Analysis
Short-Term Trend: Bearish
Medium-Term Trend: Neutral to mildly bullish (as long as above 80,000)
Market Structure: Lower highs forming, suggesting pressure building on bulls
Indicators (assumed):
RSI may be approaching oversold
MACD likely showing bearish crossover
Volume increasing on red candles—indicating strong sell interest
📌 Sentiment & Market Context
Financial stocks (like banking, NBFCs) are under pressure.
Global cues (such as interest rate uncertainty and geopolitical concerns) are impacting investor confidence.
FII outflows and weak earnings in key sectors are adding to bearish momentum.
The broader trend remains range-bound, but with short-term downside bias.
✅ Strategy Suggestions (For Traders & Investors)
Swing Traders: Wait for a reversal candle (like a bullish engulfing or hammer) before considering long positions.
Breakout Traders: Watch for breakdown below 81,000 for continuation of the fall.
Positional Traders: Can wait to enter near 80,000–79,500 if the market holds that key level.
🔄 Summary
SENSEX is under pressure with a drop of 720+ points.
Technical structure suggests caution, especially if 81,000 breaks.
Support: 81,000 – 80,500
Resistance: 82,000 – 82,200

Gold – Bear-to-Bull Transition in Motion?🧠 MJTrading:
TVC:GOLD – 8H Chart: Bulls, It’s Your Move.
📸 Viewing Tip:
🛠️ Some layout elements may shift depending on your screen size.
🔗 View the fixed high-resolution chart here:
The impulsive move from 3000 to 3500 wasn’t just a trend — it was a statement of strength.
That rally carved the ATH, then left behind weeks of digestion and structural compression.
Now, the market may be setting up for its next decision.
Notice how each bearish leg has been shrinking — a classic behavioral signal that sellers are losing momentum — possibly a shift in control underway.
We’re also pressing above the downtrend line from the ATH (3500), while the uptrend from 3000 remains clean and respected.
We’re now testing the 3400 zone — a key battleground.
📍 If bulls want to reclaim the momentum and show dominance, this is the moment to act.
🔹 1st Support: 3363–3377
🔹 2nd Support: Rising trendline
🎯 Target Zone: 3455–3500+ (Liquidity Pool & ATH proximity)
⚠️ Break back inside the triangle could delay the breakout narrative.
⚠️ If momentum fails to increase from here, and bulls can’t break out with conviction, the market is likely to remain range-bound for longer — extending the sideways phase between 3250–3500.
💭 If you’re watching for a new ATH… stay sharp, stay structured — the market rewards patience and readiness.
“If the structure speaks to you, let it echo, boost it.”
📐 MJTrading 🚀
What do you think?
#GoldAnalysis #XAUUSD #MarketStructure #LiquiditySweep #AnythingCanHappen
#MJTrading
#ChartDesigner
Psychology Always Matters:
Click on them for the caption...

EURAUD is currently showing signs of a bearishEURAUD is currently showing signs of a bearish trend continuation. Despite short-term upward movement driven by optimism around the ECB, the overall structure remains vulnerable to downside pressure.
The European Central Bank (ECB) is expected to keep interest rates unchanged, potentially ending a seven-year streak of cuts. While this could bring temporary strength to the Euro, the technical setup still favours the bears.
Watch for a Break Below the Neckline
If price manages to break below the neckline of the current pattern, it could trigger a strong bearish move. First support: 1.77100 Second support: 1.76300
You May find more details in the chart.
Ps: Support with like and comments for more analysis.
GBPUSD | Bullish Reversal Setup GBPUSD | Bullish Reversal Setup
Price tapped into previous demand zone after forming a clear BOS (Break of Structure). Anticipating a bullish move towards 1.36800.
Entry at key support with a clean RR. Watching closely for momentum confirmation.
#GBPUSD #SmartMoney #ForexTrading #PriceAction #EranseCapital

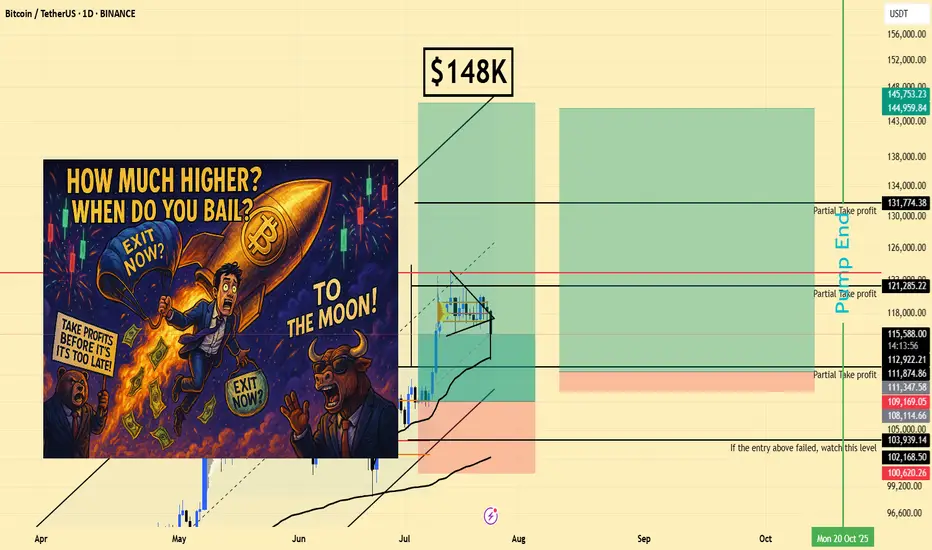
BTCUSD | Long | Volume Confirmation (Jul 25, 2025)BTCUSD | Long | Breakout Momentum & Volume Confirmation (Jul 25, 2025)
1️⃣ Quick Insight:
Bitcoin is showing strong bullish momentum after breaking out of its triangle pattern with volume. The move looks set to continue, and we may see higher levels if momentum holds.
2️⃣ Trade Parameters:
Bias: Long
Stop Loss: $109k (risk-adjusted "invisible" stop)
TP1: $121k (partial take profit)
TP2: $131k (final target if momentum extends)
3️⃣ Key Notes:
Short-term, price could test $96k before reaching higher targets.
Longer-term outlook points to potential upside between $112k–$120k if structure holds.
Watching reaction closely around the $109k area as it will determine if the uptrend stays intact.
I expect the pump phase to potentially wrap up around October 20, 2025.
S&P 500 is also at key levels, and its direction could influence Bitcoin’s momentum.
💬 What are your targets for Bitcoin? 140k? 180k? 240k? Drop your thoughts below!
"Please LIKE 👍, FOLLOW ✅, SHARE 🙌 and COMMENT ✍ if you enjoy this idea! Also share your ideas and charts in the comments section below! This is best way to keep it relevant, support us, keep the content here free and allow the idea to reach as many people as possible."
Disclaimer: This is not financial advice. Always do your own research. This content may include enhancements made using AI.