Understanding ROI in Crypto: More Than Just a NumberHello, Traders! 👏
Return on Investment (ROI) is often the first metric new investors focus on when evaluating an asset, a strategy, or even their trading performance. It’s easy to see why. It's simple, intuitive, and widely used across both traditional finance and the cryptocurrency sector. One formula, and suddenly you have a "score" for your investment. Green is good. Red is bad. Right?
Well…Not quite.
In the crypto market, where price swings can be extreme, timelines are compressed, and risk profiles differ significantly from those in traditional markets, a simplistic ROI figure can be dangerously misleading.
A 50% ROI on a meme coin might look great, until you realize the token is illiquid, unbacked, and you're the last one holding the bag. Conversely, a 10% ROI on a blue-chip crypto asset with strong fundamentals might be significantly more meaningful in risk-adjusted terms.
In this article, we'll delve beyond the basic formula and break down what ROI really tells you, how to use it correctly, and where it falls short. Let's go!
What Is ROI and How Do You Calculate It?
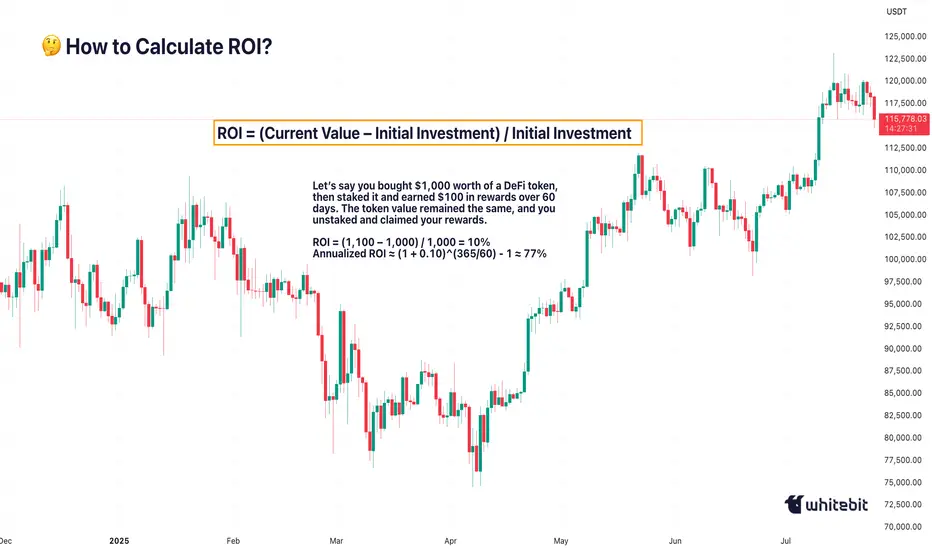
The Basic Formula for Return on Investment Is: ROI = (Current Value – Initial Investment) / Initial Investment.
Let’s say you bought ETH at $2,000 and sold it at $2,600: ROI = (2,600 – 2,000) / 2,000 = 0.3 → 30%. Seems straightforward. You made 30% profit. However, crypto is rarely straightforward.
What if you held it for 2 years? Or 2 days? What if gas fees, staking rewards, or exchange commissions altered your real costs or returns? Did you include opportunity cost and the profits missed by not holding another asset? ROI as a raw percentage is just the beginning. It’s a snapshot. However, in trading, we need motion pictures, full narratives that unfold over time and within context.
Why Time Matters (And ROI Ignores It)
One of the most dangerous omissions in ROI is time.
Imagine two trades: Trade A returns 20% in 6 months. Trade B returns 20% in 6 days.
Same ROI, very different implications. Time is capital. In crypto, it’s compressed capital — markets move fast, and holding a position longer often increases exposure to systemic or market risks.
That’s why serious traders consider Annualized ROI or utilize metrics like CAGR (Compound Annual Growth Rate) when comparing multi-asset strategies or evaluating long-term performance.
Example: Buying a Token, Earning a Yield
Let’s say you bought $1,000 worth of a DeFi token, then staked it and earned $100 in rewards over 60 days. The token value remained the same, and you unstaked and claimed your rewards.
ROI = (1,100 – 1,000) / 1,000 = 10%
Annualized ROI ≈ (1 + 0.10)^(365/60) - 1 ≈ 77%
Now that 10% looks very different when annualized. But is it sustainable? That brings us to the next point…
ROI Without Risk Analysis Is Useless
ROI is often treated like a performance badge. But without risk-adjusted context, it tells you nothing about how safe or smart the investment was. Would you rather: Gain 15% ROI on a stablecoin vault with low volatility, or Gain 30% ROI on a microcap meme token that could drop 90% tomorrow?
Traders use metrics such as the Sharpe Ratio (which measures returns versus volatility), Maximum Drawdown (the Peak-to-Trough Loss During a Trade), and Sortino Ratio (which measures returns versus downside risk). These offer a more complete picture of whether the return was worth the risk. ⚠️ High ROI isn’t impressive if your capital was at risk of total wipeout.
The Cost Side of the Equation
Beginners often ignore costs in their ROI math. But crypto isn’t free: Gas fees on Ethereum, trading commissions, slippage on low-liquidity assets, impermanent loss in LP tokens, maybe even tax obligations. Let’s say you made a 20% ROI on a trade, but you paid 3% in fees, 5% in taxes, and lost 2% in slippage. Your actual return is likely to be closer to 10% or less. Always subtract total costs from your gains before celebrating that ROI screenshot on X.
Final Thoughts: ROI Is a Tool, Not a Compass
ROI is beneficial, but not omniscient. It’s a speedometer, not a GPS. You can use it to reflect on past trades, model future ones, and communicate performance to others, but don’t treat it like gospel.
The real ROI of any strategy must also factor in time, risk, capital efficiency, emotional stability, and your long-term goals. Without those, you’re not investing. You’re gambling with better math. What do you think? 🤓
Beyond Technical Analysis
15.40This channel is not providing individualized trading or investment advice, nor is it a banking service, brokerage service, trading service, investment service or money management service

XAUUSD buy ideajust a simple TA on xauusd
we are in a small up trend and may would be a good price to buy
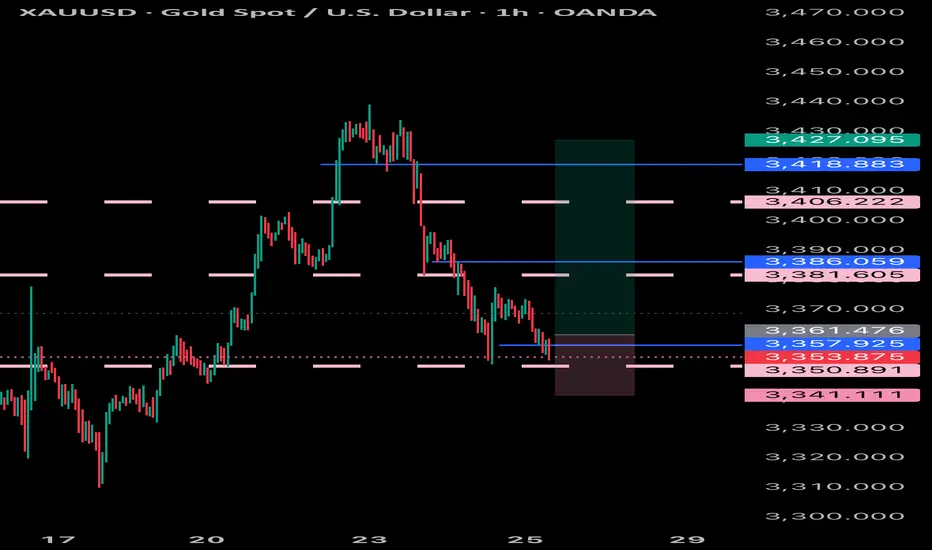
GBPUSD Support & Resistance Levels🚀 Here are some key zones I've identified on the H1/M15/M5 timeframe.
These zones are based on real-time data analysis performed by a custom software I personally developed.
The tool is designed to scan the market continuously and highlight potential areas of interest based on price action behavior and volume dynamics.
Your feedback is welcome!

UniCredit: One Step Away from 30% in Alpha Bankhe relationship between UniCredit and Alpha Bank is reaching a turning point, as all indications suggest the Italian banking giant is accelerating its push to acquire more than 30% of the Greek systemic lender. If confirmed, the move would not only make UniCredit the dominant shareholder but also allow it to fully consolidate Alpha’s earnings under IFRS standards.
After acquiring the stake held by Dutch investor Rob Holterman, UniCredit brought its holding close to 20%. Following stalled merger talks with Germany’s Commerzbank and Italy’s Banco BPM, attention has now firmly shifted to Greece. Athens is becoming a strategic hub, and Alpha Bank the key growth vehicle.
The timing aligns with UniCredit’s record Q2 2025 profits (+25%), supported by strong liquidity and capital. Behind-the-scenes efforts are reportedly underway, potentially involving secondary market purchases or private deals with current shareholders.
Technical Analysis
Alpha Bank’s stock (ATHEX: ALPHA) trades at €3.186, currently in a corrective phase after completing a strong five-wave bullish cycle peaking at €3.384. A clear A-B-C retracement has followed, with support emerging near €3.17, confirmed by high-volume buying. The stock faces key resistances at €3.245 and €3.28 (Fibonacci 0.382 & 0.5 levels), which it must reclaim to reverse the short-term downtrend. Failing that, a break below €3.17 could trigger further downside. Market structure shifts (CHoCH, BoS) suggest high sensitivity to any new buying pressure. Investor sentiment around UniCredit’s strategic intentions may be the catalyst for the next major move.

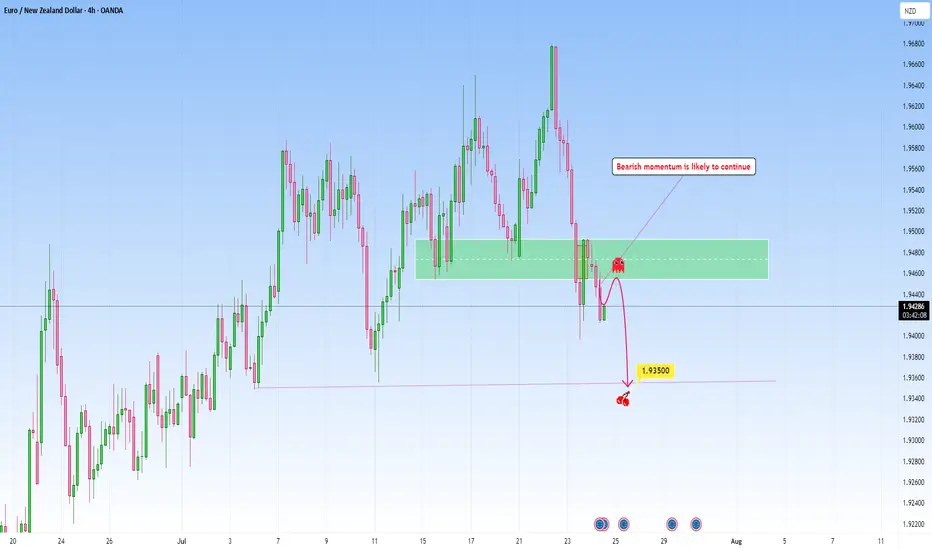
EURNZD Continuation setup following recent bearish momentumThe market has recently pushed down with momentum.
Price attempted a timid "echo bounce" back into the broken support but was rejected, confirming this area now serves as area for bearish re-entries.
From what I can tell, we're entering the next leg of what I call the “Gravity Spiral Phase”, where sellers take over after taking a clear zone. Each wave down is not just a move, but a continuation of momentum migration into new bearish move.
Target: 1.93500
This level marks the next gravity anchor, a zone where price memory may attempt to stabilize, but only temporarily.
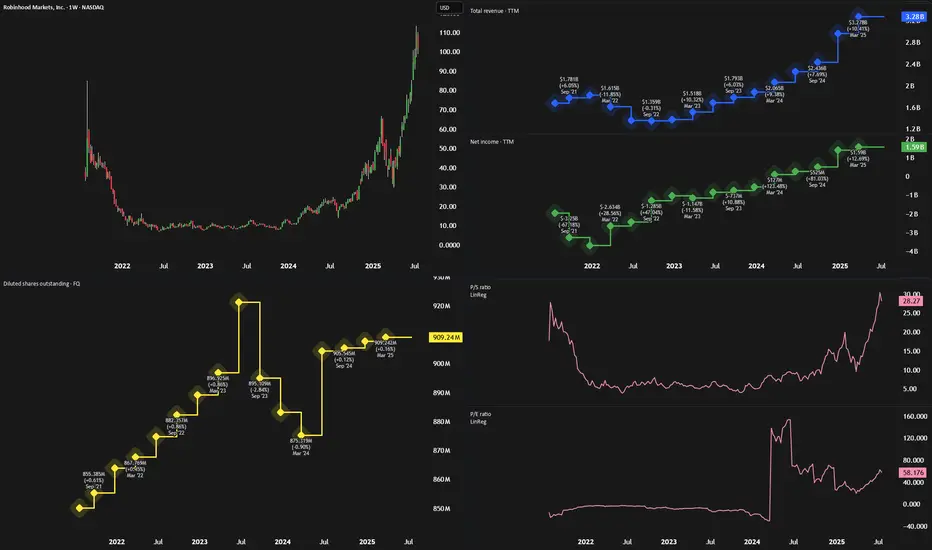
Everyone's Bullish On Robinhood - But Its Time To SellRobinhood NASDAQ:HOOD has seen an incredible rally over the past year, rising more than 500% since August 2023. Much of this surge has been driven by renewed crypto enthusiasm—sparked by Circle’s IPO—and Robinhood’s aggressive push into new products across fintech and crypto.
But despite strong financial performance, we now believe the stock has run too far, too fast.
💰 Strong Fundamentals, But Slowing Growth
Robinhood’s recent financials are undeniably impressive:
Trailing 12-month revenue: $3.27B (up ~60% YoY)
Net income: $1.59B
Operating income: $1.2B
Revenue from commissions and interest income has outpaced expenses, resulting in high margins. But looking ahead, earnings-per-share (EPS) growth is expected to slow. Analysts forecast mid-teens EPS growth in 2026 and 2027, with a potential dip this year as one-time tax benefits roll off.
Robinhood Gold, the company’s premium service, is growing steadily (ARR projected to top $250M this year), but it’s still a small slice of total revenue.
🛠️ Product Expansion or Strategy Drift?
Robinhood is launching a wide array of new offerings—from robo-advisors and AI tools to crypto products in Europe and futures trading in the U.S.
The issue? These launches feel disjointed. U.S. users get a full-featured experience with stocks, options, crypto, and banking tools. UK users are limited to U.S. stock trading, with balances held in USD. In Europe, Robinhood leans heavily into crypto.
While the company claims it’s building a “global financial ecosystem,” the rollout has been inconsistent and confusing. This scattered approach may dilute brand clarity and user trust.
📊 Valuation: Sky-High and Hard to Justify
At current prices, HOOD trades at:
26x revenue
54x trailing earnings
74x forward earnings
At over 45x FY3 earnings, higher than fintech peers like SoFi (29x), Etoro (20x), and Interactive Brokers (27x)
The only comparable valuation is Coinbase (COIN), which has a more dominant position in crypto and stronger institutional traction. Given that most of HOOD’s revenue still comes from traditional brokerage services, this crypto-fueled valuation seems overblown.
🚨 Bottom Line
Robinhood remains a promising long-term company, but its stock looks overheated. Slowing earnings growth, a scattered international strategy, and a sky-high valuation point to limited upside from here.
Verdict: Sell
Investors sitting on big gains may want to take some profits while the euphoria lasts.
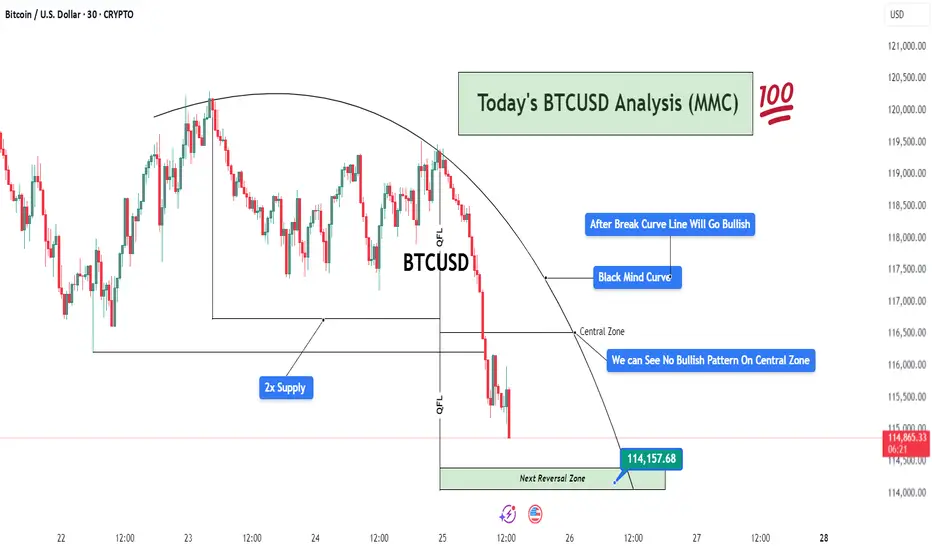
BTCUSD Analysis (MMC) – Bearish Flow Toward Reversal ZoneThis 30-minute BTCUSD chart highlights a well-structured bearish movement following the MMC (Mirror Market Concepts) framework. The analysis centers around the Black Mind Curve, multiple QFL drops, and supply/demand imbalances, presenting a professional outlook on current price action and potential reversals.
🧠 Black Mind Curve – Mapping Market Psychology
The Black Mind Curve is a visual representation of the market’s psychological behavior and serves as a dynamic resistance throughout this structure. Price respected the curvature, slowly losing bullish strength while forming lower highs.
This curve mirrors a distribution phase, where smart money unloads long positions before initiating a downside move.
Your annotation: “After Break Curve Line Will Go Bullish” implies that unless the curve is cleanly broken with strong bullish conviction, the bias remains bearish.
So far, the price is respecting the curve, reinforcing sellers’ control.
🔵 2x Supply Zone – Aggressive Selling Region
The supply zone is tested twice, confirming the presence of institutional-level sellers. This zone becomes critical because:
First touch: Minor reaction, but no follow-through.
Second touch: Strong rejection with extended downside move.
The double rejection clearly shows that buyers are trapped, fueling bearish momentum.
From an MMC view, this confirms the beginning of the “Mirror Market Shift” — where smart money rotates out of longs and traps retail longs near resistance.
📉 QFL (Quick Flip Liquidity) Events – Momentum Crashes
Two major QFL-based breakdowns appear in the chart after price consolidated within ranges. These drops are essential to understand:
QFL reflects market structure breaks where liquidity is engineered, and a sharp sell-off follows.
The first QFL drop occurs after the curve-resistance rejection, and the second confirms continuation.
These are liquidity runs, used to clear stop-losses and maintain bearish pressure.
This creates a domino effect — each QFL level becomes a signal of deeper imbalance.
⚠️ Central Zone – No Bullish Pattern Detected
The Central Zone marks a temporary support or midpoint level — a place where price might find footing if buyers show up.
However, as you noted:
“We Can See No Bullish Pattern On Central Zone”
No bullish engulfing candle.
No pin bar rejection.
No spike in volume.
No market structure shift.
This confirms that buyers are either weak or absent in this zone. MMC traders use this info to stay with the dominant trend (bearish) until proven otherwise.
🟩 Next Reversal Zone – 114,157.68 (Critical Demand Zone)
The green zone marked as “Next Reversal Zone” is a key level to monitor:
This area aligns with historical demand, where BTC previously reversed or slowed down.
Price is likely to hunt liquidity below recent lows before a potential bullish reaction.
It’s a Smart Money zone — designed to trap breakout sellers and absorb volume for a reversal.
Traders should watch for:
Bullish engulfing patterns
Break of structure to the upside
Divergence with RSI/volume
Sweep and reclaim setup
Once the price enters this zone, MMC reversal tactics come into play — buyers may step in aggressively here.
📅 Fundamentals & Timing
At the bottom of the chart, we see upcoming U.S. economic news events, which can act as volatility catalysts. Price could reach the reversal zone just before or during high-impact news, which aligns perfectly with smart money manipulation.
Be cautious of fakeouts around news time.
Confirmation is key before entry.
🧭 Final Outlook & MMC Strategy
Trend Direction: Bearish until 114,157.68 zone is hit.
Momentum Drivers: QFL drops, strong rejection from 2x supply, absence of bullish signals.
Key Watch Level: 114,157.68 – wait for MMC reversal pattern here.
Invalidation: If price breaks and closes above the Black Mind Curve with volume.
📌 Trade Idea Summary (For Caption Use):
BTCUSD respecting MMC Black Mind Curve. 2x Supply Zone triggered QFL breakdowns. No bullish confirmation at Central Zone. Eyes on Next Reversal Block near 114,157.68. Watch for reaction and potential reversal setup. #SmartMoneyMoves
GOLD XAUUSD BUY We shall be looking to scalp a bit on the gold as it has been selling for a while now and can expect a reversal as nothing sells forever in the market, so can buy a dip and expect it to push a fair amount
BTCUSD BUYING can expect a bullish move from bitcoin as it has dropped a fair amount and can extract a reversal to the up side due to being oversold
EUR GBP: Long EUR GBP long 'relative fundamental' trade, based on the fairly 'hawkish' ECB and also today's and yesterday's 'soft' UK data. Entry 0.8712
The risk to the trade is the fact the stop loss is not behind a solid 'upswing of note'. But this is the only moment I have to potentially trade today and I think it's worth a go.
I do think a 'risk on' trade is also viable (which is also a risk if the GBP strengthens in a positive environment). But I've chosen to go with the 'freshness' of the UK data.
EUR GBP has a low ATR, the trade has a 10 pip stop loss and 15 pip profit target.
If it's ongoing, I will close the trade before end of day to avoid weekend risk.

Cutting-edge Tech, Outperforming Traditional Tools Until now my AI has been defying market odds
The forecasts work on all timeframes, short, medium or long range
My AI is outperforming traditional tools, in real time, thats right...with real time validation
The question is, will the crown remain intact or be dethroned??

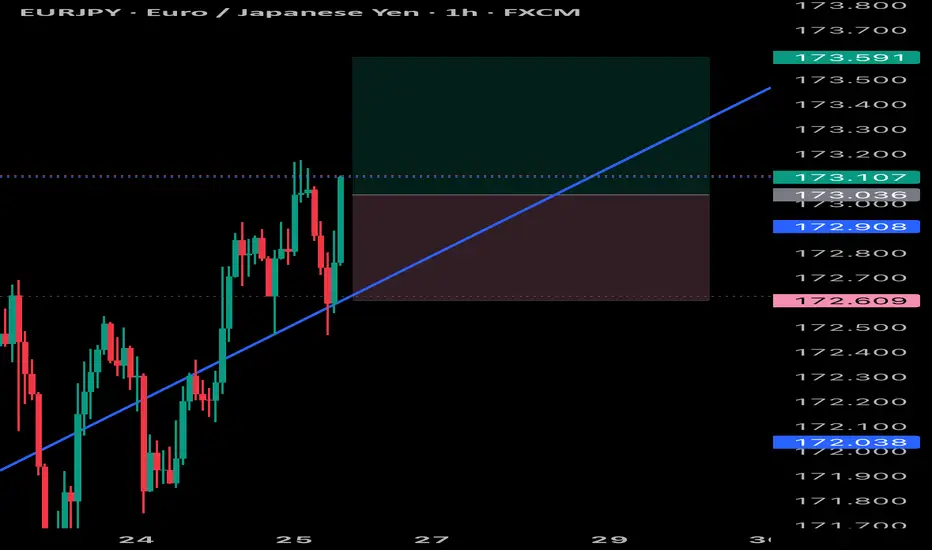
EURJPY BULLS Bullish move from Eurjpy and will keep following it, to its very top with small pullbacks coming but stay prepared can put buy stops
bitcoin, Stay heavy on positionsbitcoin, Stay heavy on positions
Short-term overbought is noise. Focus on the bigger picture. Keeping my position heavy—no plans to reduce yet

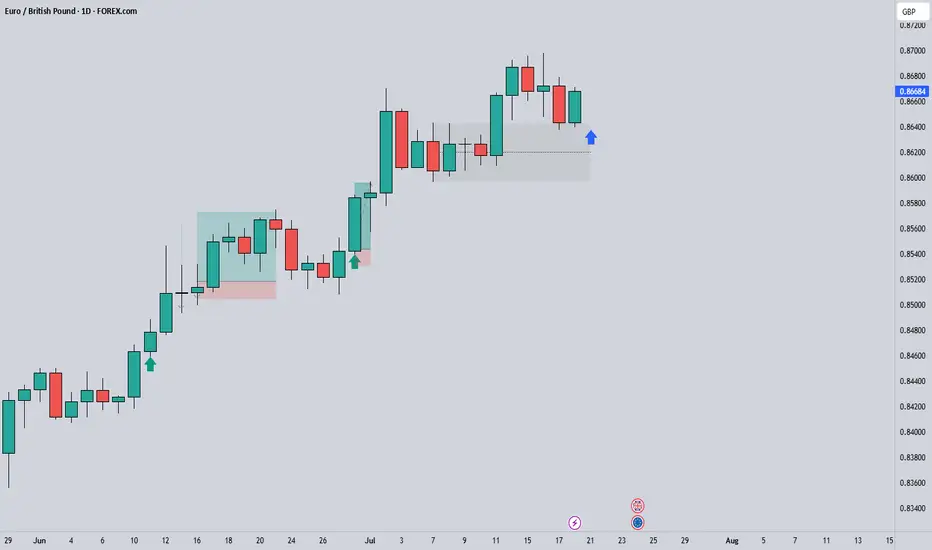
EURGBP Long Project1. Price Drivers: higher timeframe demand
2. Current Trend: up
3. Momentum: bullish
Action: Waiting for entry on the intraday timeframe (entry will be published further)
*Disclaimer: I will not accept liability for any loss or damage, including without limitation to any loss of profit, which may arise directly or indirectly from use of or reliance on such information.
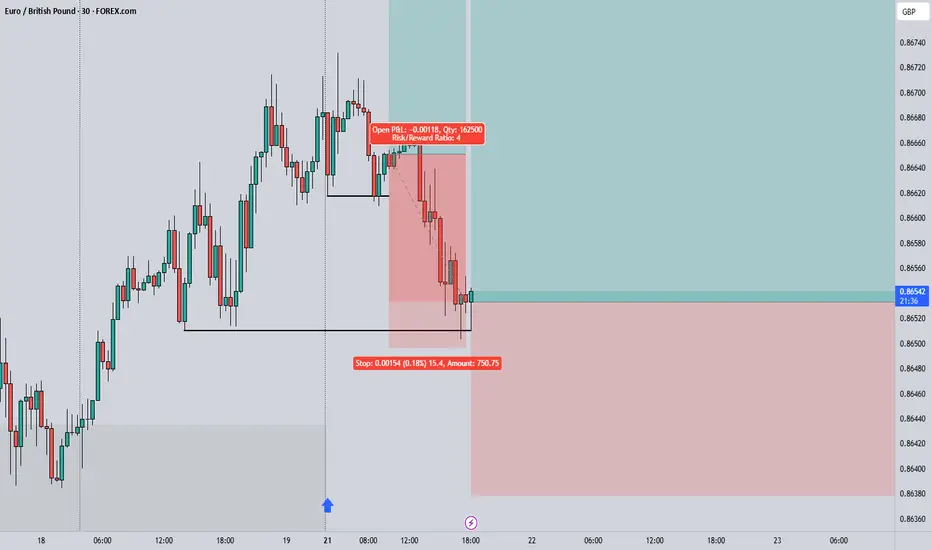
EURGBP 2nd Buy EntryEntry: 0.86533
Stop Loss (R): 0.86379
Take Profit (4R): 0.87149
*Disclaimer: I will not accept liability for any loss or damage, including without limitation to any loss of profit, which may arise directly or indirectly from use of or reliance on such information.
Trap Set at the Top? Sensex Sell-Side Objective = 81,886Sensex is currently trading at 82,220 and showing early signs of a potential sell-side move based on Smart Money dynamics. After grabbing buy-side liquidity above recent highs, we’ve now entered a distribution phase.
Price has shown rejection from a premium zone, and a market structure shift is forming on lower timeframes — all pointing toward a probable move to the sell-side liquidity pool near 81,886.
This zone aligns with Smart Money's objective to tap resting liquidity below recent swing lows before any major reversal. Caution is advised for longs. Wait for confirmation if you're planning to ride the short move with the institutions. 🎯💼

Can the S&P 500's Ascent Continue?The S&P 500 recently achieved unprecedented highs, reflecting a multifaceted market surge. This remarkable performance stems primarily from a robust corporate earnings season. A significant majority of S&P 500 companies surpassed earnings expectations, indicating strong underlying financial health. The Communication Services and Information Technology sectors, in particular, demonstrated impressive growth, reinforcing investor confidence in the broader market's strength.
Geopolitical and geostrategic developments have also played a crucial role in bolstering market sentiment. Recent "massive" trade agreements, notably with Japan and a framework deal with Indonesia, have introduced greater predictability and positive economic exchanges. These deals, characterized by reciprocal tariffs and substantial investment commitments, have eased global trade tensions and fostered a more stable international economic environment, directly contributing to market optimism. Ongoing progress in trade discussions with the European Union further supports this positive trend.
Furthermore, resilient macroeconomic indicators underscore the market's upward trajectory. Despite a recent dip in existing home sales, key data points like stable interest rates, decreasing unemployment claims, and a rising manufacturing PMI collectively suggest an enduring economic strength. While technology and high-tech sectors, driven by AI advancements and strong earnings from industry leaders like Alphabet, remain primary growth engines, some segments, such as auto-related chipmakers, face challenges.
The S&P 500's climb is a testament to the powerful confluence of strong corporate performance, favorable geopolitical shifts, and a resilient economic backdrop. While the immediate rally wasn't directly driven by recent cybersecurity events, scientific breakthroughs, or patent analyses, these factors remain critical for long-term market stability and innovation. Investors continue to monitor these evolving dynamics to gauge the sustainability of the current market momentum.

AUDJPY: Bullish Structure Shift Signals Institutional Buy ZoneGreetings Traders,
In today’s analysis of AUDJPY, we observe a recent bullish market structure shift (MSS), signaling potential for continued upward movement. With this in mind, we aim to capitalize on buying opportunities at key institutional points of interest to target higher premium prices.
Higher Timeframe Context:
The weekly timeframe maintains a clear bullish narrative. This long-term bias is now supported by a bullish MSS on the H4 timeframe, offering strong confluence and alignment across both macro and intermediate structures. This increases our confidence in expecting further bullish continuation.
Key Observations on H4:
Weekly Fair Value Gap (FVG) Support: Price recently pulled back into a weekly FVG and has rebalanced that inefficiency. This reaction aligns with the H4 MSS, reinforcing the weekly FVG as a strong institutional support zone.
Reclaimed Bullish Order Block: After the MSS, price retraced into a bullish reclaimed order block—an area where previous institutional positioning occurred. Since price has now reclaimed this level, it becomes a high-probability zone for renewed buying interest in the direction of the dominant trend.
Lower Timeframe Confirmation: This reclaimed order block will serve as our primary zone of interest to seek confirmations on the lower timeframes for precise entries.
Trading Plan:
Entry Strategy: Wait for bullish confirmation within the reclaimed H4 order block zone before entering long positions.
Target: The primary objective is the H4 liquidity pool situated at premium prices, which the market is likely to be drawn toward.
For a detailed market walkthrough and in-depth execution zones, be sure to watch this week’s Forex Market Breakdown:
As always, execute with discipline and align your trade management with your overall plan.
Kind Regards,
The Architect 🏛️📈

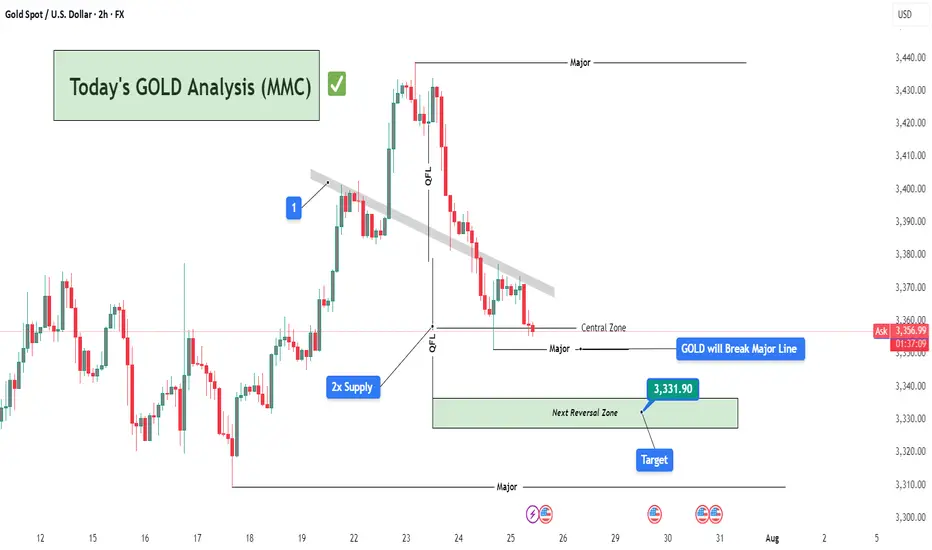
Today's GOLD Analysis (MMC) – Sell Bias Continues To Next TargetChart Overview:
This 2-hour GOLD (XAU/USD) chart showcases a clear bearish structure in line with the Mirror Market Concepts (MMC) methodology. Price action is respecting key supply zones and continues to reject significant levels, confirming the dominance of sellers in the short-term structure.
🔍 Key Technical Elements:
1️⃣ Break of Trendline (MMC QFL Entry Model)
The descending grey trendline marks consistent lower highs, showing clear bearish pressure. The breakout and rejections around this trendline zone (annotated “1”) confirm it as a strong supply area. This breakdown set the stage for a QFL (Quick Flip Liquidity) drop.
🧊 2x Supply Zone (High Confidence Rejection)
The 2x supply label highlights an area where price rapidly reversed with aggressive bearish momentum. This zone was tested and respected again, leading to further downside pressure, reinforcing the idea of institutional selling interest from that level.
📉 QFL Levels & Central Zone
Two major QFL drops are evident, where price broke previous demand structures and created new supply imbalance. The Central Zone currently acts as short-term support, but price is hovering just above it with weak bullish reaction, indicating potential for further breakdown.
🎯 Target & Reversal Zone – 3,331.90
The green zone below marks the Next Reversal Zone, with a highlighted price target at 3,331.90. This is where:
Previous liquidity was absorbed.
Demand imbalance may attract buyers again.
MMC reversal structures might be anticipated.
This zone aligns perfectly with the broader MMC concept of flipping between major zones and reversal blocks.
🧠 Trade Idea & Strategy (MMC Traders’ Minds)
Current Bias: Bearish
Entry Trigger: After rejection from trendline & 2x supply area.
Stop-Loss Suggestion: Above the trendline or recent supply wick (~3,375-3,380).
Take-Profit Zone: Primary TP at 3,331.90, with eyes on lower reversal targets if momentum persists.
Market Behavior: Controlled by sellers, liquidity sweeps seen, weak demand below Central Zone.
📌 Key Events to Watch
As marked at the bottom, major US news events are scheduled between July 30th and 31st, which could act as catalysts for price acceleration toward the reversal zone or cause sharp volatility. Plan accordingly.
🧭 Conclusion:
Gold is respecting bearish market structure under the MMC model. With clear QFL breakouts, rejection from 2x Supply, and weak bullish attempts near the Central Zone, this chart favors short setups targeting the 3,331.90 zone. MMC traders should monitor price action closely within the Reversal Zone for potential buy signals or trend continuation if sellers remain aggressive.
Ethereum gains momentum: SEC green light and Banks ShiftEthereum gains momentum: SEC green light and JPMorgan’s historic shift
By Ion Jauregui – Analyst at ActivTrades
Ethereum once again takes center stage in financial markets after a week full of positive signals: on one hand, the long-awaited clarification of its regulatory status by the SEC; on the other, the unexpected opening of JPMorgan to cryptocurrencies. All this in a context of growing institutional interest and corporate adoption.
Washington clears the path: ETH is a commodity
The chairman of the SEC, Paul Atkins, has resolved one of the biggest uncertainties in the crypto ecosystem: Ethereum will not be treated as a security, but as a commodity. In other words, it falls outside the scope of the SEC’s strictest regulations and is placed on the same level as bitcoin from a regulatory standpoint. This shift, which ends years of ambiguity, comes just as Ethereum spot ETFs begin to gain traction. On July 16 alone, these products recorded a net inflow of $726 million, reflecting strong demand from large investors. By way of explanation:
Security: A financial instrument representing a share in a company or a credit, such as a stock or bond. It is subject to financial market regulation (such as the SEC in the U.S.), especially regarding transparency, registration, and investor protection.
Commodity: A standardized tradable good, often raw, such as oil, gold... or bitcoin, according to regulators. It does not imply any ownership rights in a company and is not subject to the strict regulation applied to securities, but is instead overseen by other agencies like the CFTC.
JPMorgan breaks with the past and moves closer to cryptocurrencies
Jamie Dimon, CEO of JPMorgan and until recently a staunch critic of bitcoin, has made an unexpected move: the bank is studying the possibility of offering loans backed by cryptocurrencies like BTC and ETH. The system would allow clients to obtain liquidity in dollars without selling their crypto assets, by depositing them as collateral.
The bank would not directly custody these assets but would delegate that function to specialized providers such as Coinbase Custody. Although still in an exploratory phase, this represents a radical change in the relationship between big banking and the crypto world.
Trump Media, Western Union and Polymarket stoke the crypto narrative
It’s not just banks that are positioning themselves. Trump Media & Technology Group (TMTG) confirmed a $2 billion investment in bitcoin, making it the fifth publicly traded company with the largest BTC holdings in the world. The company is also preparing the launch of its own token on Truth Social, its social network.
Meanwhile, Western Union is exploring the use of stablecoins to improve the efficiency of international transfers, while Polymarket is studying the launch of its own stablecoin or a partnership with Circle (USDC). All this is happening after the recent approval of the GENIUS Act, which for the first time regulates these types of assets in the U.S.
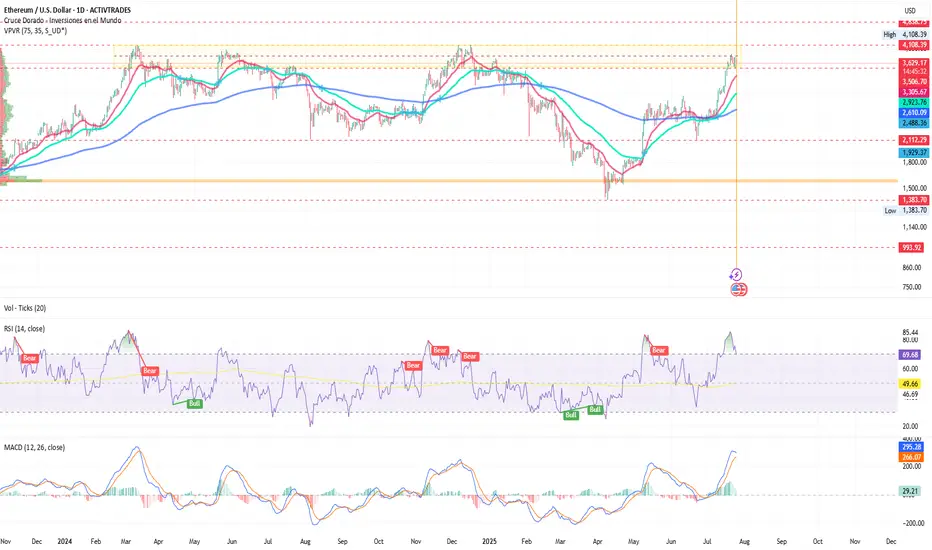
ETH/USD analysis: Beginning of a new bullish phase?
On the charts, Ethereum has responded to the macro and political environment with sustained recovery since April, entering a partial consolidation phase during several months this year. After holding the support level around $2,579, and since the golden cross on the 10th of this month, it has consolidated a price expansion leading it to test a new consolidation zone around $3,500. ETH now aims for more ambitious levels that could push the commodity towards recent highs of $3,857.67 and potentially break through to $4,000.
Currently, the price is within a range it has tested for the fourth time. If it fails to break out, we could see a pullback towards $2,700 or even a return to previous supports at $2,112 and the long-term point of control at $1,586.
Key support: $2,579
Immediate resistance: $3,857.67 (recent highs)
Target zone: $3,850 – $4,000 if a clean breakout occurs
Danger zone: Below $2,880, bearish pressure could return
Ethereum ready to make the leap
With the SEC’s legal backing, a recent surge in volume, the rise of spot ETFs, and the shift in traditional banking led by JPMorgan, Ethereum is cementing its role as a strategic asset in the new financial era, ready to lead the next phase of crypto adoption. This time, with Wall Street watching closely. Ethereum appears ready to play a leading role in the next stage of integration between traditional and digital finance — and it seems that big banks are betting heavily on ETH.
Ethereum is no longer in bitcoin’s shadow. Today, it stands as a key player in bridging traditional finance and the digital future.
*******************************************************************************************
The information provided does not constitute investment research. The material has not been prepared in accordance with the legal requirements designed to promote the independence of investment research and such should be considered a marketing communication.
All information has been prepared by ActivTrades ("AT"). The information does not contain a record of AT's prices, or an offer of or solicitation for a transaction in any financial instrument. No representation or warranty is given as to the accuracy or completeness of this information.
Any material provided does not have regard to the specific investment objective and financial situation of any person who may receive it. Past performance and forecasting are not a synonym of a reliable indicator of future performance. AT provides an execution-only service. Consequently, any person acting on the information provided does so at their own risk. Political risk is unpredictable. Central bank actions can vary. Platform tools do not guarantee success.
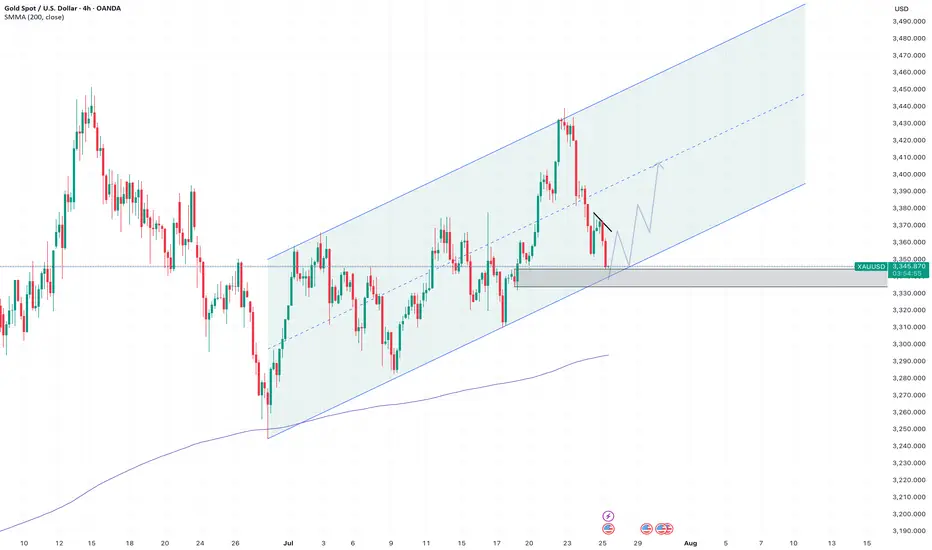
Gold Trade Against the Odds: When Emotion Meets StrategyThis may not be the best decision right now — I understand that — but it's one of those " I'm exhausted and just want to buy " moments.
The setup isn’t fully formed yet, but I have a strong feeling we’re going higher. I like the chart structure: low volatility, a spike to 3430 followed by a pullback to the moving averages without breaking key levels. I also like the tight stop at 1.2%.
I’m buying gold at the current level, around 3355.
📝Trading Plan
Entry: I’m buying gold at the current level, around 3355
Stop Loss: Stop at 3315
Target: 3425, 3500, and beyond.

Volatility Period: July 24-26
Hello, traders.
If you "Follow", you can always get the latest information quickly.
Have a nice day today.
-------------------------------------
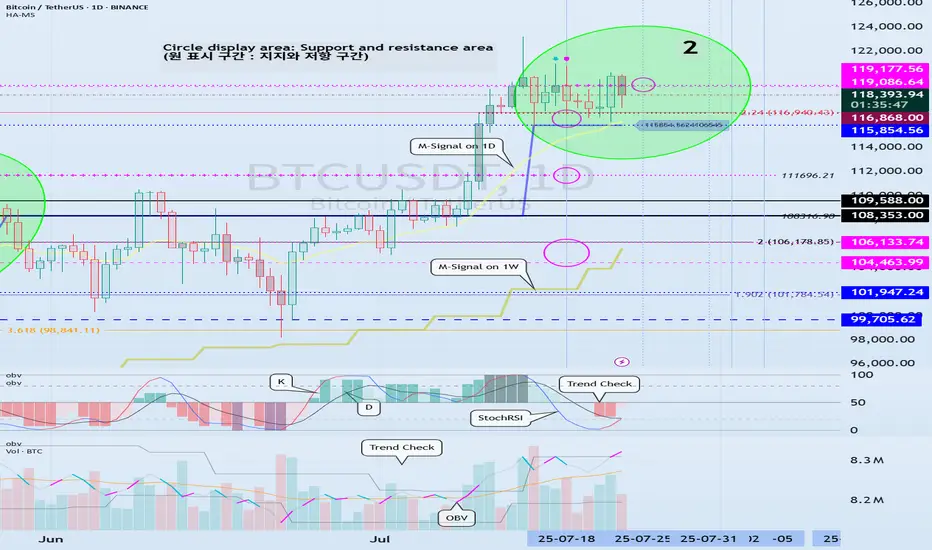
(BTCUSDT 1D chart)
BTC is in a step up trend.
Looking at the bigger picture, it can be seen that it is in the second step up trend.
The important volatility period in this step-up is expected to be around August 2-5 (up to August 1-6).
Therefore, we need to look at what kind of movement it makes as it passes through the previous volatility period of around July 25 (July 24-26) and around July 31 (July 30-August 1).
In other words, we need to check which section is supported and which section is resisted, and see if it breaks through that section.
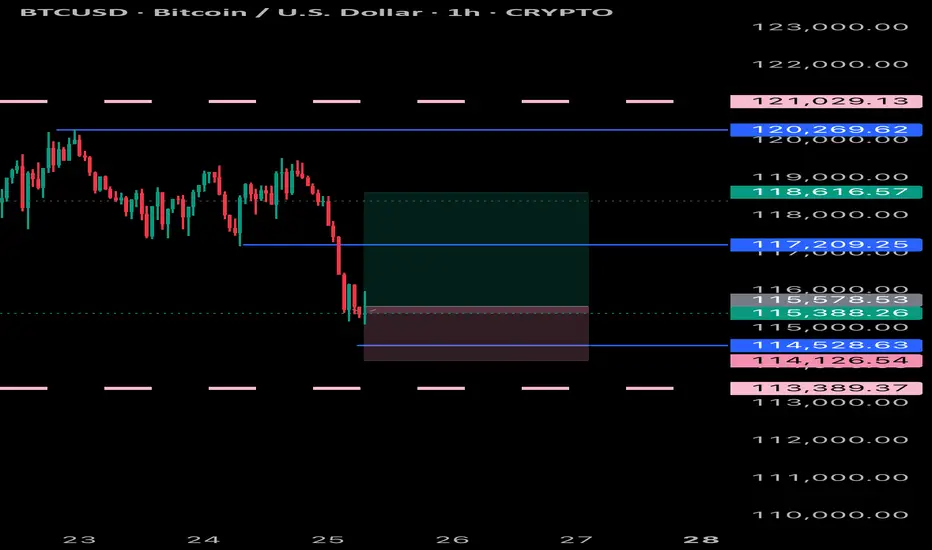
What we can see now is that it is checking whether there is support in the 115854.56-119086.64 section, that is, the HA-High ~ DOM (60) section.
Since the M-Signal indicator on the 1D chart has risen to the 115854.56 point, the key is whether it can receive support at the 115854.56 point and rise.
If it falls below the M-Signal indicator of the 1D chart and shows resistance, it is likely to meet the M-Signal indicator of the 1W chart.
This flow is an interpretation of the separation learned when studying the price moving average.
Therefore, we can see that the maximum decline point is when it meets the M-Signal indicator of the 1M chart.
-
Industries (coins, tokens) that are renewing the ATH are actually outside the predictable range.
Therefore, we should think of it as a situation where it is not strange whether it falls or rises at any time and think of a response plan.
Since it is currently within the predictable range, we can create a response strategy by checking whether there is support in the 115854.56-119086.64 section.
However, as I mentioned earlier, the volatility period is about to begin, so caution is required when making new transactions.
That is, you need to check whether it breaks out of the 115854.56-119086.64 range during the volatility period that continues until July 26.
And if it breaks out, you need to check whether it is supported or resisted in that area and respond accordingly.
-
The OBV indicator of the Low Line ~ High Line channel is showing a pattern of rising above the High Line.
Accordingly, if the OBV indicator is maintained above the High Line, it is expected to show an additional rise.
In accordance with this, you need to check whether the K of the StochRSI indicator shows a movement to rise in the oversold range and a transition to a state where K > D.
You also need to check whether the TC (Trend Check) indicator continues its upward trend and can rise above the 0 point.
If these conditions are met, it is expected that BTC will rise above 119086.64 or show a pattern of rising.
-
This decline created a low trend line, creating a perfect rising channel.
Therefore, we need to see how far we can go up along the rising channel created this time.
In that sense, we should pay close attention to the movement during the volatility period around July 25th (July 24-26).
-
Thank you for reading to the end.
I hope you have a successful trade.
--------------------------------------------------
- This is an explanation of the big picture.
(3-year bull market, 1-year bear market pattern)
I will explain more details when the bear market starts.
------------------------------------------------------