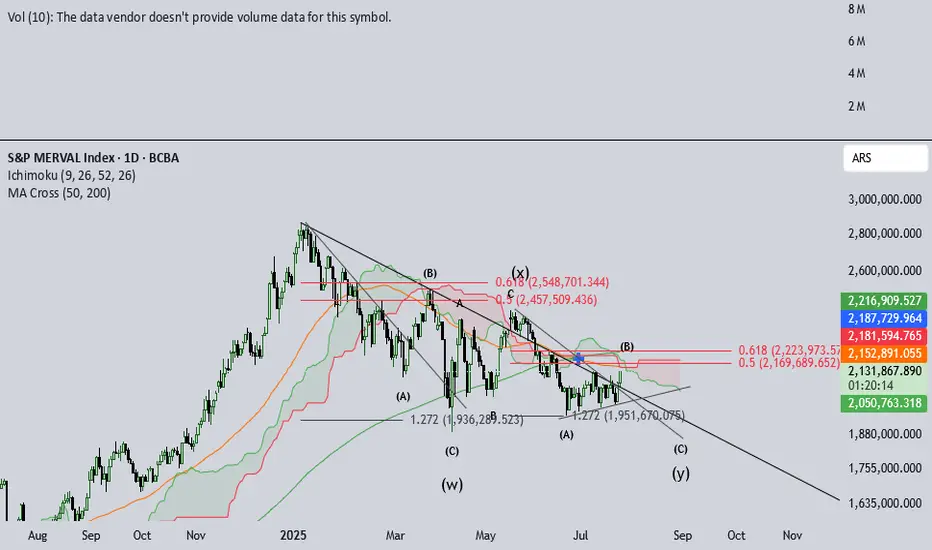
IMV Multiple analysisIMV, Argentina's Merval Index valued in pesos, has been in a downtrend since jan-25. Due to electoral process, noise has been increasing this last week, amidst some shade on what seemed as an easy win for Milei's gov.
The amount of chatter the Merval has brought up is inmense. This psychology is similar to that expected in IVth elliott's waves. Also, jul 2022 - dic 2024 saw huge gains, signaling IIIrd elliot´s wave behavior.
This long and extended IVth can be seen after such huge rallies. Anxiety begins to build up and retail investors begin to be shaken out. This IVth wave seems to be a triple-three type. Volatile and fast, this structure destroys an investor's patience.
Recent developements in the money market seem to have calmed down and peace seems to be partially restored. September elections are around the corner and this little Pax may be threatened.
I'm inclined to believe NOTHING WILL HAPPEN in these elections the govt faces, nor will the gov succeed enourmously, nor will it fail badly. So, I believe the index will likely test previous (W) wave bottoms, to then breakout for a final Vth wave. This analysis is compatible with a triangle-shaped breakout.
Beyond Technical Analysis
Doge update I'll be expecting a breakout to 0.33
If we can get past 0.35 I will be expecting a rally quickly.

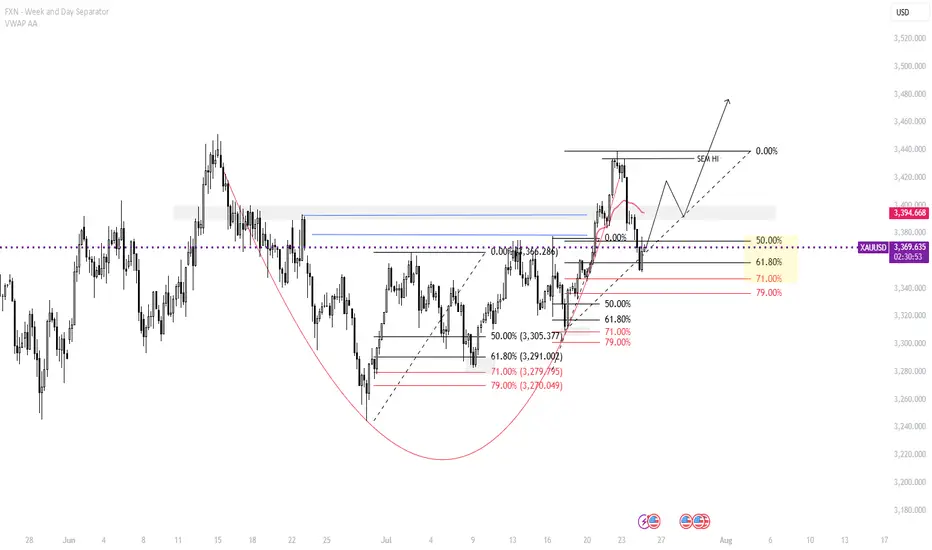
Gold – 24 July: Watching H4 OB Zone for Bullish ReversalGold – 24 July Outlook
Watching H4 OB Zone for Potential Reversal
📌 Recap of 23 July Trade:
As outlined in yesterday’s analysis, the M15 Order Block ( 3417–3412 ) held well. The market reacted precisely from this level, and our long setup successfully hit the defined 120-pip target .
However, after reaching a high near 3434 , the price failed to break above and instead rejected sharply, breaking the recent M15 higher low — a key structural sign that signals the start of a possible H4 pullback phase.
🔍 Current Market Context:
Trend Overview:
While the overall bias remains bullish, this break of M15 structure suggests short-term weakness and a corrective move in progress on the H4 chart.
Key Zone in Focus:
H4 Order Block Zone: 3359 – 3345
This is a critical zone to watch today. The market is currently trading around this area, and it could act as a potential reversal point where the uptrend resumes.
🎯 Trading Plan:
– Closely monitor the price action within the 3359–3345 zone.
– If price respects this zone and LTF (e.g., M1) shows signs of structure flip or ChoCH + BoS , it could present a fresh long setup opportunity.
– As always, only act on the trade if multiple confluences align — don’t anticipate, let the market confirm.
📈 Summary:
Bias: Watching for a bullish reversal from the 3359–3345 zone.
Setup Condition: Wait for clear LTF confirmation before entering.
Risk Management: Stick to 1:3 RR — 40 pip SL and 120 pip TP as per system.
Let the market come to your setup. Patience is your greatest edge.
📘 Shared by @ChartIsMirror

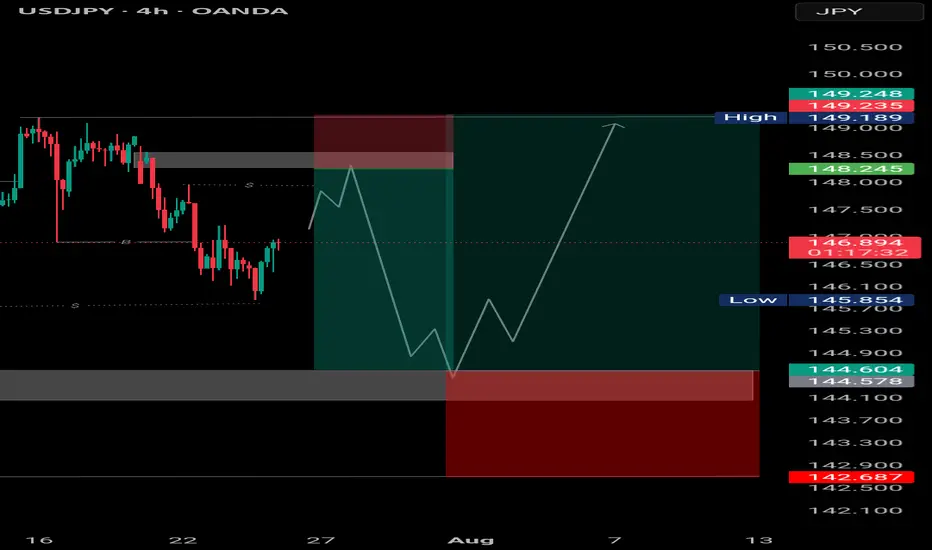
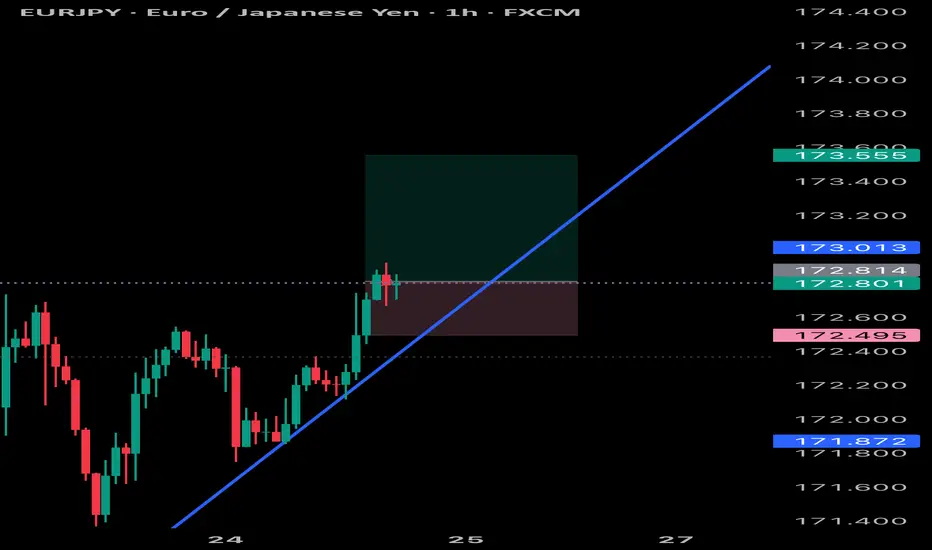
Sell to Buy UJ"USDJPY 4H Setup: Waiting for liquidity sweep below 145 before targeting 148.2+ 📈
Patience is key — let price come to you. Watching demand reaction closely before executing
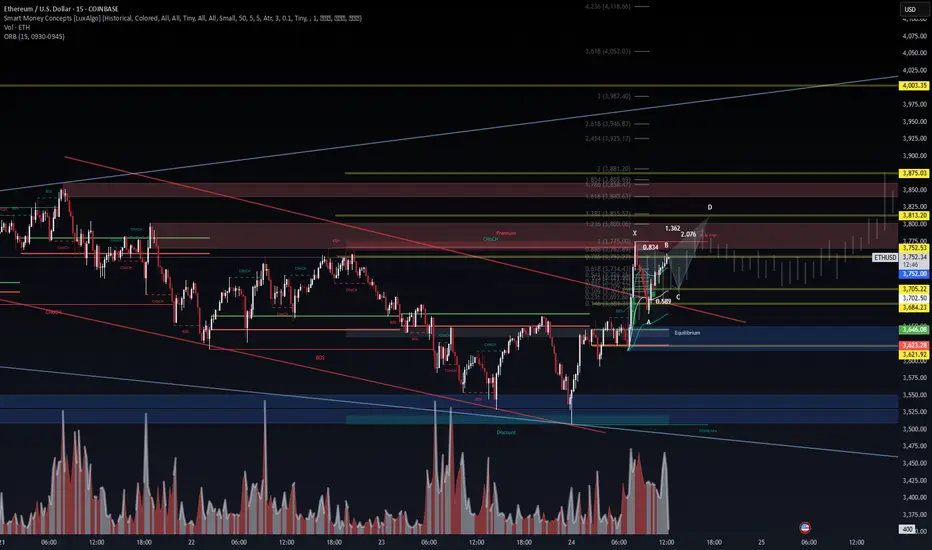
ETH/USD Harmonics forecast. We are still studying it's trend, looks like the next move is going to be toward downwards, temporary.
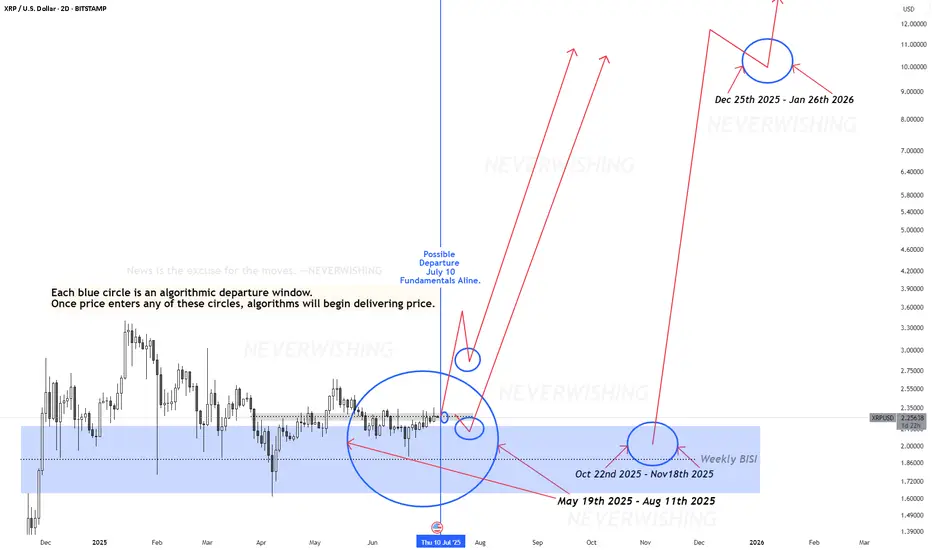
XRP: $10 Breakout? Watch These Algorithmic Windows!This XRP analysis highlights "algorithmic departure windows" (blue circles) where explosive price moves can occur.
Whenever price enters a blue circle, XRP can launch to $10 or higher instantly or within 33 days—no matter the news.
**Key Dates to Watch:
**Possible Departure: July 10, 2025 (fundamentals align)
**Other Windows: May 19 - August 11, 2025; October 22 – November 18, 2025
**Major Target Zone: $8.50–$11.50 (December 25, 2025 – January 26, 2026)
History shows that once price breaks out from these departure windows, XRP can reach its upper targets rapidly—sometimes in a single day, but almost always within 33 days or less.
News is the excuse for the moves—algorithms deliver the predetermined price.
Why a USD Bounce Could Trigger a Stock PullbackThe US Dollar has faced brutal selling during the first half of 2025. Some are even questioning whether the Dollar’s global hegemony is at risk. Early in the year the US stock market AMEX:SPY sold off aggressively, falling 19% from mid‑March to early April. Since then stocks have more than regained their losses and the Dollar is still in the tank. So where does that leave us for the rest of the year?
The Dollar Inverse Correlation
The US Dollar has an inverse correlation to most everything. Stocks, bonds, crypto, commodities, real estate — all are measured in Dollars. Therefore when the Dollar loses value, all things equal it takes more of them to reach the same value those assets were denominated at before. Conversely when the Dollar rises, other assets lose value in Dollar terms. Here we can see a long standing inverse correlation to stocks AMEX:SPY
Dollar in oversold territory
The Relative Strength Index (RSI) is a momentum oscillator that measures the magnitude of recent price changes on a scale from 0 to 100 to help identify overbought (above 70) or oversold (below 30) conditions. The Dollar has hit oversold several times so far this year, but not yet staged a material recovery.
Stocks in overbought territory
Meanwhile stocks have staged a blistering rebound off the "Liberation Day" driven selloff earlier this year. The S&P 500 now sits at an all‑time high, and you guessed it, has tapped overbought twice this month.
USD is fundamentally attractive
Because investors seek to earn the highest available yield on their capital, they tend to move funds into currencies offering higher interest rates (and away from those with lower rates), so differences in policy rates across countries create incentives for cross‑border borrowing and lending that drive FX flows. For example the Fed ( ECONOMICS:USINTR ) is at 4.5%, and the ECB ( ECONOMICS:EUINTR ) is at 2.15%. Moreover the Dollar is down significantly against major trading pairs that have lower yields. In our prior example the Dollar is down 11.98% against the Euro YTD (1- FX:EURUSD ), leaving substantial room for capital gains. Gravity could lure FX traders back in the second half of 2025.
Tariff calculus
Tariffs tend to bolster the imposing country’s currency in two main ways: by making imports more expensive they reduce import volumes, improving the trade balance (i.e. fewer foreign‑currency outflows), and by collecting duties in domestic currency the government effectively withdraws that currency from circulation, increasing its relative scarcity. Both effects lift demand for—and support the value of—the home currency.
Putting it all together
Despite the TVC:DXY ’s ~10.8% YTD slide and repeated oversold conditions, the compelling carry trade sets the stage for a USD bounce that, in turn, could pressure overextended equities. With stocks stretched and the Dollar oversold, the carry‑driven rebound in USD could well presage a pullback in equities. Stocks are expensive, Dollars are cheap 🤑

Vine can reach new all time highs due to elon bringing it backVine can reach new all time highs due to elon bringing back the viral platform.
Vine has the chance to outshine every other meme coin this year.

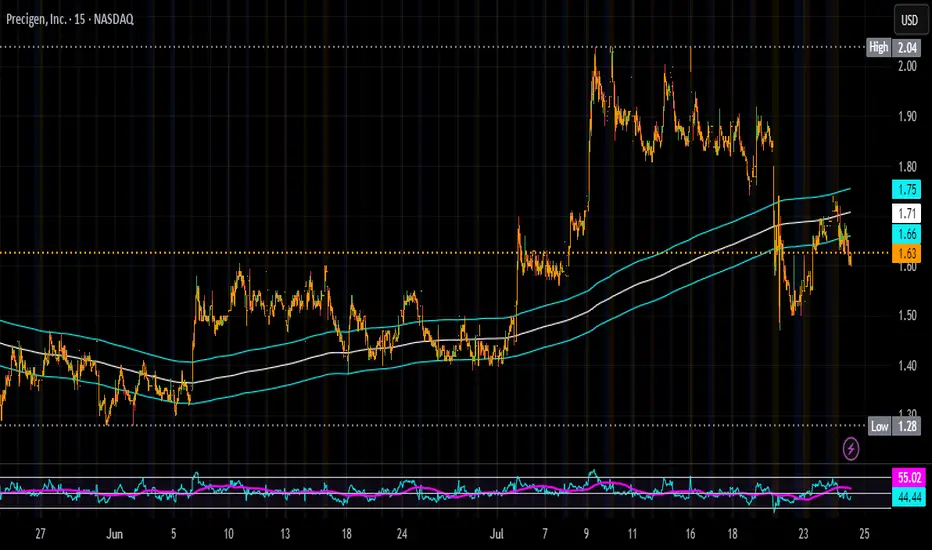
Buying More PGEN on all DipsThe market is overreacting to the NASDAQ:REPL news, and I think it’s a mistake to lump NASDAQ:PGEN in with it. Yes, PRGN-2012 is also a single-arm gene therapy trial, but it’s for an ultra-rare disease—not a broad indication like cancer. The FDA’s tougher stance seems to be focused on common diseases (like NASDAQ:REPL ’s melanoma drug), not niche, high-unmet-need therapies like Precigen’s.
Here’s why I’m loading up on this pullback:
PRGN-2012 has incredible data: 51% complete response rate, 86% reduction in surgeries (from 4 per year to zero). These patients suffer through painful, repeated procedures—this drug could be life-changing.
FDA loves it: Breakthrough Therapy, Orphan Drug, Fast Track, and Priority Review with a PDUFA date of August 27, 2025. If approved, it’ll be the first-ever treatment for RRP.
Commercial upside: Rare disease drugs have high margins, and there’s zero competition.
The sell-off is shortsighted. I’m treating this as a fire sale and buying more before the August 2025 catalyst. NASDAQ:PGEN is a high-conviction play for me.
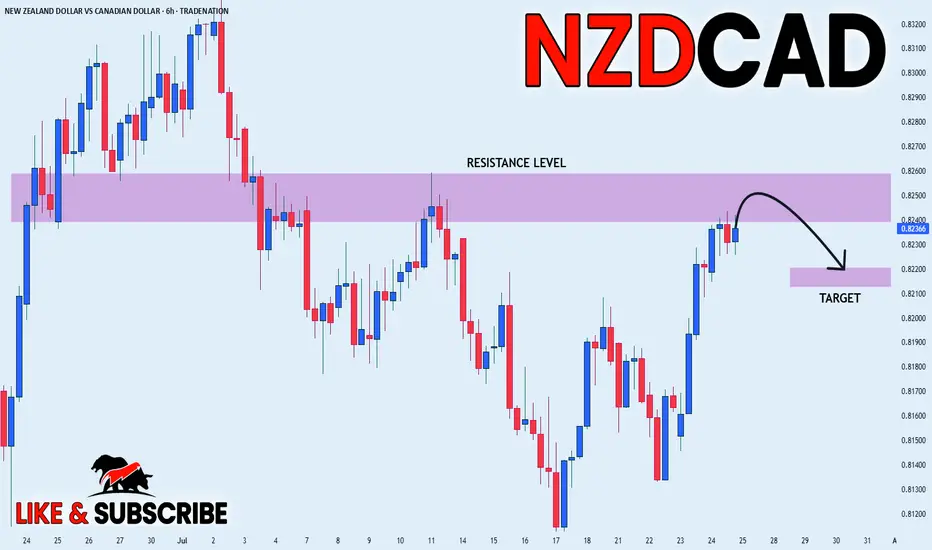
NZD_CAD POTENTIAL SHORT|
✅NZD_CAD has been growing recently
And the pair seems locally overbought
So as the pair is approaching
A horizontal resistance of 0.8260
Price decline is to be expected
SHORT🔥
✅Like and subscribe to never miss a new idea!✅
Disclosure: I am part of Trade Nation's Influencer program and receive a monthly fee for using their TradingView charts in my analysis.

Ethereum short updateDon't be surprised to see some buying coming into play at the POI's highlighted below.
Hedging involves entering into a trade that is expected to perform in the opposite direction of an existing position, effectively protecting against potential losses.

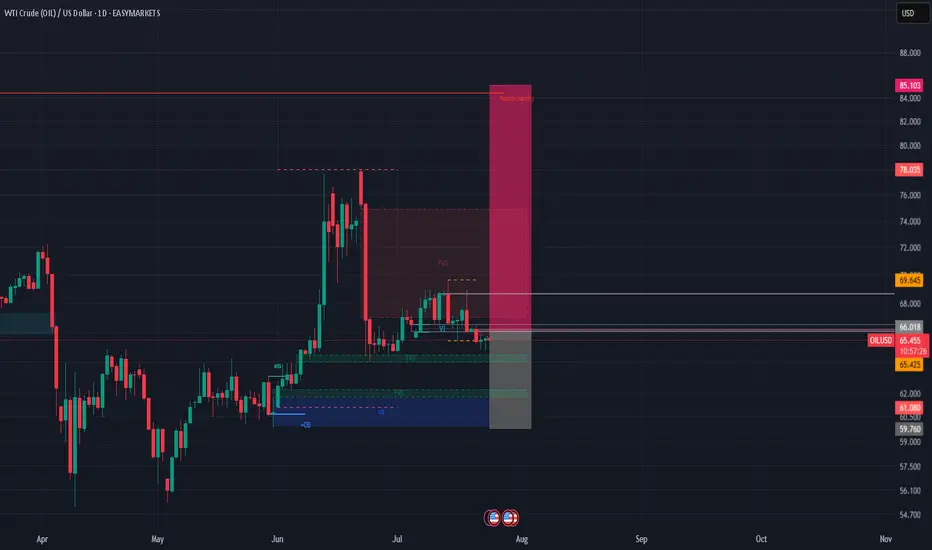
CRUDE OIL (LONG IDEA)🛢️ OILUSD (WTI Crude Oil) – LONG SETUP 🛢️
🚦 Bias: BULLISH (Long)
💰 Entry: Market @$65.408 (or buy dips)
🛑 Stop Loss:$60.00 (HTF protection)
🎯 Take Profits:
• TP1:$69.65
• TP2:$72.00
• TP3:$85.00 🚀 (HTF buy-side liquidity)
🔍 Why This Trade?
✨ Multi-Timeframe Confluence:
📈 Weekly: Bullish structure shift, liquidity sweep
🟩 Daily: Strong bounce from order block + FVG
⏰ 4H: BOS, FVG tap, higher lows = bullish flow
🔥 Fundamentals:
🏦 EIA: Big crude inventory drawdown
🌍 OPEC/IEA: Q3 demand rising
⚡ Geopolitics: Middle East/Red Sea risk premium
💵 Macro: USD weakness = oil tailwind
🧠 Sentiment:
🧑💻 Retail: Still net short
🏦 Managed money: Adding longs
🚀 Fuel for upside!
🛠️ Execution Plan:
💸 Buy now @$65.408 or scale in on dips $64.50–63.50)
🛡️ Stop Loss:$59.780 (HTF structure)
🎯 Targets:
TP1:$69.65
TP2:$72.00
TP3:$85.00 🚀
❌ Invalidation:
Weekly close <$60.00 = exit
⚡ Summary:
All signals GO! 🚦 Multi-timeframe bullish structure, strong demand, and fundamentals + sentiment all align for a high-conviction long. Risk defined at $60.00 for max protection. Targeting major buy-side liquidity at $85.00!
#OILUSD #CrudeOil #Long #SmartMoney #TradeSetup 🚀
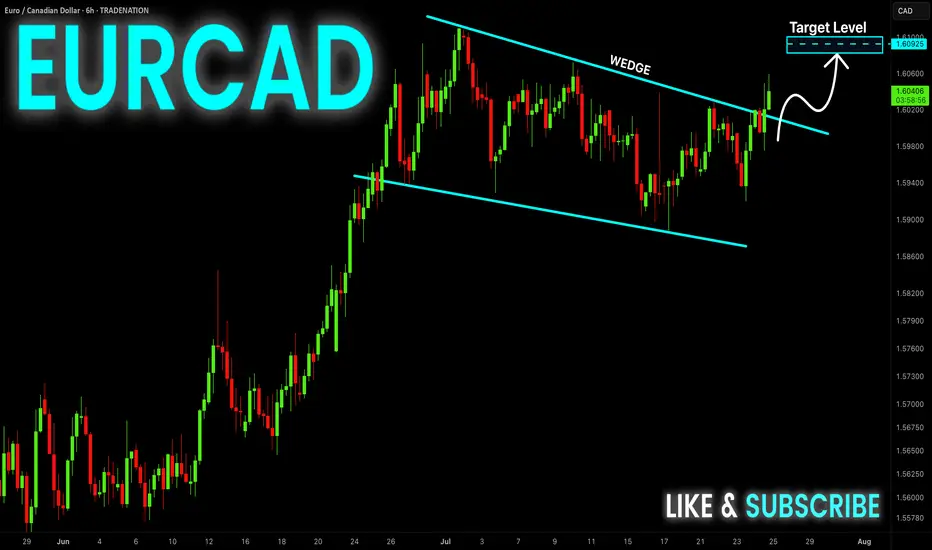
EUR-CAD Bullish Wedge! Buy!
Hello,Traders!
EUR-CAD is trading in an
Uptrend and the pair formed
A bullish wedge pattern and
Now we are seeing a bullish
Breakout from the wedge so
We are bullish biased and we
Will be expecting a further
Bullish move up
Buy!
Comment and subscribe to help us grow!
Check out other forecasts below too!
Disclosure: I am part of Trade Nation's Influencer program and receive a monthly fee for using their TradingView charts in my analysis.
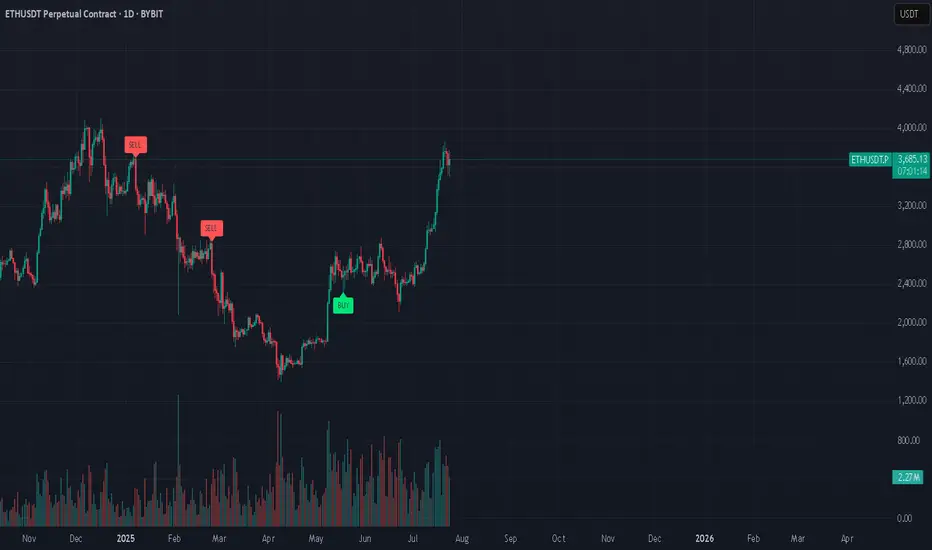
Huge Bear Trap next in line??Ethereum Exit Queue: 518,180 ETH
Half a million ETH is currently queued for unstaking on Ethereum...
Keep in mind, August 1st, Trump's Reciprocal Tariffs get in effect
Everyone's talking about BTC's new ATH, ETH's rally, XRP new ATH, but no one is talking about August 1st...
Manipulation is taking place. Stay safe, because a huge bear trap might be next in line (BTC back to 90K)
*NOT INVESTMENT ADVICE*
#crypto #ethereum #eth #btc #bitcoin #trading #xrp #trump #tariff #finance #economy
GOOGL TRADE IDEA (07/24)
🚨 GOOGL TRADE IDEA (07/24) 🚨
💥 Big institutional flow. 1 DTE. High gamma = high reward (⚠️ high risk too)
🧠 Quick Breakdown:
• Call/Put Ratio: 2.44 → ultra bullish
• Weekly RSI climbing (67.3) 📈
• Daily RSI falling from 77.5 → 🔻 short-term pullback risk
• Reports split: trade or wait? We’re in.
💥 TRADE SETUP
🟢 Buy GOOGL $200 Call exp 7/25
💰 Entry: $2.09
🎯 Target: $3.14–$4.18 (50–100%)
🛑 Stop: $1.25
📈 Confidence: 70%
⚠️ Expiry in 1 day = tight execution needed. Gamma can cut both ways. Watch it like a hawk. 👀
#GOOGL #OptionsFlow #CallOption #GammaSqueeze #TechStocks #UnusualOptionsActivity #TradingView #StockAlerts #BigMoneyMoves #DayTrading #OptionsTrading

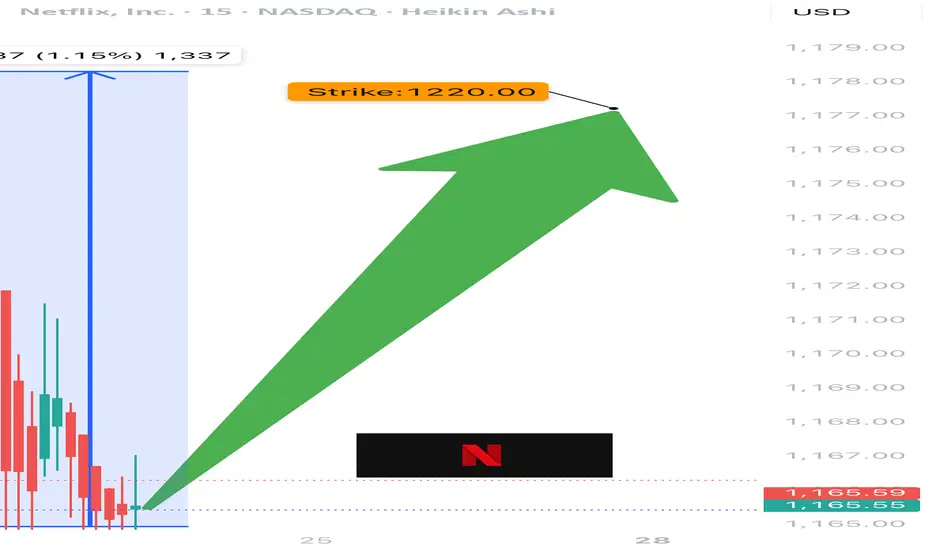
NFLX TRADE IDEA (07/24)
🚨 NFLX TRADE IDEA (07/24) 🚨
⚔️ Bulls vs. Bears… but calls are winning 🐂📈
🧠 Quick Breakdown:
• Call/Put Ratio: 1.27 → bullish edge
• RSI < 45 = 🔻oversold territory
• VIX favorable = room to run
• High gamma = big moves incoming ⚡️
• Expiry: TOMORROW = 🔥 time decay risk
💥 TRADE SETUP
🟢 Buy NFLX $1220 Call exp 7/25
💰 Entry: $0.50
🎯 Target: $0.90
🛑 Stop: $0.30
📈 Confidence: 65%
⚠️ Watch volatility closely. Fast exit = smart exit.
#NFLX #OptionsFlow #OptionsAlert #BullishPlay #DayTradeSetup #NetflixStock #TechOptions #UnusualOptionsActivity #TradingView #GammaSqueeze
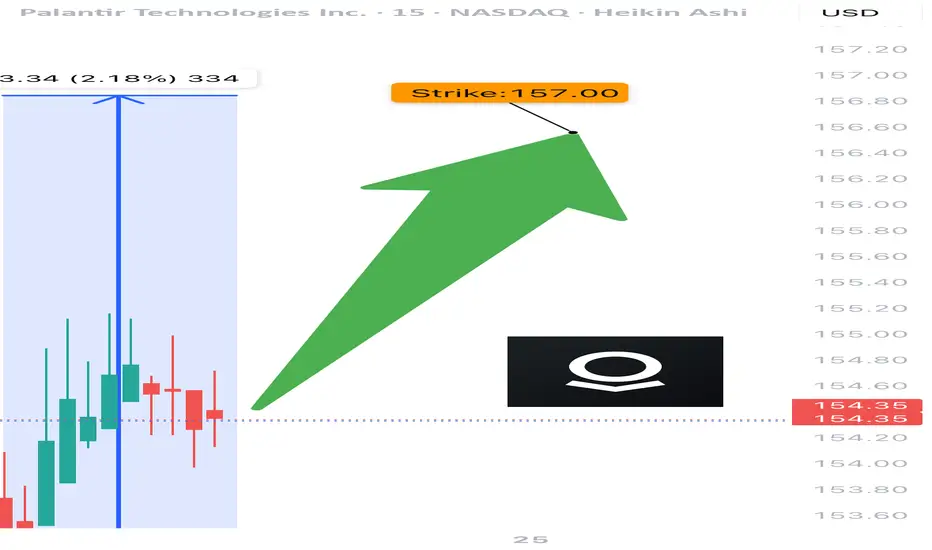
PLTR TRADE SIGNAL (07/24)
🚨 PLTR TRADE SIGNAL (07/24) 🚨
💥 Expiry in 1 day = HIGH GAMMA risk = BIG MOVES coming
🧠 Key Highlights:
• Call/Put Ratio: 1.40 → bullish options flow
• Strong institutional positioning 📈
• RSI cooling off = ⚠️ watch momentum
• Volume concerns → cautiously bullish
💥 TRADE SETUP
🟢 Buy PLTR $157.50 Call exp 7/25
💰 Entry: $0.59
🎯 Target: $0.89 (50%+)
🛑 Stop: $0.24
📈 Confidence: 65%
⚠️ Gamma + Time Decay = explosive but risky. Tight execution needed.
#PLTR #OptionsAlert #OptionsFlow #UnusualOptionsActivity #TechStocks #DayTrading #GammaSqueeze #TradingView #BullishSetup #CallOption
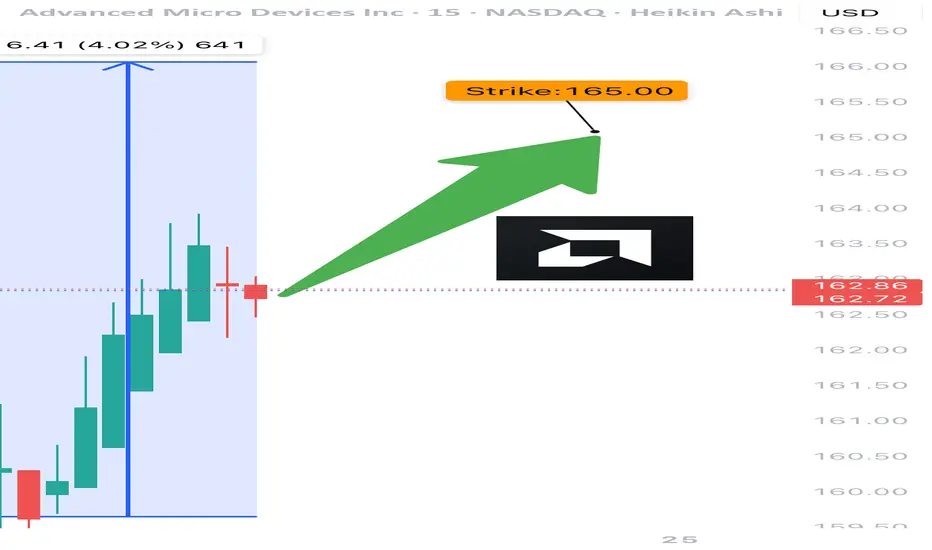
AMD TRADE ALERT (07/24)
🚨 AMD TRADE ALERT (07/24) 🚨
Options flow is screaming bullish 📈
🧠 Key Insights:
• Call/Put Ratio: 1.80 (🔥 heavy call bias)
• RSI: Daily 75.5 / Weekly 77.2 = strong momentum
• Volume = weak ⚠️ but sentiment remains bullish
• High gamma risk = explosive potential near expiry
💥 TRADE IDEA
🟢 Buy AMD $165 Call exp 7/25
💰 Entry: $0.80
🎯 Target: $1.60
🛑 Stop: $0.48
📊 Confidence: 75%
⚠️ Quick expiry = fast moves. Monitor closely.
#AMD #OptionsFlow #UnusualOptionsActivity #TradingView #OptionsTrading #BullishSetup #TechStocks #DayTrading #GammaSqueeze #OptionAlerts