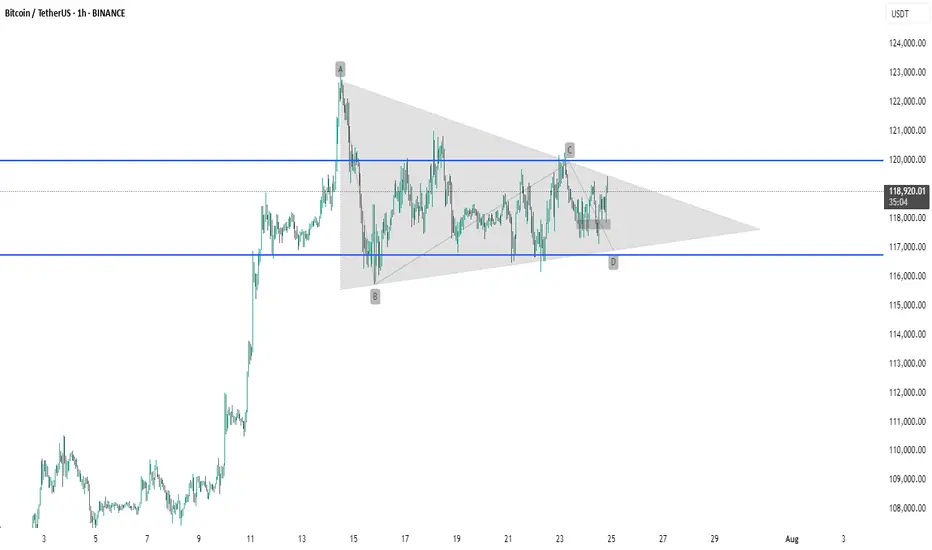
BTC #The chart shows Bitcoin (BTC/USDT) on a 1-hour timeframeThe chart shows Bitcoin (BTC/USDT) on a 1-hour timeframe forming a symmetrical triangle pattern, marked by points A, B, C, and D. This consolidation pattern indicates potential for a breakout as price volatility contracts. Key support is around $117,000, and resistance is near $120,000. A breakout above or below the triangle could signal the next major move. Traders typically watch for volume confirmation before entering a trade.
thanking you
Beyond Technical Analysis
Buy idea!Hello all. as you see market formed a Proper Structure and it is ready to make a new higher high (the last Higher High). be happy(wink)

BTCUSD 7/24/2025Come Tap into the mind of SnipeGoat as he gives you a Full Top-Down Analysis of Bitcoins Price Action from the Monthly down to the 30min. To keep you align & aware of what's REALLY going on in the market. Don't believe the hype, we read Candles over here!
_SnipeGoat_
_TheeCandleReadingGURU_
#PriceAction #MarketStructure #TechnicalAnalysis #Bearish #Bullish #Bitcoin #Crypto #BTCUSD #Forex #NakedChartReader #ZEROindicators #PreciseLevels #ProperTiming #PerfectDirection #ScalpingTrader #IntradayTrader #DayTrader #SwingTrader #PositionalTrader #HighLevelTrader #MambaMentality #GodMode #UltraInstinct #TheeBibleStrategy

Natural Gas: Long Setup After Healthy PullbackNatural gas has made a decent pullback, and a solid long setup is forming here with a relatively tight stop-loss for gas.
If the stop gets hit, the second entry will be from the $3.00 level.
Entry is from current levels.
📝Trading Plan
Entry: Entry is from current levels.
Stop Loss: 3.0855
Target: 3.36

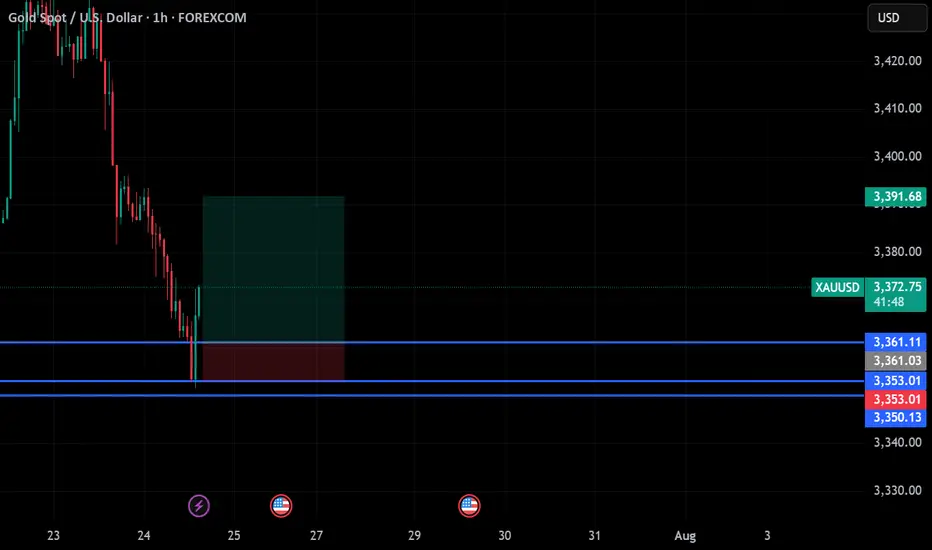
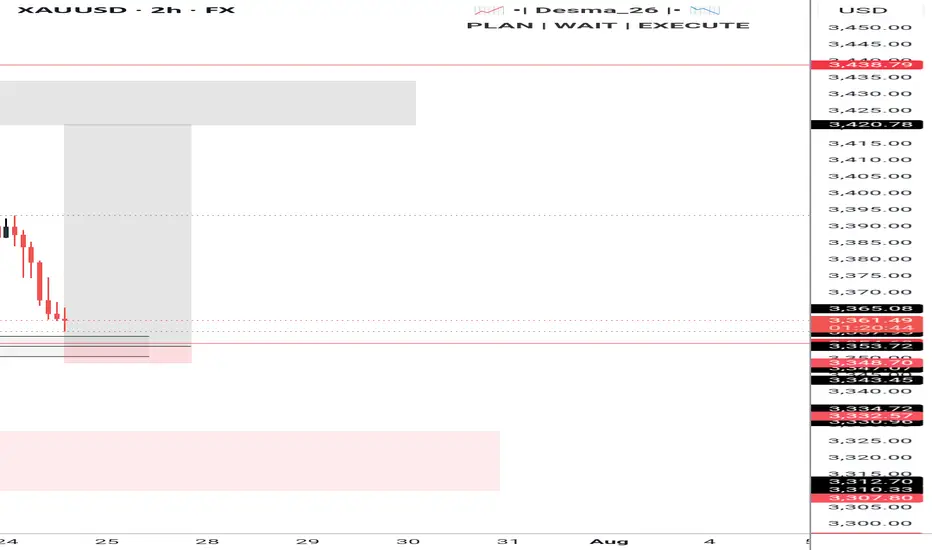
gold on buy reverse#XAUUSD price we await a little retrace below 3361 to continue bullish. Market price can follow
Entry at 3361, target 3391, stop loss 3353.
Bearish can follow depending on if tariff is lower.
Testing Blue Support – Key Level Ahead!🚨 SPARKS:VIRTUAL Testing Blue Support – Key Level Ahead! 📉🔵
SPARKS:VIRTUAL is currently testing the blue support zone.
📊 If a breakdown occurs, we could see a move toward the green line level as the next target.
🛑 Watch for confirmation — this could signal further downside if sellers take control.


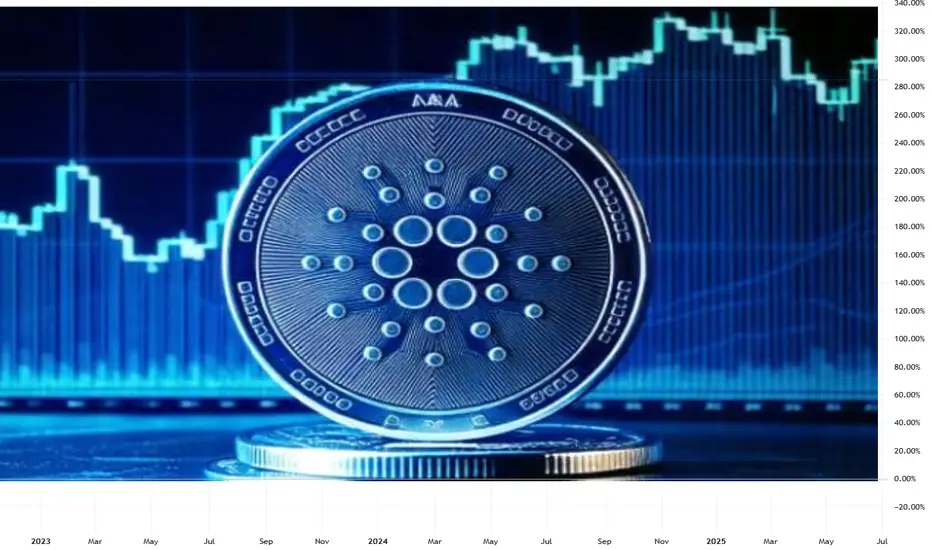
ChatGPT Claims $ADA Is Waking Up – Could $3 Be Back on the TableWith Cardano (ADA) showing renewed momentum, speculation is resurfacing about whether it can approach its $3 all-time high. While ChatGPT-powered analysis highlights early signs of revival, measured expectations and strategic planning are essential.
ADA’s Technical Setup: Signs of Uptick
Whale accumulation: Large wallets are steadily acquiring ADA, hinting at long-term confidence.
EMA crossover: ADA’s 50-day MA recently crossed above the 200-day MA—a bullish omen.
Volume confirmation: Price increases are backed by rising trade volume, strengthening the signal.
This alignment suggests ADA may be entering a steady upward phase.
Ecosystem Growth Driving Optimism
Vasil upgrade legacy: Network throughput improvements and reduced fees remain strengths.
DeFi & NFT traction: Over 30 smart contracts launched recently, signaling healthy usage.
Strategic partnerships: Engagements in green finance and digital identity add real use-case value.
Together, these factors strengthen ADA’s fundamentals and investor sentiment.
Sizing Up the $3 Benchmark
Market cap scale: To reach $3, Cardano’s market cap needs to expand by approximately $90 billion—a significant leap.
Past performance context: ADA flirted with $3 in late 2021 but lacked supporting network activity to sustain it.
Trigger dependency: Institutional adoption, DeFi hubs, or major fiat tie-ins are likely prerequisites for a breakout.
A controlled climb toward $2 seems more realistic, with a push beyond requiring major catalysts.
Investor Considerations
Staggered entry (DCA): Consider accumulating between $1.20–$1.40.
Profit-taking strategy: Partial exits at $2 and $2.50+ help lock in gains while maintaining exposure.
News monitoring: Watch new dApp launches, development updates, and community announcements.
Portfolio balance: ADA is best held alongside BTC, ETH, and select altcoins to mitigate risk.
Final Take
On-chain momentum and ecosystem signals suggest Cardano is moving off the sidelines. However, an overnight surge to $3 is unlikely without significant developments. By combining thoughtful accumulation with active monitoring and disciplined risk management, investors can position themselves to benefit if ADA continues its upward trajectory in 2025.
US30 - LONGAfter a huge push to the upside price came down during the asian/London session. Looking for buyers to take over once again and push back to yesterday's highs. Being patient as always and waiting for confirmation around my entry zone.

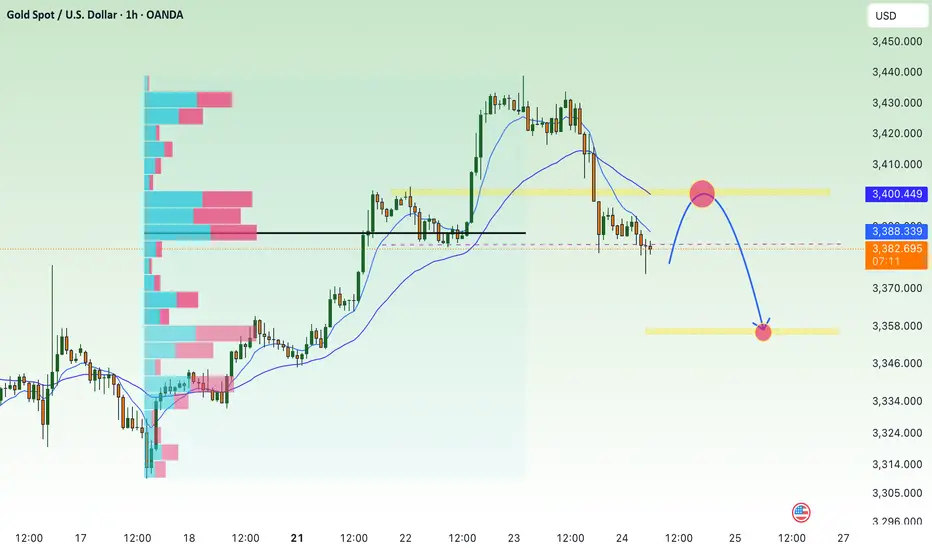
Gold prices under selling pressure from tariff policy⭐️GOLDEN INFORMATION:
Gold price (XAU/USD) stays under pressure during Thursday's Asian session, extending the sharp pullback from its highest level since June 16 seen the previous day. Optimism surrounding global trade continues to build, fueled by reports that the United States and the European Union (EU) are nearing a tariff agreement, following progress in the US-Japan trade deal. This upbeat sentiment has dampened safe-haven demand and is a major factor weighing on gold prices.
⭐️Personal comments NOVA:
Gold price adjusted down, broke support, faced selling pressure again, accumulated below 3400
⭐️SET UP GOLD PRICE:
🔥SELL GOLD zone: 3400- 3402 SL 3407
TP1: $3390
TP2: $3380
TP3: $3370
🔥BUY GOLD zone: $3356-$3354 SL $3349
TP1: $3365
TP2: $3373
TP3: $3382
⭐️Technical analysis:
Based on technical indicators EMA 34, EMA89 and support resistance areas to set up a reasonable SELL order.
⭐️NOTE:
Note: Nova wishes traders to manage their capital well
- take the number of lots that match your capital
- Takeprofit equal to 4-6% of capital account
- Stoplose equal to 2-3% of capital account
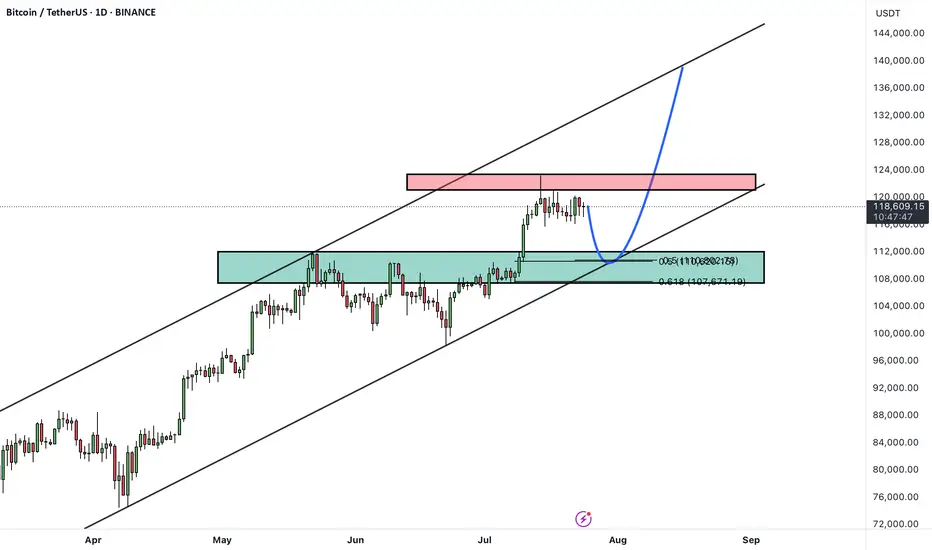
BTCUSDTHello Traders! 👋
What are your thoughts on BITCOIN?
After setting a new all-time high, Bitcoin remains in a corrective phase, marked by sideways price action and choppy movements.
There's a notable gap around the $114,000 level, which may act as a magnet for price during this correction.
The ongoing pullback is likely to extend toward the key support zone, which aligns with the previous breakout level and the bottom of the ascending channel.
Once this support holds, we could see a bullish reversal, targeting the upper boundary of the channel once again.
As long as Bitcoin remains above the marked support zone, the overall structure stays bullish and this correction may present a buy-the-dip opportunity.
Will Bitcoin fill the gap and bounce back toward new highs? Let us know your thoughts! 🤔👇
Don’t forget to like and share your thoughts in the comments! ❤️
Trading balanceTrading balance The price of the asset has rebounded from the balance zone. With the prospect of growth into the resistance zone.

XAUUSD BUYS EXPECTATIONS I'm expecting buys from the marked demand zone(OB) as indicated from the graph above... Who is in ☝🏾 let me see your hands up 😎
APT Forming Bearish Wedge Pattern – Watch the Support! APT Forming Bearish Wedge Pattern – Watch the Support! ⚠️📉
APT is forming a bearish wedge pattern and is now testing the blue support trendline.
🔻 If the support breaks, we could see a move down to the first green line level.
📊 Stay alert — this setup could trigger soon. Wait for confirmation before reacting.

What’s Next? 🚨 $FARTCOIN Cup & Handle Pattern Forming – What’s Next? 📈
$FARTCOIN has formed a bullish Cup & Handle pattern — but is it over?
❌ Not yet. $FARTCOIN hasn’t shown any strong bearish signals for now.
🔍 We’re watching two key green line levels below.
📉 If the price drops toward these zones, we may see buyers step back in — creating a potential entry, but only with confirmation.
✅ Stay patient — no rush to jump in without a setup. Let the chart guide us.

BULLISH ON GOLDPrice is in Daily FVG and bearish momentum starts slowing down on 1H Timeframe. Entry off London Low sweep with rejection.

BTC AI Prediction Dashboard - 6h Price Path (23.07.25)
Prediction made using Crypticorn AI Prediction Dashboard
Link in bio
BTCUSDT Forecast:
Crypticorn AI Prediction Dashboard Projects 6h Price Path (Forward-Only)
Forecast timestamp: ~11:00 UTC
Timeframe: 15m
Prediction horizon: 6 hours
Model output:
Central estimate (blue line): -118,258
Represents the AI’s best estimate of BTC’s near-term price direction.
80% confidence band (light blue): 118,206 – 118,719
The light blue zone marks the 80% confidence range — the most likely area for price to close
40% confidence band (dark blue): 117,712 – 119,423
The dark blue zone shows the narrower 40% confidence range, where price is expected to stay with higher concentration
Volume on signal bar: 133.21
This chart shows a short-term Bitcoin price forecast using AI-generated confidence zones.
Candlesticks reflect actual BTC/USDT price action in 15-minute intervals.
This helps visualize expected volatility and potential price zones in the short term.
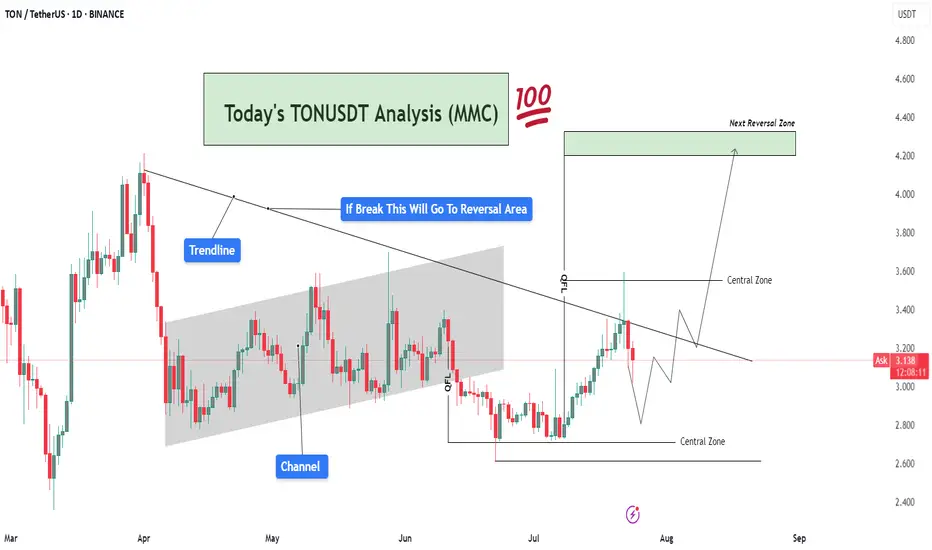
TONUSDT Analysis – Trendline Breakout Target To Reversal Area🧠 Market Sentiment & Context:
TONUSDT (Toncoin vs USDT) is currently trading at $3.13, showing signs of compression within a well-defined MMC structure. After forming a clear QFL (Quick Flip Level) base, the market is approaching a decisive breakout level, with a strong rejection or breakout likely in the coming days.
This chart displays confluence from trendlines, channel breaks, central zones, and QFL demand zones, providing multiple layers of structure-based decision-making. Here's a deeper dive 👇
🔍 Technical Breakdown – What the Chart Is Telling Us:
🔸 1. Major Trendline Resistance – Bearish Control Zone
The descending trendline drawn from prior highs is acting as dynamic resistance.
Price tested this line recently and faced rejection, showing that sellers are still active.
However, the consolidation below the trendline suggests accumulation, not panic selling — a classic sign of smart money positioning before a breakout.
🔸 2. Previous Channel Structure – Broken & Retested
The price previously moved inside a slightly rising parallel channel, reflecting a slow and steady bullish phase.
The channel has now been broken, but TON quickly reclaimed structure via a strong bullish engulfing candle from the QFL base, hinting that this was a liquidity grab (stop hunt) before the real move.
🔸 3. QFL (Quantity Following Line) – Institutional Demand Zone
The QFL base at around $2.85–$3.00 was created after a swift sell-off followed by immediate bullish response.
This is a high-probability MMC reversal structure, where large buyers typically enter.
Since this QFL held firm, it has created a solid foundation for bullish momentum, provided the trendline is eventually broken.
🧭 What's Happening Now – Price Action Update:
Price is caught between two major Central Zones:
Lower Zone: $2.85 – $3.15 (Support)
Upper Zone: $3.50 – $3.70 (Resistance)
The current movement shows price creating higher lows, indicating bullish pressure building beneath the trendline.
Volume remains low, which means the market is waiting for a catalyst (news or breakout) before a directional push.
📌 Key Reversal Zone Ahead – Eyes on $4.20 to $4.40
If price breaks and closes above the descending trendline and crosses the upper central zone, we can anticipate a strong bullish move toward the Next Reversal Zone marked around $4.20–$4.40.
This zone has historical confluence as:
Previous strong supply zone
Psychological round number
Fibonacci extension alignment
This will likely be the profit-booking area for swing traders and early buyers from the QFL zone.
📈 Trade Scenarios Based on MMC:
✅ Bullish Scenario (High Probability If Breakout)
Price breaks the trendline → Pullback → Retest of $3.50–$3.60 zone
Bullish continuation to $4.20–$4.40 Reversal Zone
Ideal entry on retest after breakout
Stop-loss below $3.00
❌ Bearish Scenario (If Rejected Again)
Rejection from trendline leads to re-test of lower Central Zone
Breakdown of QFL level (~$2.85) would invalidate bullish setup
Potential drop toward $2.60 zone for liquidity sweep
🧠 MMC-Based Observations:
🔹 MMC Element 📍 Explanation
🔺 Trendline Key resistance from macro downtrend
🟩 Central Zones Neutral battleground for buyers/sellers
🔻 Channel Break Confirmed bearish momentum earlier, now tested
✅ QFL Strong base, showing early smart money entries
🎯 Reversal Zone High-risk area, expect volatility and profit-taking
📌 Strategic Summary:
Bias: Bullish (as long as price holds above $3.00)
Confirmation Needed: Daily candle close above trendline & $3.50 zone
Target 1: $3.85
Target 2: $4.20–$4.40 (main reversal)
Invalidation: Close below $2.85 (QFL loss)
🚨 Final Thoughts:
TONUSDT is showing clear smart money footprints via the QFL formation and trendline pressure. The setup is ideal for MMC-based breakout traders waiting for confirmation before entering. Volume spike + trendline break will likely spark the next impulsive rally.
Stay patient, and trade the reaction, not the prediction.
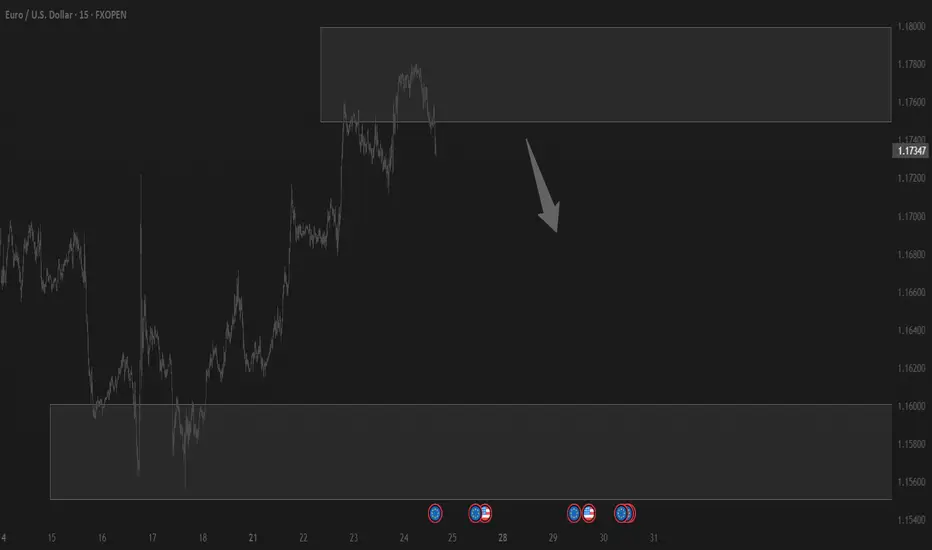
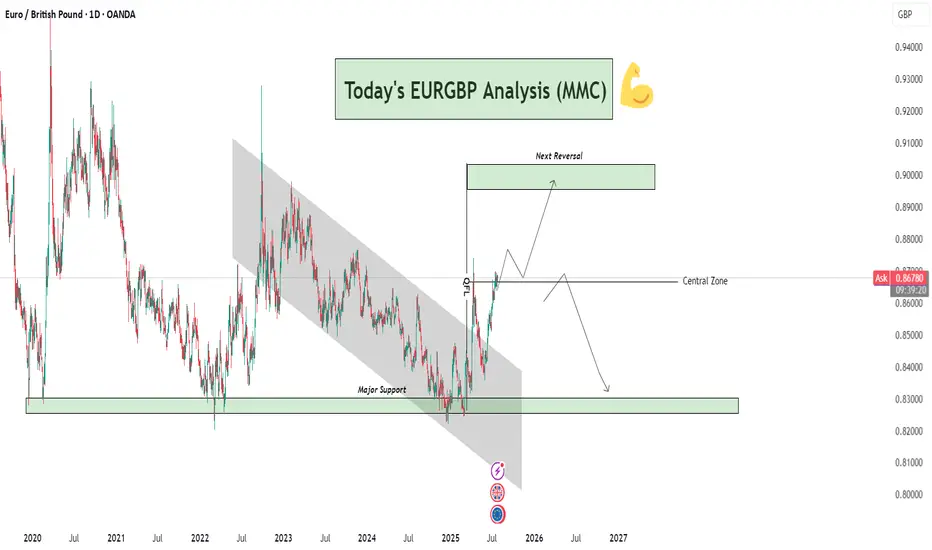
EURGBP Analysis : Breakout, Central Zone Flip & Reversal Target🧠 Overview:
This EURGBP daily chart clearly presents a bullish breakout from a long-term descending channel, a successful reclaim of the central structure zone, and a projection toward a key reversal level. This analysis incorporates Smart Money Concepts (SMC), Market Maker Concepts (MMC), and classic structural behavior.
🔍 Technical Breakdown:
📉 Long-Term Bearish Channel (2021–2025)
For nearly 4 years, EURGBP was trapped in a descending channel, forming consistent lower highs and lower lows.
This long-term bearish phase reflects strong supply-side control and institutional distribution.
The breakout above this structure is significant — marking a potential mid- to long-term trend reversal.
🔁 Major Support Zone (0.8300–0.8350)
Price bounced strongly from this historical demand zone multiple times (in 2021, 2022, and recently in 2025).
This zone is critical and acts as a high-volume accumulation area where smart money has stepped in.
The strong reaction from this level in 2025 triggered the breakout of the bearish structure.
🚀 Break of Structure + Retest
After breaking the descending channel, price retested the upper boundary, confirming a structure shift.
The breakout retest succeeded — marking the transition from a bearish phase to a bullish expansion.
📍 Central Zone Flip
The Central Zone, once a resistance/supply area during the downtrend, has now been reclaimed as support.
This is a powerful MMC concept – where the "central balance" of a structure flips and becomes a base for the next impulse.
Current price is sitting just above this zone, indicating bulls are still in control.
🎯 Next Reversal Zone (Target Area: 0.9000–0.9050)
The chart outlines a projected bullish move toward the Next Reversal Zone marked above.
This is a key supply area, likely to trigger profit-taking or institutional sell orders.
Expect price to range or wick into this zone before showing a possible bearish reversal.
🔄 Future Projection Scenarios:
Scenario 1 – Bullish Continuation:
Price continues to build bullish structure and approaches the 0.90 reversal zone.
Rejection from this zone may trigger consolidation or a minor retracement.
Scenario 2 – Major Reversal:
Upon hitting the next reversal zone, price could reverse and fall back toward the Central Zone or even the Major Support below, especially if macroeconomic fundamentals shift.
🔑 Confluences Supporting This Setup:
✅ Element 🧩 Description
🔹 Major Support Historical demand zone with repeated rejections
🔹 Channel Breakout Structure shift confirming bullish interest
🔹 Retest Success Technical confirmation of breakout validity
🔹 Central Zone Flip Old resistance → new support (MMC principle)
🔹 Reversal Zone Anticipated next profit-taking / supply area
📌 Strategic Insight:
Bias: Bullish short-term to mid-term
Entry Opportunity: Lower timeframe pullbacks into Central Zone (or retest zones)
Target: 0.9000–0.9050 area
Watch for Rejection: In reversal zone for potential bearish shift
⚠️ Risk Note:
Always wait for confirmation at reversal zones. Overextended moves without correction can quickly retrace. Manage your trades with stop-losses below key structural levels and maintain strict risk-reward planning.
🧠 Conclusion:
EURGBP has transitioned from a long bearish cycle into a bullish expansion phase. Smart Money accumulation at the base and a clean breakout with retest confirm a strong directional shift. Keep your focus on the Central Zone retests and the Reversal Zone reaction for optimal entries or exits.
pumpusdtGiven the current conditions and the distance that the price has taken from its volume and price value, I give the possibility of using these areas and ultimately using them at the end of the major movement step that has been identified, and as long as the price does not turn, I will continue my step buying.

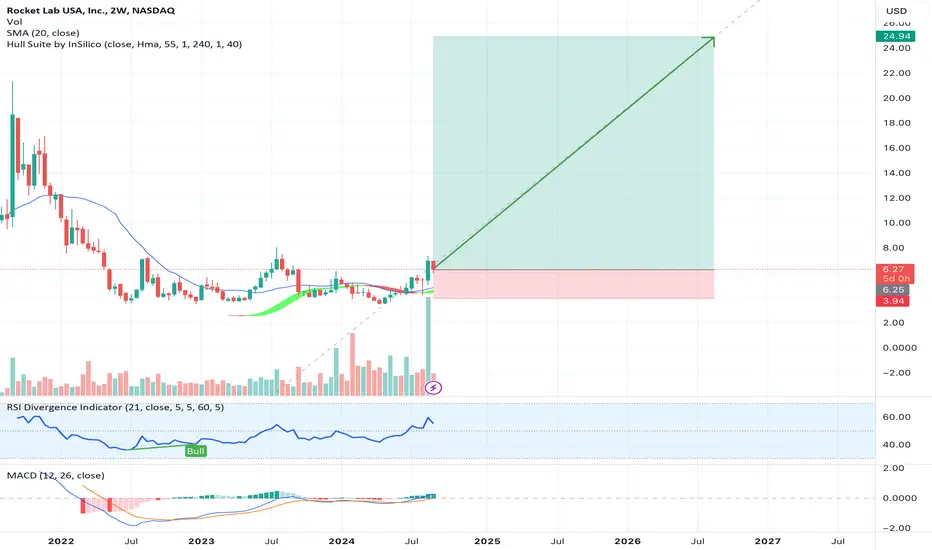
Rocket Lab to new all time highs as more things go to spaceRocket Lab build rockets. CEO has an extremely bright aura. Hard to find a better story-driven pure space play with SpaceX being private. I like Rocket Lab and invested because as more and more things fly and go to space, it has the wind at its back.