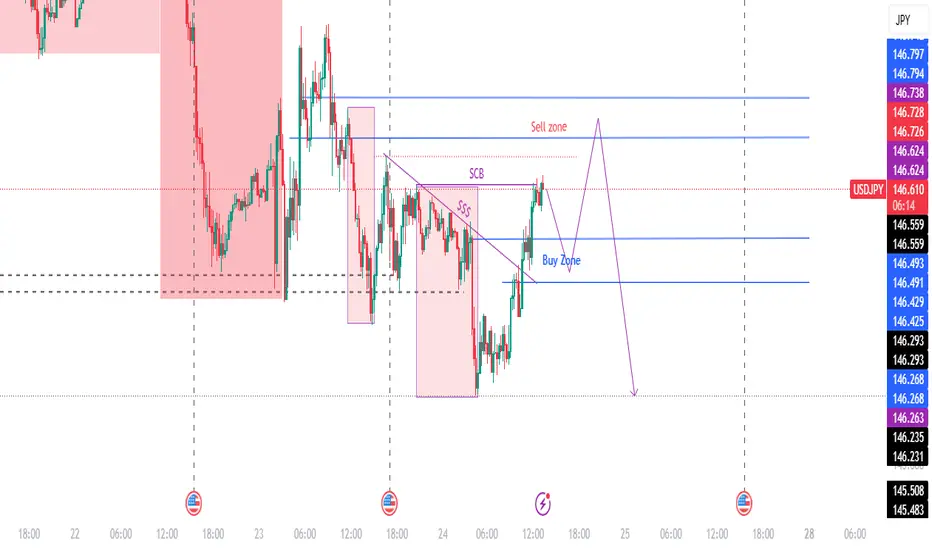
15M TEMPORARY BUY THEN BIG SELL15M SELL range change to BUY.
Retracement up to 146.40 - 146.30 (BUY ZONE)
If red dotted line 146.73 crossed, H1 SELL range confirmed and hence we will enter SELL ZONE (146.80 - 146.90).
NB: If dotted line crossed first before come to BUY ZONE, I wont BUY.
Beyond Technical Analysis
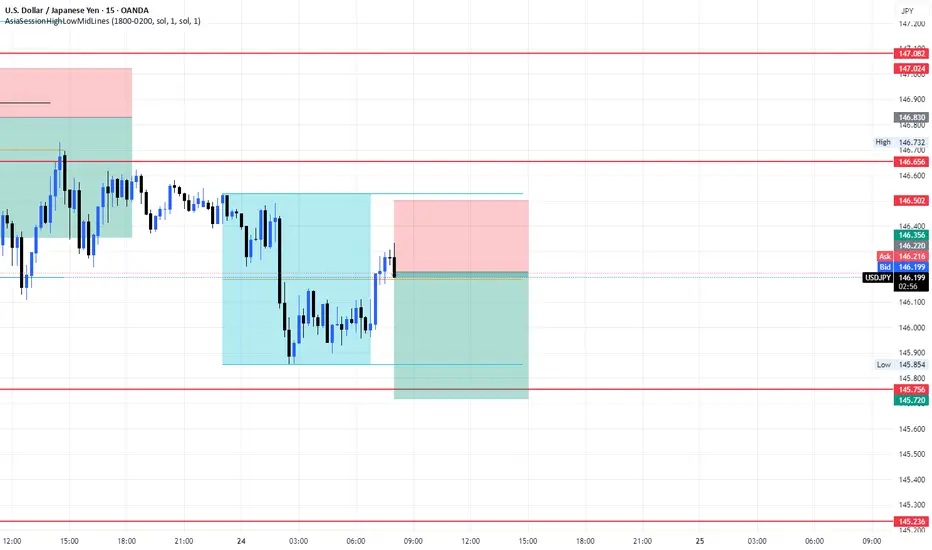
USDJPY short position 24/07/2025English : According to our analysis, we anticipate a bearish scenario.
Morocan Darija : kanchofo d'apres l'analyse dyalna antsanaw hboot
ATENTION : I only share my ideas, not signals
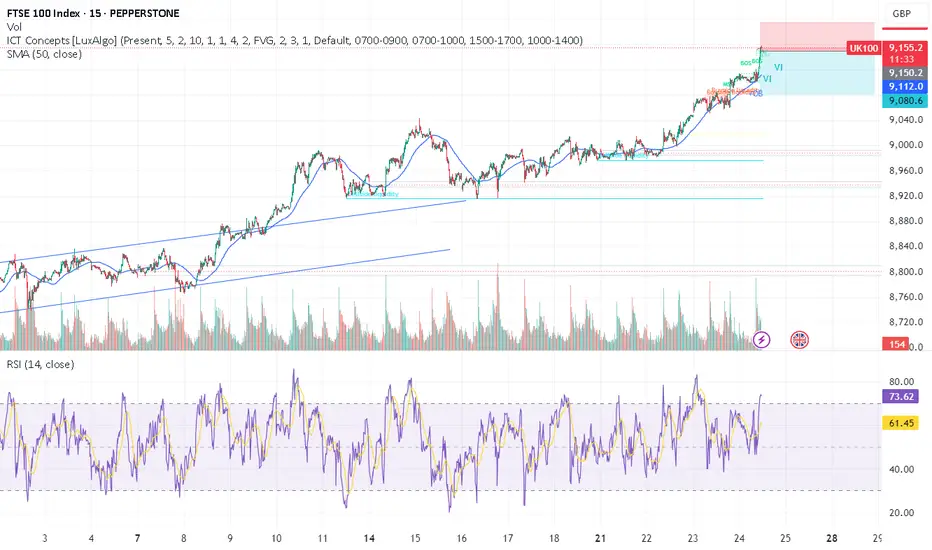
uk100 crazy pump - time to SHORTTeam, those who SHORT UK100, make sure stop loss at 9175
Target 1 at 9135-32
Target 2 at 9109-16
Last few months, UK100 has been aggressively cutting rate due to expose in recession. But now they are out of the wood.
The market has been over pricing and over value.
We expect the market to come down.
EV Stocks Are Back on Track: Who’s Got the Juice in 2025?This year is big for the EV sector so we figured let’s do a piece on it and bring you up to speed on who’s making moves and getting traction — both in the charts and on the road.
What we’ve got here is a lean, mean lineup of real contenders. Let’s go for a ride.
🚗 Tesla: Still King of the Road (for Now)
Tesla NASDAQ:TSLA isn’t just an EV company. It’s a tech firm, an AI shop, a robotaxi rollout machine, and an Elon-flavored media event every quarter. Even so, when it comes to margins, global volume, and name recognition, Tesla is still the benchmark everyone else is chasing.
In 2025, Tesla’s bounceback is fueled not just by EV hype but by its push into autonomous driving and different plays into the AI space.
The stock is down about 13% year-to-date. But investors love a narrative turnaround. Apparently, the earnings update didn't help the situation as shares slipped roughly 5%. Well, there's always another quarter — make sure to keep an eye on the Earnings Calendar .
🐉 BYD: The Dragon in the Fast Lane
BYD 1211 is calmly racking up sales, expanding across continents, and stealing global market share without breaking a sweat. The Chinese behemoth is outselling Tesla globally and doing it with less drama and more charge… literally .
Vertical integration is BYD’s secret weapon — they make their own batteries, chips, and even semiconductors. The West might not be in love with BYD’s designs, but fleet operators and emerging-market governments are. And that’s where the real growth is.
⛰️ Rivian: Built for Trails, Not Earnings (Yet)
Rivian NASDAQ:RIVN still feels like the Patagonia of EV makers — rugged, outdoorsy, aspirational. Its R1T pickup truck has cult status, but the company had to tone down its ambitions and revised its guidance for 2025 deliveries to between 40,000 and 46,000. Early 2025 projections floated around 50,000 .
The good news? Rivian is improving on cost control, production pace, and market fit. The bad news? It’s still burning cash faster than it builds trucks. But for investors betting on a post-rate-cut growth stock rally, Rivian may be the comeback kid to watch. It just needs a few solid quarters.
🛋️ Lucid: Luxury Dreams, Reality Checks
Lucid NASDAQ:LCID , the one that’ll either go under or make it big. The luxury carmaker, worth about $8 billion, came into the EV game promising to out-Tesla Tesla — with longer range, more appeal, and a price tag to match.
But here’s the rub: rich people aren’t lining up for boutique sedans, especially when Mercedes and BMW now offer their own electric gliders with badge power and a dealer network.
Lucid’s challenge in 2025 is existential. The cars are sleek, the tech is strong, but the cash runway is shrinking and demand isn’t scaling like the pitch deck promised.
Unless it nails a strategic partnership (Saudi backing only goes so far), Lucid could end up as a cautionary tale — a beautifully engineered one, but a cautionary tale nonetheless. Thankfully, Uber NYSE:UBER showed up to the rescue ?
💪 NIO : Battling to Stay in the Race
Remember when NIO NYSE:NIO was dubbed the “Tesla of China”? Fast forward, and it’s still swinging — but now the narrative is more about survival than supremacy. NIO's battery-swap stations remain a unique selling point, but delivery volumes and profitability are still trailing.
The company’s leaning into smart-tech partnerships and next-gen vehicle platforms. The stock, meanwhile, needs more than just optimism to get moving again — it’s virtually flat on the year.
✈️ XPeng: Flying Cars, Literally
XPeng’s NYSE:XPEV claim to fame used to be its semi-autonomous driving suite. Now? It's working on literal flying vehicles with its Land Aircraft Carrier. Innovation isn’t the problem — it's execution and scale.
XPeng is beloved by futurists and punished by spreadsheets. It’s still getting government love, but without a clear margin path, the stock might stay grounded.
🏁 Li Auto: The Surprise Front-Runner
Li Auto NASDAQ:LI doesn’t get the headlines, but it’s quietly killing it with its range-extended EVs — hybrids that let you plug in or gas up. A smart move in a country still building out its charging infrastructure.
Li is delivering big numbers, posting improving margins, and seems laser-focused on practicality over hype. Of all the Chinese EV stocks, this one might be the most mature.
🧠 Nvidia: The Brains of the Operation
Okay, not an EV stock per se, but Nvidia NASDAQ:NVDA deserves a spot on any EV watchlist. Its AI chips are running the show inside Tesla’s Full Self-Driving computers, powering sensor fusion in dozens of autonomous pilot programs, and quietly taking over the brains of modern mobility.
As self-driving becomes less sci-fi and more of a supply-chain item, Nvidia's value-add grows with every mile driven by data-hungry EVs.
🔋 ChargePoint & EVgo: Picks and Shovels
If you can’t sell the cars, sell the cables.
EV charging companies were once seen as the “safe bet” on electrification. Now they’re just seen as massively underperforming.
ChargePoint BOATS:CHPT : Still the leader in US charging stations but struggling with profitability and adoption pacing. Stock’s down bad from its peak in 2021 (like, 98% bad).
EVgo NASDAQ:EVGO : Focused on fast-charging and partnerships (hello, GM), but scale and margin pressures remain.
Both stocks are beaten down hard. But with billions in infrastructure funding still flowing, who knows, maybe there’s potential for a second act.
👉 Off to you : are you plugged into any of these EV plays? Share your EV investment picks in the comments!

EUR/NZD short scalp opportunityI am looking for a short scalp opportunity on EUR/NZD.
Only if this 1H FVG will form and hold.
I will look for downside momentum to short after a reaction from the 1H FVG
Target = previous day low, but after 2RR you can take partials.
I am not a financial advisor, and this is not financial advice. The information shared is for educational and informational purposes only and reflects my personal opinion and analysis. Please do your own research and consult with a qualified financial professional before making any trading or investment decisions. Trading involves risk, and you should never invest more than you can afford to lose.

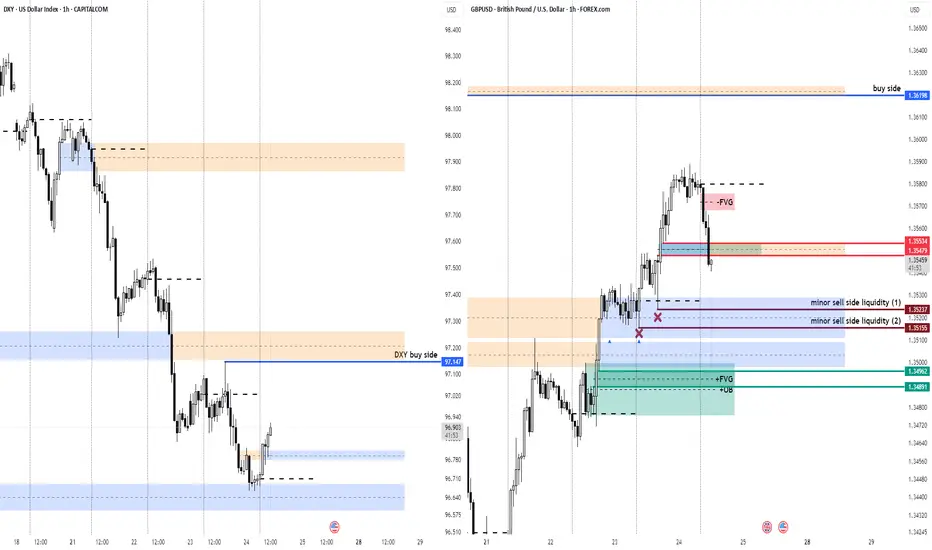
GBPUSD (Cable) – Retracement Potential as DXY ReboundsThe Dollar Index (DXY) is currently climbing out of an old inversion FVG, suggesting strength may continue short-term. This aligns with a likely retracement scenario for Cable, which has just traded into a bearish FVG and is beginning to pull back.
⚠️ I'm watching the minor sell-side liquidity zones at 1.3523 and 1.3515 for potential reaction points or even inducement setups. If price dips deeper, the 1.3496 FVG + OB zone may offer rebuy opportunities, depending on structure and displacement.
💡 Scalpers might find short-term setups on the retrace, but caution is warranted — narrative can flip quickly as we approach deeper liquidity zones.
If DXY continues higher toward the 97.147 buy-side, expect pressure on GBPUSD until that draw is satisfied.
USDJPY Structure Analysis – Liquidity Filled, Rejection + Target🧠 Overview:
This 2-hour chart of USDJPY highlights a clear bearish structure following a smart money-driven move. The price action reflects market maker behavior, liquidity manipulation, trendline rejections, and strategic zone targeting. Let's break down the key elements for today’s USDJPY analysis.
🔍 Key Technical Breakdown:
1. 🏦 Liquidity Grab & Fill (July 17th)
The marked green zone shows an aggressive liquidity sweep where the price dipped sharply into a previous demand zone, triggering stop losses and collecting institutional orders.
This movement represents a classic "liquidity fill", often engineered by market makers to trap retail buyers/sellers.
After sweeping liquidity, price quickly reversed upwards — a signal that large buy orders were triggered and filled.
2. 🎯 Central Zone as a Distribution Region
The market retraced to the "Central Zone", highlighted on the chart, which acted as a distribution area:
Price consolidated and created indecision before rejecting sharply again.
This zone reflects a short-term supply where institutional players may have offloaded positions.
Key clue: This consolidation occurred below the major trendline, increasing its strength as resistance.
3. 🔻 QFL Zones (Quasimodo Failure Levels)
Two QFL levels are marked, which denote structure breaks and retracements in MMC/SMC strategy:
First QFL marks a major support break – a signal of shifting market sentiment from bullish to bearish.
Second QFL confirms continued lower lows formation – solidifying bearish market structure.
These levels are critical in identifying market intent and anticipating future moves.
4. 📉 Descending Trendline Rejection
The descending trendline drawn from recent highs is being respected continuously:
Price tested the trendline multiple times but failed to break above.
These rejections represent seller dominance and validate the trendline as a dynamic resistance.
A break above this line would invalidate the current bearish structure.
5. 🎯 Next Target – Major Demand Zone (145.00–145.20)
Price is heading toward a major demand zone marked in green around 145.000:
This area is a strong buy-side liquidity zone, where institutional buyers may show interest again.
If this zone is tapped, we may see either:
A bounce (bullish reaction), or
A breakdown and continuation lower if bearish momentum continues.
Traders should monitor this area closely for price action signals (engulfing candles, rejection wicks, or bullish divergence).
🧠 Strategic View:
Bias: Bearish, unless trendline breaks with strong volume.
Ideal Entry: Look for short entries on lower timeframe pullbacks into minor resistance (like trendline or last supply zone).
Target Area: 145.00 – ideal zone to book profits or switch bias.
Invalidation: A break and close above the descending trendline + central zone.
🔑 Confluences in This Analysis:
Concept Details
✅ Liquidity Grab Trap & Fill strategy at prior lows
✅ Central Zone Bearish distribution and rejection
✅ Trendline Repeated resistance rejections
✅ Structure Lower lows and QFL confirmations
✅ Target Area Clear next demand zone identified
⚠️ Risk Note:
As always, wait for confirmation before entering trades. The market may fake out near zones. Use proper risk management (1-2% risk per trade) and adjust your strategy as new candles form.
📌 Conclusion:
This chart paints a textbook scenario of how institutional movements and structure-based analysis (MMC/SMC) can offer high-probability setups. We expect further downside toward the 145.00 region before any significant reversal. Keep an eye on reaction from this demand zone for the next play.

Tesla Shares (TSLA) Drop Following Earnings ReportTesla Shares (TSLA) Drop Following Earnings Report
Yesterday, after the close of the main trading session on the stock market, Tesla released its quarterly earnings report. While both earnings per share (EPS) and gross profit slightly exceeded analysts’ expectations, the results reflected a negative trend driven by declining sales. This decline is being influenced by intensifying competition from Chinese EV manufacturers as well as Elon Musk’s political activity.
According to Elon Musk:
→ The company is facing “a few tough quarters” due to the withdrawal of electric vehicle incentives in the US;
→ The more affordable Tesla model (mass production expected in the second half of 2025) will resemble the Model Y;
→ By the end of next year, Tesla's financials should become "highly compelling".
Tesla’s share price (TSLA) fell by approximately 4.5% in after-hours trading, clearly reflecting the market’s reaction to the report. Today, the stock is likely to open around the $317 level, down from over $330 just the day before.
Technical Analysis of TSLA Stock Chart
In our analysis of TSLA charts dated 2 July and 8 July, we outlined a scenario in which the stock price could form a broad contracting triangle, with its axis around the $317 level.
The new candlesticks that have appeared on the chart since then have reinforced the relevance of this triangle, as the price rebounded from the lower boundary (as indicated by the arrow) and headed towards the upper boundary. However, yesterday’s earnings report disrupted this upward move.
Thus, while the broader stock market is trending higher (with the S&P 500 reaching a historic high yesterday), TSLA may remain "stuck" in a consolidation phase, fluctuating around the $317 level—at least until new fundamental drivers shift market sentiment.
This article represents the opinion of the Companies operating under the FXOpen brand only. It is not to be construed as an offer, solicitation, or recommendation with respect to products and services provided by the Companies operating under the FXOpen brand, nor is it to be considered financial advice.

XAGUSD 23.07.25~+ Pressure on Powell, Waller is dovish
~+ Anticipation of the Trade deals deadline
~+ XAG didn't sell off immediately after the JP trade deal + XAUXAG downward breakout
+ Risk-on general sentiment after Japan trade deal

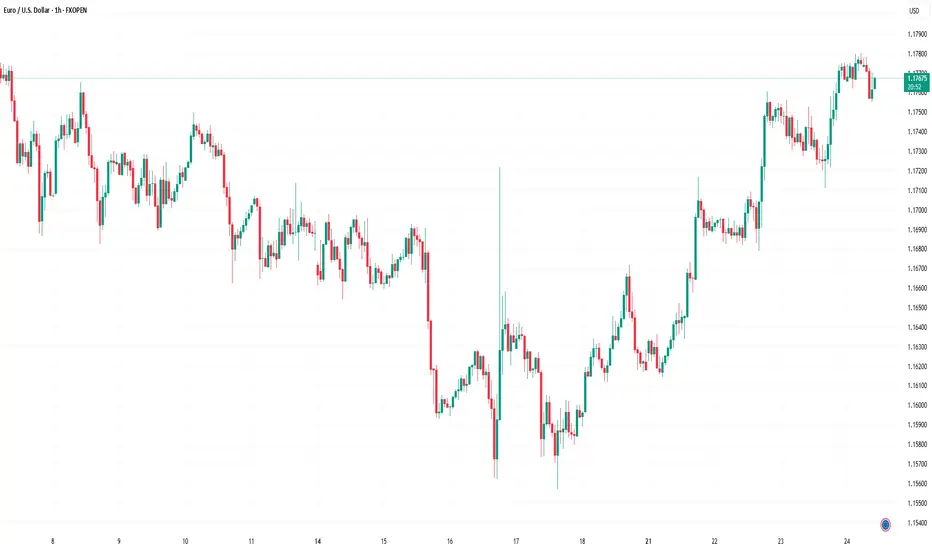
EUR/USD Rises to 2.5-Week High Ahead of ECB MeetingEUR/USD Rises to 2.5-Week High Ahead of ECB Meeting
Today at 15:15 GMT+3, the European Central Bank (ECB) will announce its interest rate decision, followed by a press conference at 15:45 GMT+3. According to Forex Factory, the main refinancing rate is expected to remain unchanged at 2.15% after seven consecutive cuts.
In anticipation of these events, the EUR/USD exchange rate has risen above the 1.1770 level for the first time since 7 July. Bullish sentiment is also being supported by expectations of a potential trade agreement between the United States and the European Union. According to Reuters, both sides are reportedly moving towards a deal that may include a 15% base tariff on EU goods entering the US, with certain exemptions.
Technical Analysis of the EUR/USD Chart
From a technical perspective, the EUR/USD pair has shown bullish momentum since June, resulting in the formation of an ascending channel (marked in blue).
Within this channel, the price has rebounded from the lower boundary (highlighted in purple), although the midline of the blue channel appears to be acting as resistance (as indicated by the arrow), slowing further upward movement.
It is reasonable to assume that EUR/USD may attempt to stabilise around the midline—where demand and supply typically reach equilibrium. However, today’s market is unlikely to remain calm. In addition to the ECB’s statements, volatility could be heightened by news surrounding Donald Trump’s unexpected visit to the Federal Reserve.
This article represents the opinion of the Companies operating under the FXOpen brand only. It is not to be construed as an offer, solicitation, or recommendation with respect to products and services provided by the Companies operating under the FXOpen brand, nor is it to be considered financial advice.
The Myth of Gold Reversals – Why Traders Keep Catching the KnifeGold is a master of deception.
It shows a clean wick into a zone, but reacts just enough to pull in early buyers or sellers — then rips straight through their stops like they weren’t even there.
The reversal looked real and the candles seemed perfect.
But the move? It was never meant for them.
This isn’t bad luck, but traders who survive aren’t trying to guess, they are the ones reading the reaction after the trap.
Let’s break down how these traps happen — and how Smart Money actually operates when XAUUSD is loading a real move.
🟥 Sell Trap – The "Instant Short" Mistake
Price pushes up into a clear reaction zone — maybe an OB, maybe an imbalance, a FVG, or a gap.
Structure looks stretched. Traders recognize a premium zone and decide it’s time to short.
The trap? Jumping in immediately on the touch, with no confirmation.
This is where Gold loves to trap sellers.
No M15 CHoCH/ BOS on M5 or real liquidity swept. Just a blind move and hope.
Price often pulls slightly higher — sweeping internal liquidity, triggering SLs — then shows a real rejection.
📌 Here’s what needs to happen before selling:
• First: look for a liquidity sweep (equal highs or engineered inducement)
• Then: price must shift — CHoCH or BOS on M15 or M5
• Finally: confirmation via bearish engulf, imbalance fill, or break + retest
• For experts: M1 can offer refined sniper triggers with minimal drawdown
💡 If none of this appears, it’s not a setup — it’s a trap.
🟩 Buy Trap – The "Wick Bounce" Illusion
Price taps a demand zone — again, a refined OB or imbalance, liquidity zone.
A long bullish wick forms. Some candles pause. It looks like a reversal.
But there’s no shift.Just hovering.
Many jump in long the second they see the wick. And then price breaks straight through.
📌 Here’s how to flip this trap into a real buy:
• Let price sweep liquidity below the zone — signs of a purge - true wick bounce
• Watch for a CHoCH or BOS on M15, M5, or even M1
• Look for a strong bullish engulf from the reactive level
• Confirm via imbalance fill or price reclaiming broken structure
📍 If all that happens — the trap becomes your entry.
If not? Stand down.
📊 What Smart Traders Actually Do Differently
They don’t chase wicks.
And never enter just because price tapped a line.
IT IS ALL ABOUT READING STRUCTURE AND PRICE ACTION.
Here’s how:
• Mark the highest probability reaction zones — above and below current price;
• Set alerts, not blind entries;
• Wait for price to come into their zone and then watch what it does there;
• Look for confirmation: CHoCHs, BOS, engulfing candles, FVG fills, clean rejections;
• And always keep one eye on the news — because Gold reacts fast and violently when volatility hits.
• Repeat this work daily until they learn how to recognize signs faster and more secure.
That’s the difference between chasing the reversal… and trading the move after the trap.
Because in this game, patience isn’t just a virtue — it’s survival.
And Gold? Well, XAUUSD has no mercy for those in a hurry and not studying its moves day by day, month after month and so on. Learn structure and price action even if you join any channel for help if you are serious about trading this amazing metal.
If this lesson helped you today and brought you more clarity:
Drop a 🚀 and follow us✅ for more trading ideas and trading psychology.

BTCUSD Analysis (MMC) : Dual Directional Outlook let's See🔍 1. Overview of Structure & Context:
On the 30-minute timeframe, BTCUSD is consolidating between two strong technical zones:
A descending trendline acting as resistance
A parallel rising support forming a compression zone
This wedge-like formation signals a potential high-impact move in either direction — a dual-directional outlook. Price is currently testing the midpoint between resistance and support, offering two reactive trade scenarios.
🟦 2. Key Zones Highlighted on Chart:
🔹 A. Parallel Support Zone (Dynamic Support):
A grey-shaded rising support has been tested multiple times.
Each bounce suggests buying strength near this diagonal zone.
This zone represents smart money accumulation potential under MMC concepts.
As price approaches this zone again, bulls are expected to step in if momentum aligns.
🔹 B. Descending Resistance Line (Supply Line):
The market is facing lower highs, a sign of bearish control at higher levels.
Each retest of this line has led to a rejection.
This line also acts as a liquidity magnet — price may spike above it to trap buyers before dropping (false breakout potential).
🧭 3. Scenarios and Trade Possibilities (Dual Directional Path):
✅ Scenario 1: Bullish Breakout – (Marked as Path 1)
If BTC breaks above the descending trendline with strong bullish volume, this confirms a structural breakout.
This setup targets:
First level: $119,600
Second level: $120,200
Once broken, the trendline can flip into support.
Ideal confirmation:
Bullish engulfing candle on breakout
Retest of broken resistance turning into support
Volume surge or momentum indicators turning bullish
⚠️ Scenario 2: Bearish Rejection & Breakdown – (Marked as Path 2)
If BTC fails to break resistance and breaks below the parallel support zone, it opens a bearish scenario.
Price may fall back to:
First level: $117,200
Final key support: $116,400 (Major Breakdown Zone)
This is a typical MMC-style mirror move: a structure break leading to liquidity run toward a previous demand zone.
Bearish confirmation:
Close below grey zone
Lower high formation near resistance
Increasing bearish volume / weak bounce
📐 4. Strategy & Trading Tips (MMC Application):
Under the Mirror Market Concepts (MMC), these zones are not just technical levels — they represent emotional price memory of both institutional and retail players.
Wait for the reaction, not prediction.
Use confluence tools (RSI divergence, volume, candle patterns).
Avoid trading inside the wedge — it's a trap zone.
Ideal entries are at breakout with retest confirmation or rejection from major zones.
📊 Risk Management Plan:
Entry Type Trigger Level SL Suggestion TP Range
Long Trade Break & retest above $118.8K Below $118.2K $119.6K → $120.2K
Short Trade Breakdown below $117.8K Above $118.2K $117.2K → $116.4K
🧠 Conclusion:
BTC is in a decision-making zone between a downward pressure line and strong support. A breakout could lead to a clean trend continuation, while a breakdown would trigger bearish momentum. The chart reflects precision MMC logic, offering a tactical map for day traders and scalpers to follow the smart money — not the noise.
Let the market decide direction. We just need to be prepared, not predictive.

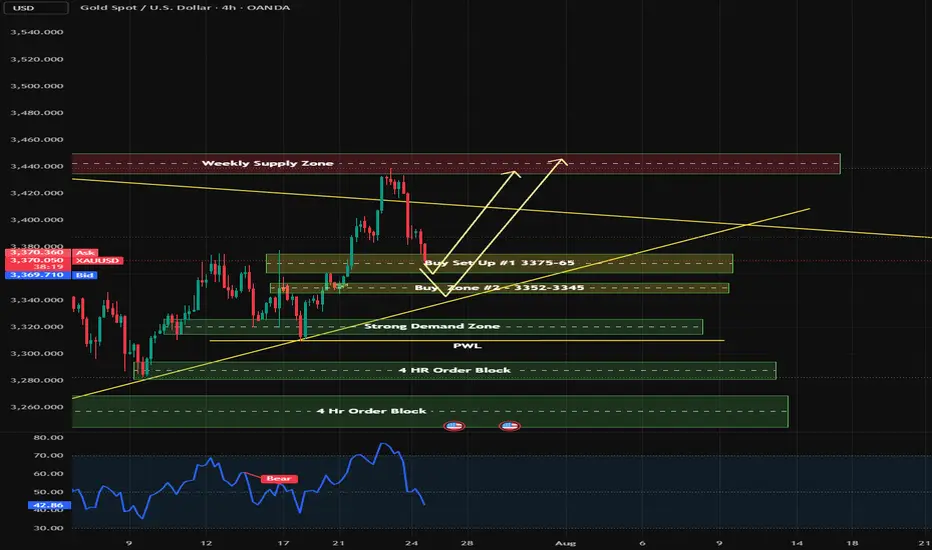
Gold - Week of 21st JulyWelcome to a new trading week. Price is compressing within a premium structure, boxed between clean supply and demand zones. While the overall trend remains bullish, momentum is clearly fading — so structure takes priority this week.
🟨 Weekly Bias: Neutral | Range-Bound Conditions
There’s no clear directional conviction on the weekly timeframe — we’re in a consolidation phase.
📊 Technical Overview & Strategy
We’re currently range-locked between:
Main Supply: 3380–3405
Main Demand: 3275–3250
Until either breaks decisively, we treat this as a two-sided market.
🔹 Weekly Key Zones
🔸 3365–3390 (Primary Supply)
Why it matters: Price was rejected cleanly from a previous weekly high (3377), aligning with a fresh Order Block (OB) and Fair Value Gap (FVG) from June.
Context: No bullish Break of Structure (BOS) above 3375. Repeated wick rejections indicate strong supply.
Game plan: If price returns, monitor M15–H1 for reaction. Consider shorts only if there's no BOS above 3390.
🔸 3430–3450 (Final Supply Barrier)
Why it matters: Unmitigated OB from a macro swing high — the final ceiling before bullish continuation.
Context: A clean BOS through this zone flips the larger structure bullish again.
🔸 3285–3260 (Key Demand Base)
Why it matters: Last untouched bullish OB + FVG combo from early July.
Context: No downside BOS yet. If price pulls back sharply, this zone offers a potential clean long from discount.
🔹 HTF Structure Summary
Trend: Still bullish (no BOS down), but compression under key resistance
Structure Range: 3390–3260
EMA Flow: Bullish, but extended — watch for pullbacks
RSI: Bearish divergence above 3350 — potential retracement brewing
🕯️ Daily Zones
🔸 Supply Zones
3380–3405 – Main Daily Supply / Liquidity Pool
Top of current range. Multiple upper wicks = rejection zone. Unless we get a daily close above 3405, this remains a trap for breakout buyers.
3355–3375 – Internal Supply / Inducement Block
Acted as a consistent ceiling post-CPI. Often triggers fake breakouts and quick reversals — ideal for fading strength.
🟢 Demand Zones
3312–3300 – Mid-Range Internal Demand
Reactive level post-CPI and NY session. Often used for stop hunts and intraday bounces.
3275–3250 – Main Daily Demand
Held firm as support all month. Every dip here has resulted in strong rallies. A daily break below flips the HTF bearish.
⏱ H1 Execution Map
🚩 SELL ZONES
3358–3370 – Primary Intraday Supply
Site of last week’s failed breakout. If price taps this and shows M15/M5 bearish momentum — it’s a sniper entry short.
3380–3395 – Upper Liquidity Trap
Classic fakeout zone. If breakout fails with a sharp reversal, it’s prime territory for “fade and dump” trades.
⚪ DECISION ZONE (Neutral / Pivot)
3335–3345:
A choppy, indecisive area. No clear OB or FVG. Avoid trading here — only observe and wait for clean setups on the edges.
🟢 BUY ZONES
3326–3332 – Primary Intraday Demand
Strong evidence of absorption + sharp reversals. Look for clean M15/M5 snapbacks — a reactive long setup.
3311–3320 – Deep Demand / Fear Zone
Sits below recent lows — ripe for liquidity sweeps. Only consider longs if a strong impulsive bounce follows. High risk, high reward.
Disclaimer: For educational context only.

Ethereum is Trending HigherSince April trough, Ethereum has risen by 179%, delivering a higher rate of return than Bitcoin at 66%. But most of our attention is on Bitcoin, breaking above the 120,000 level.
Why is Ethereum quietly gaining ground —and what does the future hold for Ethereum?
Mirco Bitcoin Futures and Options
Ticker: MET
Minimum fluctuation:
$0.50 per ether = $0.05 per contract
Disclaimer:
• What presented here is not a recommendation, please consult your licensed broker.
• Our mission is to create lateral thinking skills for every investor and trader, knowing when to take a calculated risk with market uncertainty and a bolder risk when opportunity arises.
CME Real-time Market Data help identify trading set-ups in real-time and express my market views. If you have futures in your trading portfolio, you can check out on CME Group data plans available that suit your trading needs tradingview.sweetlogin.com

Unemployment Claims Update🟡 Gold Update: High Volatility Pullback Nearing Resolution
Gold has recently exited a high-volatility phase. After plunging sharply from the 3438 high, price aggressively dropped to 3380, tapping deep liquidity within a high-confluence discount zone.
📉 GOLD MARKET UPDATE – JULY 24
Gold pulled back hard from 3438 → tapped deep liquidity at 3380. Volatility fading, but structure is key now.
🧠 Macro Check:
→ USD strength priced in
→ Powell = sticky inflation = risk asset caution
→ Eyes on tomorrow’s Jobless Claims + Durables
📊 Trend Outlook:
D1: Bullish (mid-range pullback)
H4: Bearish → trying to base at 3380
🔹 Demand Zones:
→ 3381–3391 ✅ tapped w/ OB reaction
→ 3364–3370 = backup zone
🔸 Supply Zones:
→ 3410–3416 = FVG fill
→ 3422–3428 = institutional OB + 61.8% Fib
📍 Structure Shifts (H1/M15):
→ M15 CHoCH ✅
→ Waiting for BOS > 3395 for confirmation
→ Early signs of accumulation near 3380–3390
🎯 Trade Setups
🟦 Bullish Play
→ Entry: 3381–3391
→ Confirm: M15 BOS > 3395
→ Target: 3410+
⚠️ Patience — no entry w/o confirmation
🟥 Bearish Play
→ Entry: 3416–3422
→ Confirm: M5 rejection + BOS
→ Target: 3395 / 3380
⚠️ Only valid if clean rejection — don’t fade strength
🧩 Fibs (3438–3380):
→ 50% = 3409
→ 61.8% = 3417
🔻 Reaction likely around these levels
📌 TL;DR:
We’re inside a high-confluence demand. M15 BOS above 3395 unlocks upside. Short only if 3422 rejects fast and clean.
AI called it, Bitcoin listened! Now, will BTC stay the course?My AI saw Bitcoin's path weeks ago, and it's playing out PERFECTLY!
Uptrend, check.
Sideways pause? Check.
This cutting-edge tool is rewriting how we trade.
But now the stage is set for suspense...will it stay the course? Can it continue to defy the odds?
Lets see
