RDDT Earnings Setup (2025-07-31)
### 🔥 RDDT Earnings Setup (2025-07-31)
📈 **Bullish Bias | Confidence: 75%**
🎯 Target: \$165+ | 🔒 Resistance: \$155.58
---
### 📊 FUNDAMENTALS
* 📈 **Revenue Growth (TTM): +61.5%**
* 💰 **Gross Margin**: 90.8%
* ⚠️ **Op Margin**: 1.0% (Thin runway)
* 💥 EPS Surprise Avg: **+191% (5/5 beat streak!)**
* 📉 EPS Growth Est: **-86.6%** → low bar = potential upside
**🧠 Fundamental Score: 7/10**
---
### 🧠 OPTIONS FLOW
* 🔵 **\$172.00C** building OI
* 💸 IV Rank \~0.75 (Move priced in!)
* 🧲 Bullish call activity > puts
* 🛡️ Put skew = hedged upside
**📊 Options Score: 7/10**
---
### 📈 TECHNICAL SETUP
* ✅ Above 20DMA
* 🔥 RSI: 62.2 = strength but not overbought
* 📦 Accumulation spike
* 🔐 Resistance: \$155.58
* 🧲 Break = squeeze setup
**📉 Technical Score: 8/10**
---
### 🌍 MACRO BACKDROP
* 🌐 Digital ad sector = support
* 🚨 Regulatory overhang = minor risk
* 🧬 Growth stock rotation helps RDDT
**🌐 Macro Score: 7/10**
---
### 🎯 TRADE IDEA
**💥 RDDT \$172.00C** (Aug 1 Exp)
* 💵 Entry: \$6.15
* 🎯 PT: \$18.45
* 🛑 SL: \$3.08
* 📈 Risk/Reward: \~3:1
* ⏱ Exit: 1–2 hrs post-earnings
* ⚖️ Sizing: 1 contract = \~\$615 risk
---
### ✅ SUMMARY
🧬 Strong rev growth + historical beat streak
🎯 Technical breakout setup + bullish flow
🚀 Potential squeeze toward **\$165+**
📣 Tag: #RDDT #EarningsPlay #OptionsFlow #RedditIPO #SwingTrade #TradingViewViral #EarningsSeason #TechStocks #CallOptions
Beyond Technical Analysis

AAPL EARNINGS TRADE SIGNAL (JULY 31)
### 🍏 AAPL EARNINGS TRADE SIGNAL (JULY 31) 🚀
📊 **AAPL Call Play** — Earnings Strategy
🧠 Multi-model conviction: **75% Bullish Bias**
---
### 🔍 Fundamental Drivers
✅ TTM Revenue: +5.1%
✅ Gross Margin: 46.6%
✅ 8 straight earnings beats
⚠️ Sector shift: growth → value = caution
📉 TTM EPS Est: \$8.31 (+29.4% growth est.)
🧮 **Score**: 8/10
---
### 💰 Options Flow Breakdown
🔥 IV Rank: 0.70
🔵 Bullish OI @ \$220C = 25,950 contracts
🔻 Skew: Heavy puts @ \$197.5 / \$200
⚠️ Gamma squeeze possible near \$220
📈 **Score**: 8/10
---
### 📉 Technicals
📍 RSI: 39.3 (Oversold)
📉 Trading below 20DMA (\$211.64)
🟥 Low volume pre-earnings = low conviction
📌 Support: \$207.5 | Resistance: \$220
📉 **Score**: 6/10
---
### 🌐 Macro Setup
⚠️ Supply chain pressures
⚠️ Regulatory risk ongoing
🔄 Growth → Value rotation still underway
🌐 **Score**: 5/10
---
### 🧠 Trade Setup (Call Option)
* 🎯 **Strike**: \$220
* 💵 **Entry**: \$0.87
* 📅 **Expiry**: 08/01 (2DTE)
* 📈 **Target**: \$2.61
* 🛑 **Stop**: \$0.43
* ⚖️ **Risk**: 2% of portfolio
* ⏰ **Timing**: Enter before close, report after market
🧮 Expected Move: ±5.0%
🔒 Confidence Level: 75%
---
### ⚙️ Exit Plan
✅ Profit: Exit @ \$2.61
❌ Stop: Exit @ \$0.43
🕒 Time Exit: Force close within 2 hours post-earnings
---
📣 **EARNINGS SCALP PLAY**
— AAPL is oversold w/ strong EPS beat history
— Bullish OI stacking at \$220
— High gamma setup, low IV risk = 💥
\#AAPL #EarningsTrade #CallOption #TradingView #0DTE #OptionsFlow #GammaSqueeze #UnusualOptions #AppleEarnings #SwingTrade #TechStocks

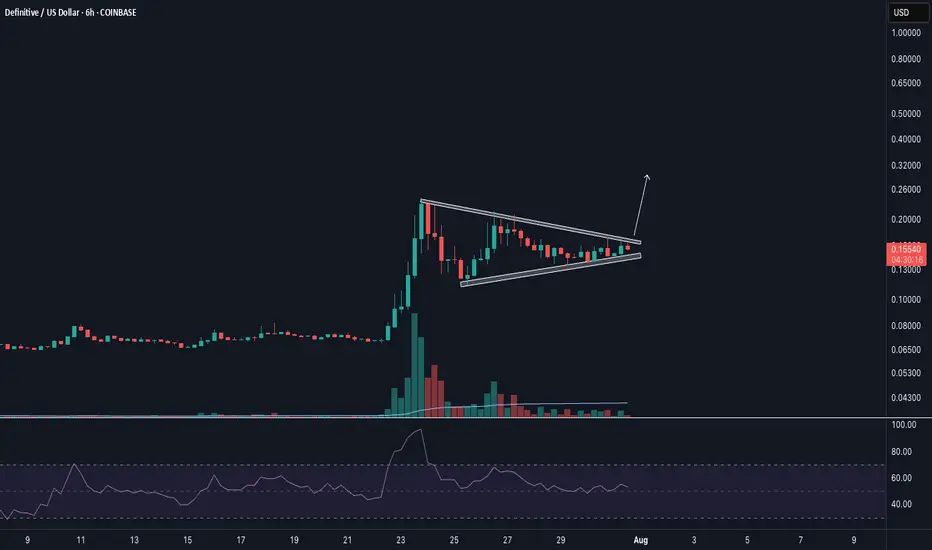
High Tight FlagDefinitive released an update to their trading product and a roadmap as well, which seemed to be well received by the market. Now developing a high tight flag on lower time frames. RSI reset.
Backed by Coinbase Ventures, among others
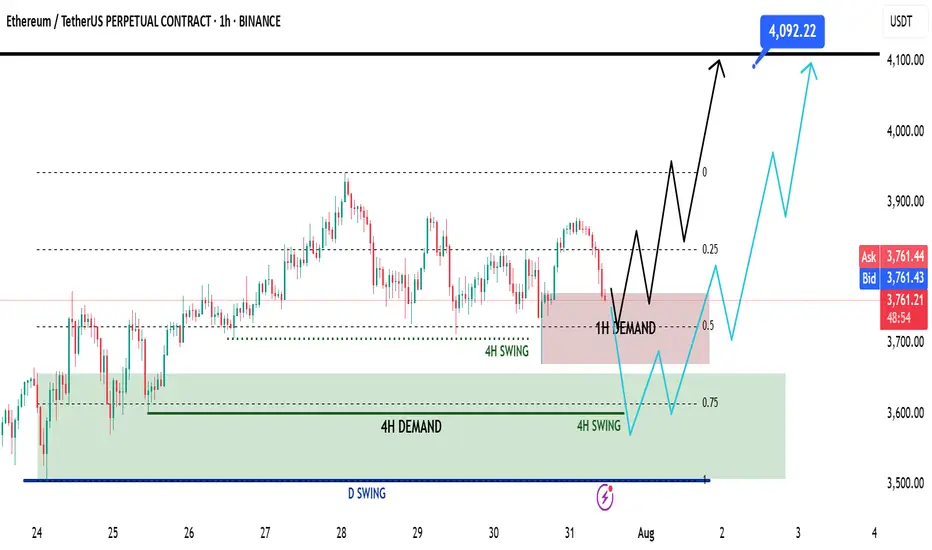
Ethereum Mid Week Update - Swing Long Idea📈 Market Context:
ETH remains in a healthy bullish structure. Despite the recent retracement, price action is still supported by strong demand zones on higher timeframes. No change in the overall sentiment from earlier this week.
🧾 Weekly Recap:
• Price rejected from the Fibonacci 0.5 EQ level — a discounted zone in my model.
• While doing so, it also ran 4H swing liquidity.
• After taking liquidity, ETH formed a 1H demand zone — a sign to look for lower timeframe confirmations for long setups.
📌 Technical Outlook:
→ Price has already tapped into the 1H demand zone.
→ From here, we have two possible scenarios:
Black scenario (ideal):
• Wait for 15M bullish break of structure (BOS).
• Enter after confirmation for long setups from 1H demand.
Blue scenario (deeper retrace):
• If no bounce from 1H demand, expect price to dip toward 0.75 Fib level (max discount).
• Watch for another liquidity run & 1H–4H demand formation.
🎯 Setup Trigger:
✅ 15M bullish BOS inside 1H or 4H demand zones
→ This would be the entry confirmation trigger for longs.
📋 Trade Management:
• Stoploss: Below the swing low of the 15M BOS
• Target: 4090$
💬 Like, follow, and drop a comment if this outlook helped — and stay tuned for more setups each week!
Berkshire Hathaway looks appealing in todays market conditionsWith most markets at all time highs it is becoming increasingly difficult to find good opportunities for buying. I have decided to allocate about 9% of my portfolio to Berkshire Hathaway as a sort of hedge against some of my other positions. I like to have a diverse exposure to the markets and with Berkshire Hathaway being a conglomerate it is a perfect stock for someone like me to invest in. The stock seems to be doing the opposite of the us500 so far this year hence why I call it a hedge. According to my simple technical analysis there is a probability for the stock to make a reversal after spending some time going down.
The company has already donated plenty of shares which probably has something to do with it going down, which presents a unique opportunity to invest in it since there is nothing fundamentally wrong with the company. With that being said they have also said they probably wont engage in share buy backs until next year at least so it could be a falling knife type situation. However I am confident in the company and feel like it is a great stock to have in my portfolio for the long term.
The range of the intrinsic value according to the discounted cash flow model is between $400-$1000 with a 5 year exit. Assuming a 7.4% discount rate the intrinsic valuation for the stock is $575 presenting a unique opportunity for a 20% upside. The stock is certainly undervalued but like I said it could be a falling knife in the worst case scenario. Calculating the intrinsic value is highly speculative and complex, but it gives me increased confidence in my decision to push the buy button. I hope you found my analysis useful, drop a comment if you want to talk more about the stock or whatever.

Full review of my NY basket and trading ideas for todayFull analysis and trading ideas for todays NY session for DXY, Silver, Gold, WTI, NAS, S&P, DJ30

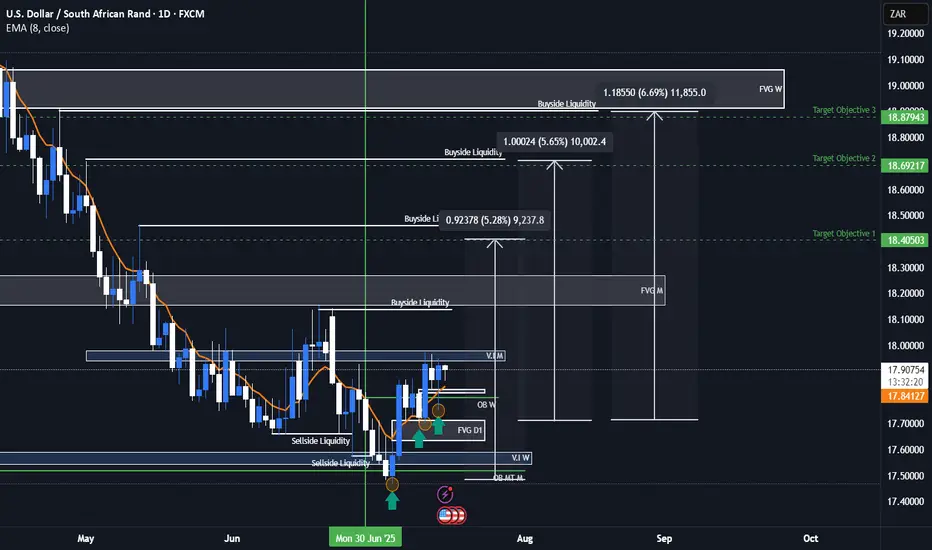
USDZAR Bullish ideaAs we can see this is our USDZAR quarterly shift idea were we are anticipating price to rally to the upside toward our draw on liquidity objectives. We had a weekly volume imbalance and monthly mean threshold order block show us support after we took out major liquidity points. We also showed more support on our daily FVG and a market shift taking place after a displacement. We are anticipating a rally for USDZAR and will be looking to see how price plays out.
USDZAR is an exotic pair that is part of the emerging markets and emerging markets/exotic pairs can usually lead ahead of major forex pair or lag between major forex pairs so this can also help us with our intermarket analysis of forex pairs when determining our dollar strength against other basket currencies.
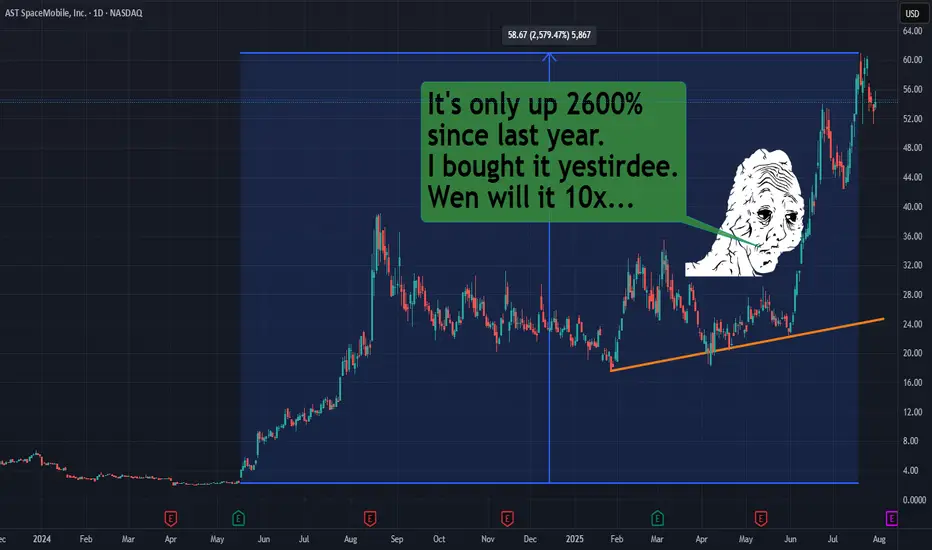
ASTS | Starlink ain't the only game in space no mo!This stock NASDAQ:ASTS is only up like 2600% in a year. That's like nothing. Might as well be losing that paypah.
Yes, it will swing more wildly than a chimpanzee from a vine. And yes my chart is probably effed as heck, but I'm looking for beyondosphere type of returns.
Is there room for more than one big f***y boom batty space phone company? Elon, scoot your bumbie over and let ASTS get in on that space rocket seat.
Play here is direct-to-cell calls between satellites and cell phones. Starlink probably has the advantage like the tide rolling over middle state a&m community college, but just like there was room for many phone companies in the last decades, there will be room for multiple space junkie phone companies.
You will not get rich because you will not HODL!
Live long and prosper. This is not financial advice. I JUST LIKE THE STOCK.
THANK YOU FOR YOUR ATTENTION ON THIS MATTER
SPX ShortElite Analysis
Trade took previous high.
Market gave me a 30m BOS
Identified internal LP
Received confirmation on the 10m and 1m.
Executed off the 1m.
Targets lower LP's

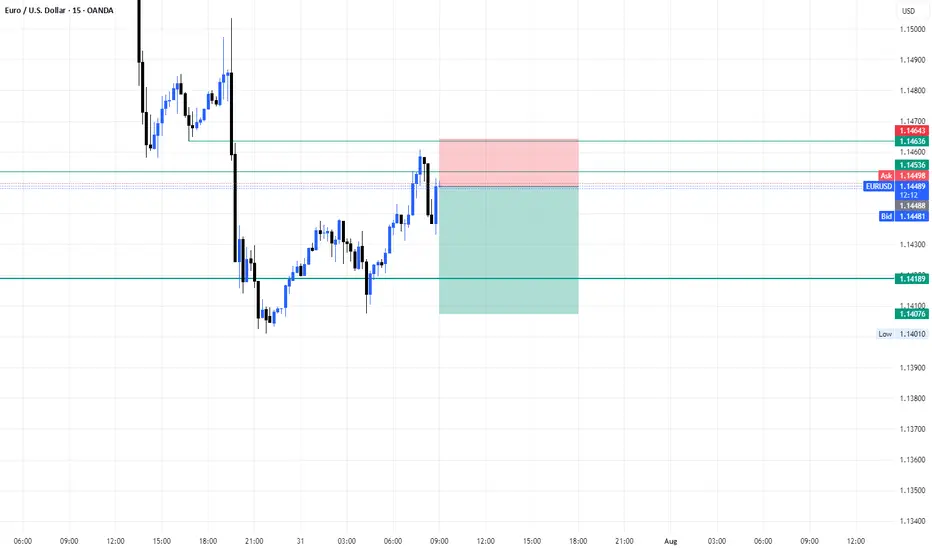
EURusd short position 31/07/2025English : According to our analysis, we anticipate a bearish scenario.
Morocan Darija : kanchofo d'apres l'analyse dyalna antsanaw hboot
ATENTION : I only share my ideas, not signals
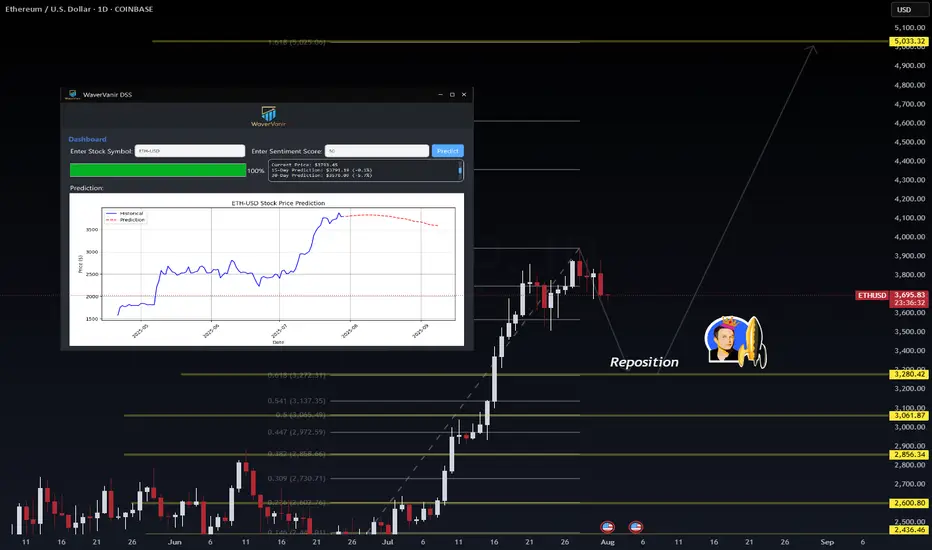
ETH Reposition Play – VolanX DSS Sentiment Filter Active📉 ETH Reposition Play – VolanX DSS Sentiment Filter Active
🧠 VolanX DSS Triggered a Long Watchlist Signal
The ETH/USDT daily chart shows price stalling near the 0.786 Fib zone after a strong rally. Our proprietary DSS (Decision Support System) now monitors sentiment misalignment to prepare for the next institutional push.
🔍 Key DSS Observations:
Retail Sentiment: Fearful — retail bias flipped to short.
News Headlines: Negative — VADER sentiment ≈ –0.45.
Funding Rates: Flipped to negative across major exchanges.
Fear & Greed Index: 28 (deep fear zone).
📊 All 4 signals confirm contrarian long opportunity in “Reposition Zone” (≈ 3566–3280). Smart Money often absorbs panic exits before triggering the next leg.
🎯 DSS Strategy:
✅ Wait for confirmation at 3,280 or wick flush to 3,061.
📈 Potential upside target = 5,033 (1.618 Fib extension)
🛡️ DSS Sentiment Filter = ✔ Passed (4/4 bearish crowd indicators)
“When the crowd panics, liquidity positions. VolanX knows this.” – WaverVanir Protocol
📡 Signal monitored via VolanX Alpha Engine
🔒 Institutional tracking | AI-guided logic | DSS Probability Matrix
#ETH #Ethereum #Crypto #WaverVanir #VolanX #SmartMoney #SentimentTrading #AlphaProtocol #DSS #Reposition
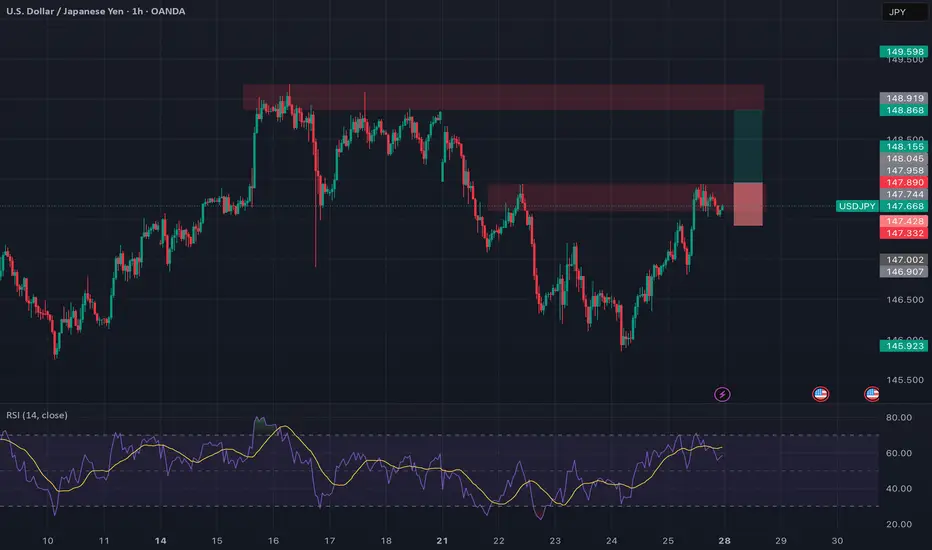
USDJPY: Breaking Out With Macro Backing 🟢 USDJPY | Breakout Opportunity Above Resistance
Timeframe: 1H
Bias: Bullish
Type: Break and Retest
📊 Technical Setup
USDJPY is currently consolidating at a key 4H resistance zone (147.75–147.90). A clean breakout and retest of this area will confirm bullish continuation.
• Entry: Above 147.90 (after confirmed candle close + retest)
• SL: Below 147.30
• TP: 148.90 / 149.60
• RR: ~1:2.5
• Indicators: RSI showing strong upside momentum, holding above 50
🧠 Fundamentals + Macro Confluence
• USD Strength: Strong macro & delayed rate cuts support USD upside
• JPY Weakness: BOJ remains dovish; risk-on sentiment weighing on JPY
• COT + Conditional Score: USD score increased to 17, JPY dropped to 8
• Risk Sentiment: VIX at 14.2 = RISK ON → bearish JPY bias
🧭 Gameplan
“Wait for confirmation above resistance before entering”
🔔 Set alerts around 147.90 and monitor lower timeframes for retest and bullish candle structure.
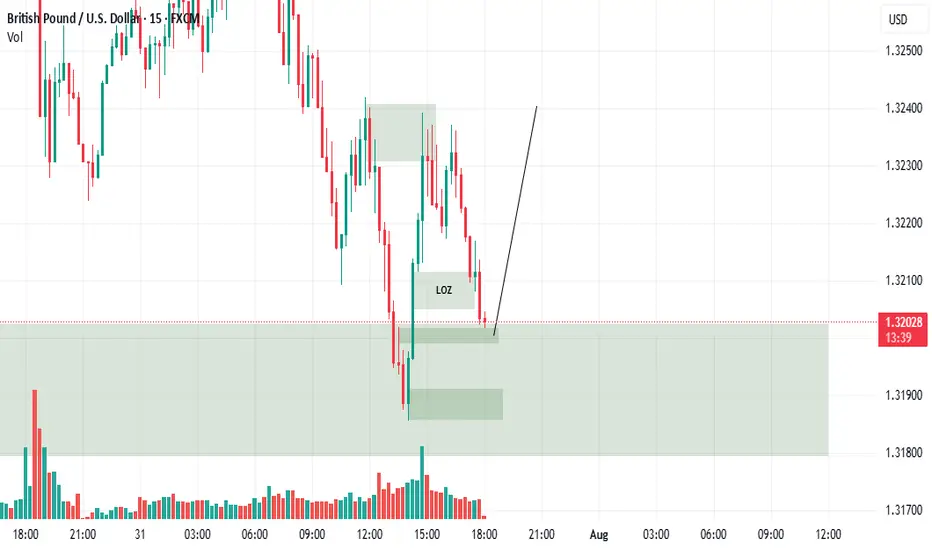
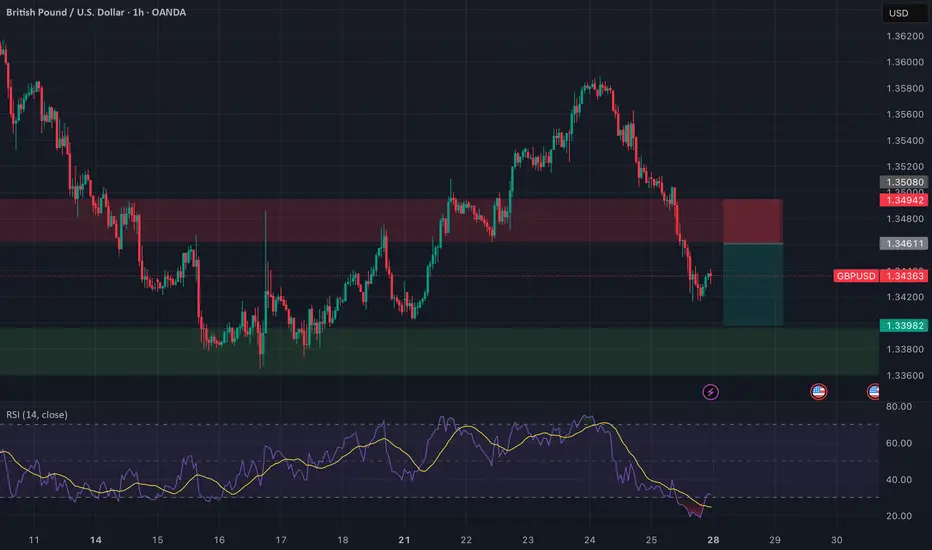
GBPUSD: Selling the Retest | Clean Break, Wait for Confirmation🔻 GBPUSD | Sell the Retest of Broken Support
Timeframe: 1H
Bias: Bearish
Type: Break and Retest
📊 Technical Setup
GBPUSD has broken a key 4H support zone (~1.3460–1.3494) which now acts as a turncoat resistance. Price is currently pulling back, offering a prime opportunity to sell the retest.
• Entry: 1.3460–1.3490 (after confirmation of rejection)
• SL: Above 1.3508
• TP: 1.3398
• RR: ~1:2
• RSI: Bearish momentum, RSI < 50 with mild recovery—ideal for a fade trade
📉 Macro & Fundamental Confluence
• GBP: Despite hawkish BOE tone, GBP is showing technical weakness and soft CFTC positioning
• USD: Strong macro bias with rising conditional score and delayed Fed cuts (still supporting USD strength)
• Seasonal Bias: GBPUSD marked bearish in seasonal chart
• COT Data: GBP positioning turning bearish after previous net build-up
🧭 Gameplan
“Wait for the retest of broken support-turned-resistance to reject before entering short. Stick to the zone.”
🔔 Set alerts around 1.3460–1.3490 and monitor for bearish engulfing or pinbar confirmation.
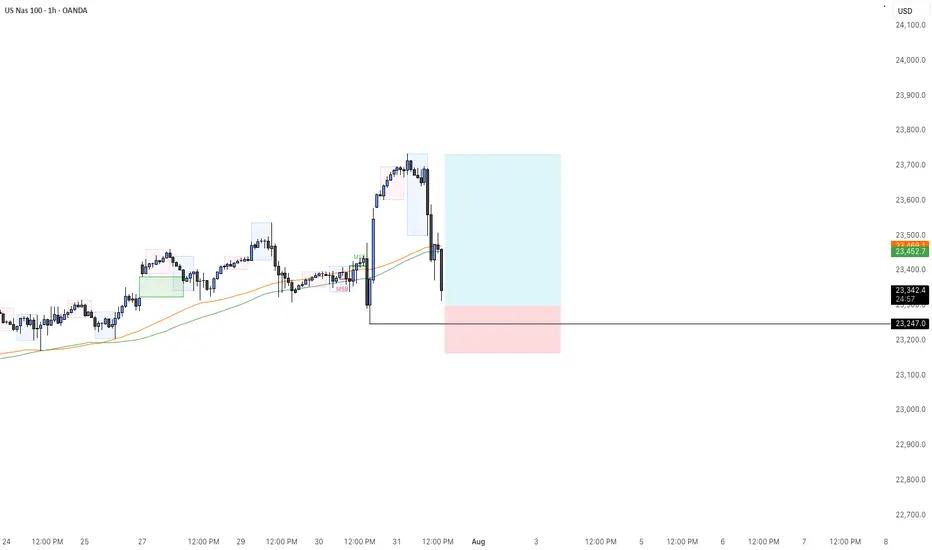
NAS100 - BUYHuge drop as expected today. Now that we are reaching its key level of interest, I will wait for a buy confirmation to take our last nights highs.
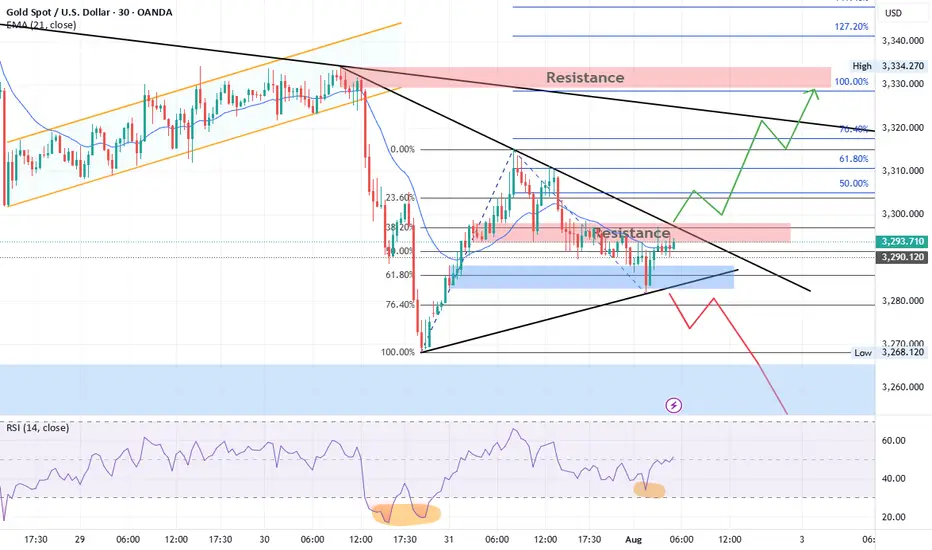
Gold Technical Outlook
Gold is currently consolidating inside a triangle pattern. After a recent bullish rally, price retraced between the 61.8% – 76.4% Fibonacci levels, finding support and bouncing upward. At present, gold is facing resistance at both the falling trendline and the 3298–3300 zone.
Bullish Scenario:
A breakout above the resistance trendline and the 3298–3300 zone could trigger a strong bullish move toward 3311, 3322, and 3333. A sustained break above 3333 would confirm a short-term bullish trend, opening the way for higher targets at 3360 and 3400.
Bearish Scenario:
If price faces rejection from the 3300 resistance and the falling trendline, gold is expected to move lower, retesting 3270. A decisive break below 3270 may extend the decline toward 3250. If 3250 is broken, gold could enter strong bearish momentum, potentially shifting the long-term trend to the downside with targets at 3000 and 2850.
OANDA:XAUUSD Gold Technical Outlook
GOLD (XAUUSD) -Monthly Analysis & Trading Plan (Aug 2025)GOLD (XAUUSD) -Monthly Analysis & Trading Plan (Aug 2025)
Title: XAUUSD: Correction in Progress, Patience is Key for the Next Move
Chart: XAUUSD Monthly (1M)
Analysis Type: ICT/SMC, Price Action, & Moving Average
Summary:
After a historic and powerful bull run that saw Gold (XAUUSD) breach all-time highs in the first half of 2025, the market has entered a significant corrective phase. The massive red candle in June signaled a strong reversal of momentum, and the current July candle confirms that sellers remain in control, albeit with less intensity. This is a critical juncture for long-term traders, and a strategic approach is required.
Key Observations & Analysis
1. **Price Action & Market Structure:**
The move from late 2024 through May 2025 was a textbook "impulsive leg." The sharp reversal in June 2025, with a powerful bearish candle, likely acted as a **liquidity grab** or a **high-volume distribution event**, trapping late buyers. The market is now in a clear **break in market structure (BOS)** to the downside on this long-term timeframe, suggesting the correction is not over.
2. **ICT/SMC Concepts:**
* **Imbalance/Fair Value Gap (FVG):** The rapid bullish move created significant imbalances on the monthly chart. Price often returns to fill these gaps. The current correction is likely heading to fill or test these inefficiencies.
* **Order Block (OB):** The massive bullish move in late 2024/early 2025 likely created a strong bullish order block. The current sell-off is heading toward this potential institutional demand zone.
* **Liquidity:** The lows from late 2024 and early 2025 will be key liquidity pools. Smart money will likely be targeting these areas for a potential reversal or accumulation.
3. **Moving Average Analysis (MMA):**
* The price is currently trading above both the purple and yellow moving averages, which are still pointing upward. This confirms the long-term trend remains bullish, and the current move is a correction within that trend.
* The **purple moving average** is a key support level to watch. A test of this level would be a high-probability event, and its reaction will be crucial for the next major move.
Suggested Entry & Exit Levels
1. Aggressive Entry (Short)
Rationale
The bearish momentum, though slowing, is still the dominant force. An aggressive trader could look for a continuation of the short-term bearish trend.
Entry/b]
A short entry could be considered on a pullback to the recent highs around **$3,400 - $3,500** if a strong bearish candlestick pattern forms on a lower timeframe (e.g., weekly or daily).
Stop Loss
A tight stop-loss placed just above the recent high, for example, **$3,600**. This is a high-risk entry, so position sizing should be small.
Target
The first major target would be the **moving average support level**, roughly in the **$3,000 - $3,100** zone. The ultimate target for a full correction would be the order block from late 2024, around **$2,800**.
2. Conservative Entry (Long)
Rationale
The long-term trend is still bullish. The current move is a correction. The most prudent approach is to wait for a high-probability long entry at a key support level.
Entry/b]
Wait for price to reach the **purple moving average support zone (around $3,000 - $3,100)**. Look for a clear reversal signal on this level, such as a large bullish "pin bar" or "engulfing candle" on the monthly or weekly chart. This would be a high-probability demand zone for a reversal.
Stop Loss
A stop-loss should be placed below this key support level, perhaps around **$2,850 - $2,900**, giving the trade room to breathe.
Target
The first target for a new bullish leg would be the New swing high around **$3,800**. The ultimate long-term target would be a new all-time high above **$4,000**.
Conclusion
The Gold market is in a crucial phase. The bullish party from earlier in 2025 is over for now, and a healthy correction is underway. **The most logical and safe approach is to wait for the market to complete its corrective move.** Do not attempt to catch a falling knife. Instead, be patient and wait for price to reach a key institutional demand zone (our moving average support or the late 2024 order block) and show a clear sign of reversal. This will present a high-probability, low-risk long entry for the next impulsive move up.
Disclaimer
This is not financial advice. Please perform your own due diligence and risk management. Trading involves a significant risk of loss.

$NVDA ~ An Elliott Wave Breakdown.Earlier in the main wave, our Wave 2(Black) was a Zigzag hence a Flat was expected for Wave 4(Black). Wave B(Blue) closed beyond Wave 3(Black) and our Wave 4 made a 5 wave move(Shown in Red) that retested at the 261.8% Fib. level. With Wave C(Blue) complete, it was coined Wave 4(Black). Wave 5(Black) was launched and has a 5 wave move shown in Green. With a Zigzag for Wave 2(Green), a Flat should be expected for Wave 4(Green). Wave 3(Green) has 5 waves with a triangle for Wave 4(Blue). A confirmation at its current location(423.6% Fib. level) would mean that Wave 3(Green) is complete and a Wave A(Black) of the previously mentioned Flat should be anticipated. Please check my detailed breakdown for a broader perspective into the same.
NB: The placement of Wave A(Black) of the Flat mentioned above is purely for demonstrative purposes.

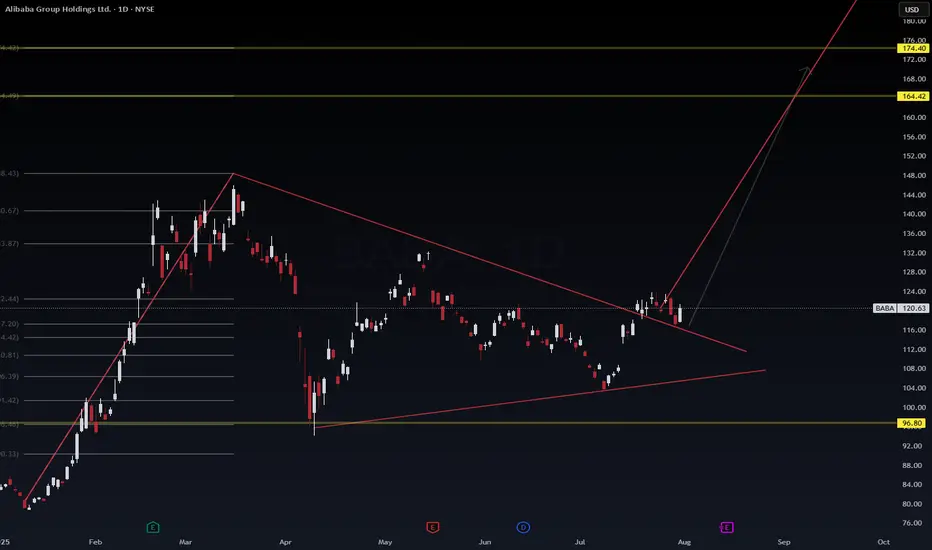
BABA: We have a bounce but is it temporary? Too many questions but dss forecasts a price growth near-term on ticker symbol $BABA. We will see where it goes. Another one on the watch is NASDAQ:PDD
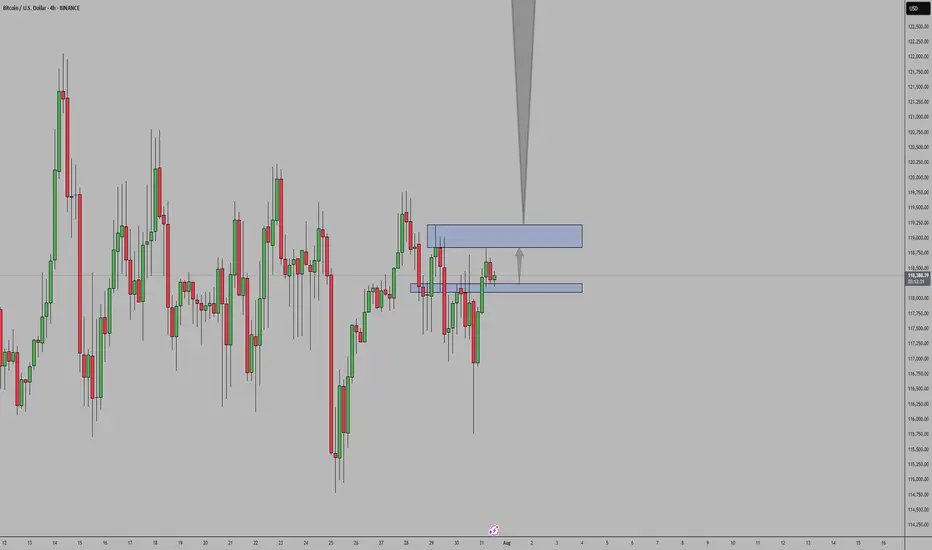
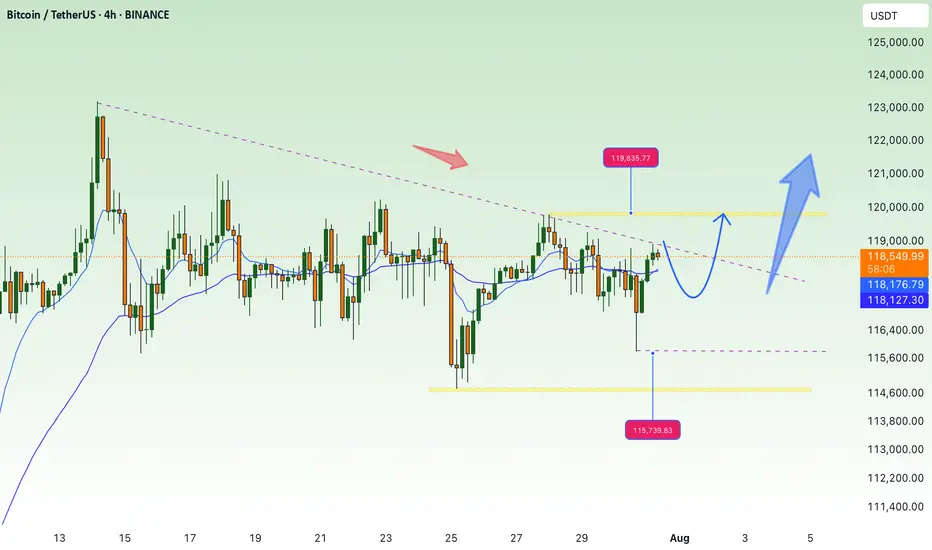
Accumulate waiting for btc price increase💎 BTC PLAN UPDATE – End of July (31/07)
📊 BTC Technical Analysis (4H Timeframe – End of July)
✅ Positive Signals:
• BTC has broken out of the consolidation triangle pattern (blue diagonal line), indicating a potential strong uptrend.
• The current price is retesting the breakout support zone around 117,800–118,000 → showing a good reaction and creating upward momentum.
• MA50 and MA200 are starting to slope upwards → confirming increasing buying strength.
📈 Bullish Scenario:
• If BTC holds above 118,000, it is likely to move toward the nearest resistance zone at 119,900.
• After breaking 119,900, the next targets are:
→ 122,792 (Fibonacci 1.618)
→ Further target: 127,900 (Fibonacci 2.618)
🛑 Risk Note:
• If the price drops below 117,000, it’s important to monitor again, as it may retest a deeper support zone around 114,500.
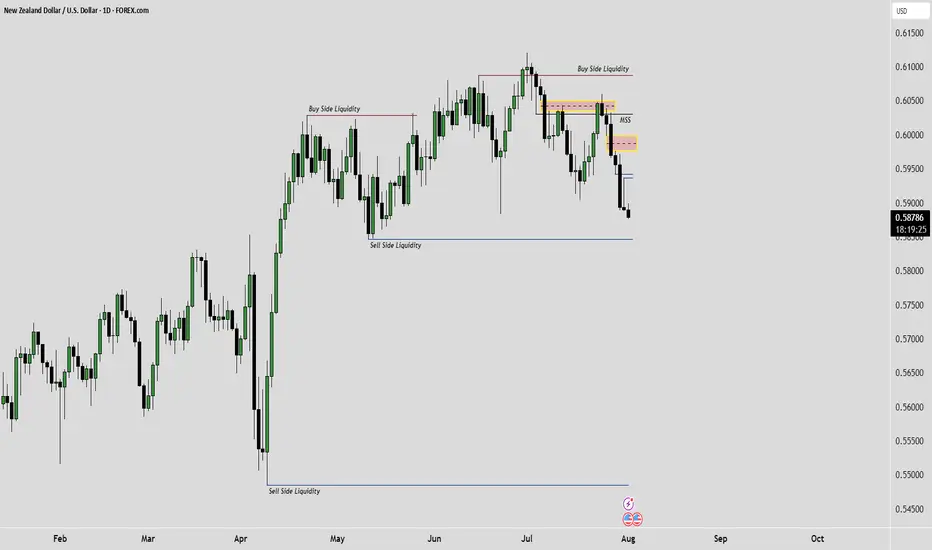
Seeking the nearest Sell SideThe image speaks for itself
this is an ict concept idea and from experience work that I have done over 7yrs
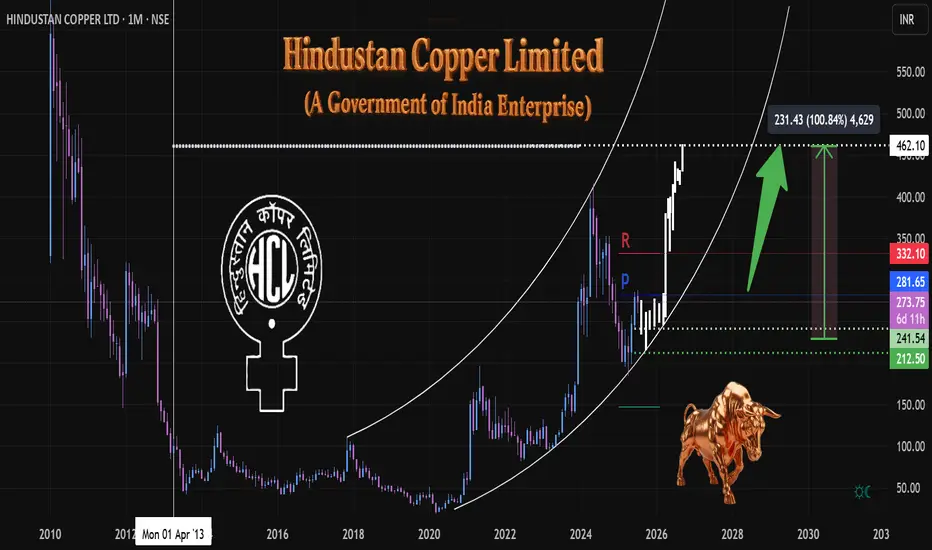
HCL Copper 1M, TF Anticipating Growth & Key Levels ⚙️ Materials: Commodity Cycle Turnaround
(Green energy metals, China recovery)
Government of India Enterprise
Hindustan Copper Limited (HCL)
The company is undergoing a significant mine expansion, projecting a 5x increase in output. This positive development is already reflected in institutional interest, with DIIs increasing their exposure by 8.2% in Q1.
At the time of this analysis, the price stood at 273.
We've observed a volume climax at the bottom, suggesting a potential exhaustion of selling pressure and a base formation.
The white ghost candles pattern illustrate an anticipated future price path, which I project based on current market dynamics and patterns. This projection outlines a potential trajectory we will monitor closely as price develops.
A strong engulfing bullish candle formation above the 281 pivot (🔵) would signal significant bull strength and confirm a strong upward momentum.
A confirmed breakout above the monthly resistance level (🔴) would be a critical bullish signal. initiating further long positions upon a successful retest of this breakout level.
My primary accumulation zone for potential entries is identified in green (🟢 dotted), ranging between 241 and 212. This range represents an area where I anticipate favorable risk-reward for entry.
Target & Time Horizon:
While precise timing is always challenging, I estimate the projected target up to 100% ( above in the white dotted line) could be reached around Q2 2026 or before as markets perform.
Disclaimer:
This analysis represents a personal projection
based on current market observations.
Trade Safely,
Always DYOR
#हिन्दुस्तान कॉपर लिमिटेड
#indianeconomygrowth