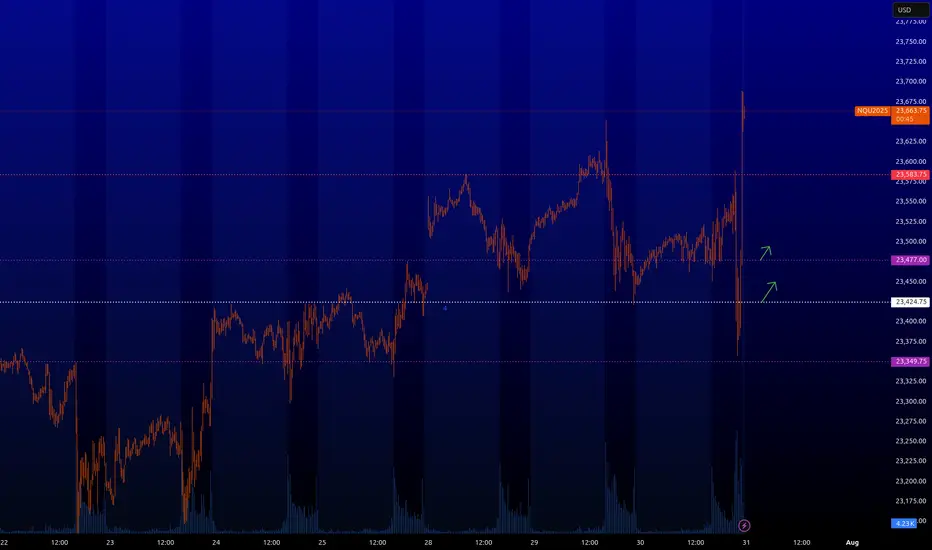
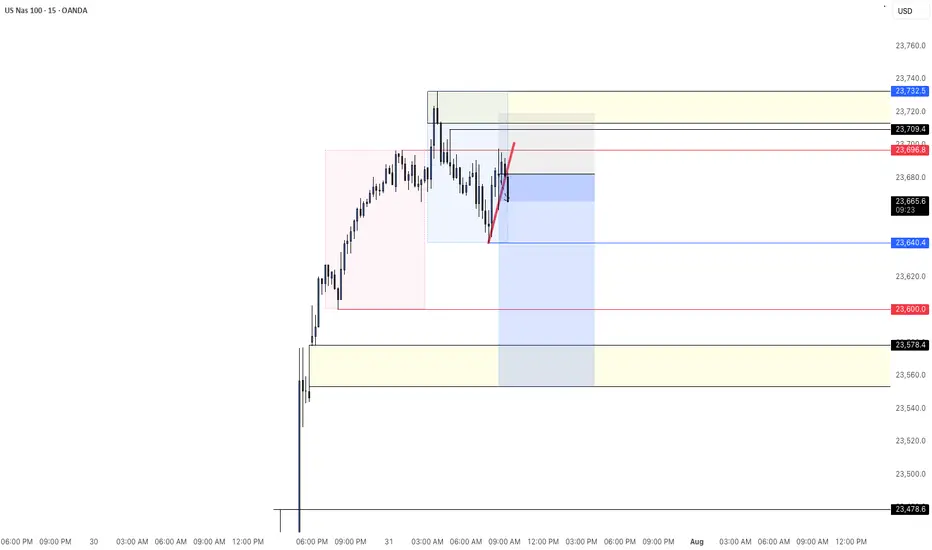
NQ : Buy levelsAll right, the stops are off like I said in my prev NQ post.
Turns out there was an important FOMC news that I didn't notice. I don't usually trade on the news.
Now the levels where the green arrows are from are back in play. You can pips, you can scalp, you can look for longer trades from them. I usually scalp them.
Beyond Technical Analysis
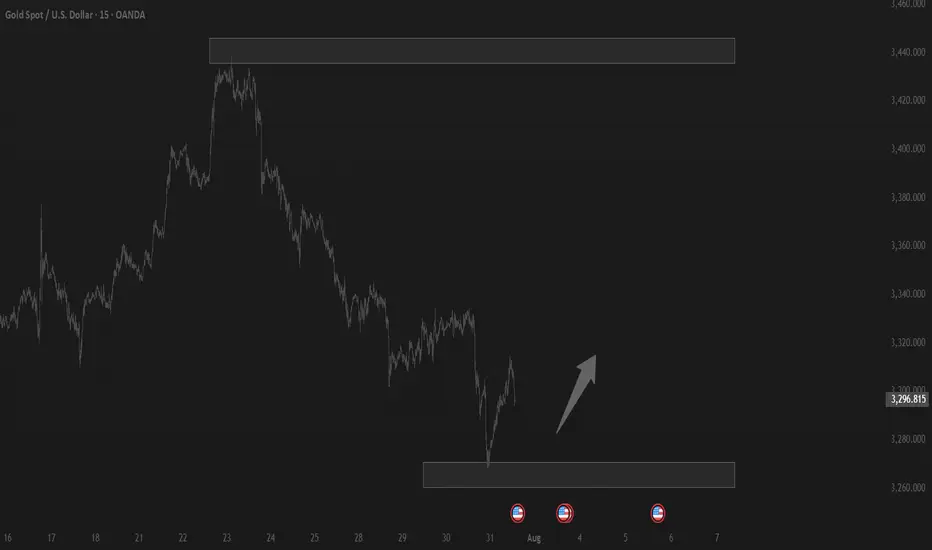
NQ : enormous amount of sell-stopsI have highlighted two zones where a lot of sell-stop orders are currently concentrated. Those who trade robots with fast buybacks, you can put your algorithms there. When entering these zones there will be a quick dropdown of the price if it comes to these zones in liquid time (American session).
Those who do not have robots, I will inform you when it will be possible to get some profit from these zones with limit trades.

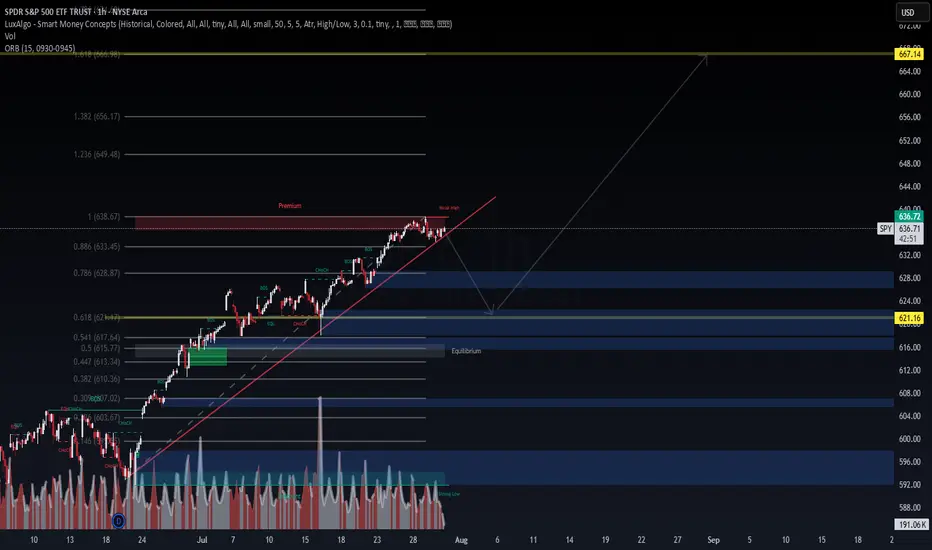
$SPY – FOMC Risk Window: AI Predicts Downside Drift📅 Forecast Window: July 30 – August 30, 2025
📡 Powered by VolanX Protocol v3.0 | WaverVanir DSS
🏛️ MACRO SETUP – JULY 31 FOMC:
🏦 Fed Funds Rate: 5.50% (expected hold)
🧊 Inflation: Cooling but sticky (CPI ~3.2%, PCE ~2.6%)
💼 Labor Market: Slowing but not collapsing
📈 CME FedWatch: 91% odds of no hike, but tone may be hawkish
🧠 Key Risk: Liquidity compression or prolonged pause = risk-off conditions
🧠 VOLANX PROTOCOL FORECAST (30-Day):
🔸 Current Price: $636.29
🔹 AI Target: $627.46 (−1.4%)
🟠 Signal: HOLD
🧮 Direction Accuracy: 85.5%
⚠️ Model Confidence: −2.049 (bearish drift)
📊 Volatility Forecast: Low (~1.36%) = slow bleed conditions
📉 WAVERVANIR DSS SIGNAL:
🔸 Sentiment Score: 78
🔻 15D Forecast: $630.49 (−0.8%)
🔻 30D Forecast: $616.68 (−2.9%)
📉 Bias: Mild Bearish
🛑 Signal: Hedge exposure, reduce risk, do not chase longs
🔥 OPTIONS FLOW SNAPSHOT:
🚨 $1.53M Call Sweep (645C, Aug 8) = Speculative breakout bet
📉 Multiple Put Sweeps (633–634P, Aug 4) = Institutional hedging
🟢 Mid-dated 638C/645C flows (Aug 15–22) show straddle-the-news positioning
📐 TECHNICAL ZONES TO WATCH:
📉 Support Levels:
$627 = Fib + VolanX AI Target
$616 = DSS Forecast + liquidity pivot
📈 Resistance Levels:
$639 → Gap close
$645 → Major breakout trigger (options magnet)
🕯️ Structure: Distribution bias → No clear momentum unless Fed surprises dovish
🎯 STRATEGIC OUTLOOK:
Scenario Probability SPY Reaction
🟡 Hawkish Hold 65% Pullback toward $627
⚪ Neutral Hold 25% Choppy → $639 max
🟢 Dovish Surprise 10% Spike to $645+
📌 VolanX Protocol Guidance:
"This is a defense window. AI models and options flow both suggest uncertainty, not conviction. Trim longs, hedge risk, and wait for post-FOMC confirmation."
#SPY #VolanX #WaverVanir #FOMC #MacroForecast #OptionsFlow #DSS #SMC #LiquidityTraps #SmartMoney #TradingSignals #AITrading #FederalReserve #TechEarnings #RiskWindow #HawkishFed #FedHold #MacroAI
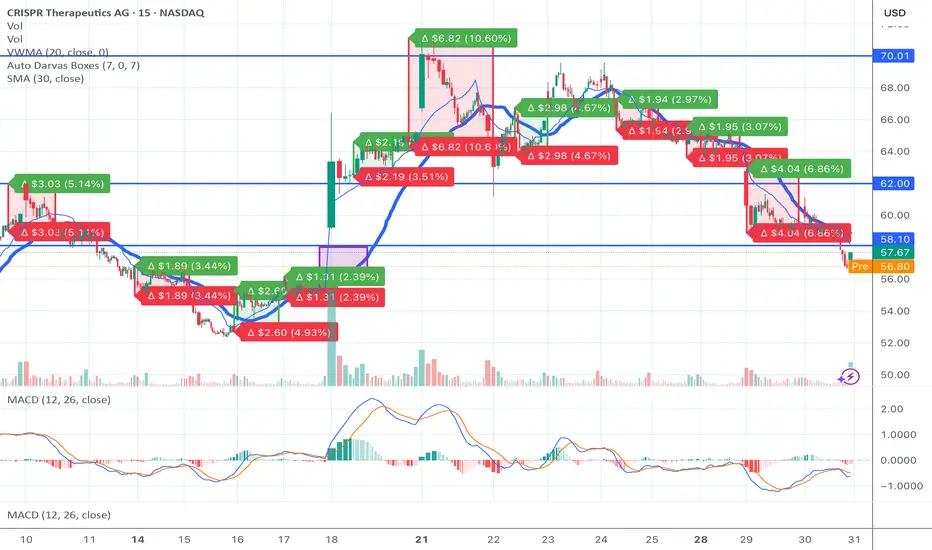
What’s Really Going on with CRSP — And What You Need to KnowIt’s Thursday morning. The stock has been dropping.
You’re asking yourself: What the hell is going on?
You’re seeing red in your portfolio, the option chain bleeding. Retail’s getting nervous. But here’s the thing you need to understand — and I want you to sit with this:
The drop is the setup. Not the end.
This is exactly how squeezes begin
CRSP is down today — not because of bad news, but because the market makers are doing their job.
Implied volatility is elevated ahead of earnings on Monday.
Shorts are trying to apply pressure to shake loose retail hands.
Option dealers are reducing exposure by selling stock — delta neutral hedging.
It’s Thursday before earnings.
This is when they suppress the price on purpose to cheapen contracts, reset expectations, and trap anyone not looking deep enough.
And that’s where the opportunity lies.
The mechanics you’re not being told
Let’s break this down in raw numbers.
CRSP short interest is 29.15 million shares.
That’s about 38 percent of the float — nearly one in every two tradable shares is bet against this company.
Cost to borrow is over 25 percent at peak, averaging 17.2 percent.
Days to cover is 5.3 — meaning if every short had to cover at once, it would take over a full trading week of volume.
Dark pool activity is now over 56 percent of daily volume.
This isn’t retail playing games.
This is big money loading the spring in silence.
And the trap door is earnings.
Why CRISPR Therapeutics is so misunderstood
This isn’t a meme stock. It’s not a pipe dream.
Co-founded by a Nobel Prize winner.
First ever FDA-approved CRISPR gene therapy, exa-cel.
Strategic partnerships with Vertex, Bayer, ViaCyte.
Over 2.1 billion dollars in cash on hand.
Pipelines in sickle cell, beta-thalassemia, solid tumors, diabetes, and early Alzheimer’s.
This is the Tesla of gene editing, but the market still treats it like it’s in the garage.
Why?
Because legacy investors don’t understand how fast biotech is changing.
Because analysts can’t model curing disease.
Because the old guard is still trying to value a revolution using 1990s Excel sheets.
Why the price is falling right now
Let’s be honest.
Shorts want you to sell.
Dealers need to de-risk into earnings.
IV crush is a real threat post-call.
But here’s what they don’t expect.
That retail is watching. Calculating. Waiting.
This dip isn’t about failure — it’s about strategy.
They want cheaper entries. They want to make the breakout more violent. They want to buy your shares at a discount before what could be one of the most important earnings calls in the company's history — this Monday, August 5th.
The setup is unlike anything else on the market
If the stock closes Friday anywhere near 64 to 66 dollars, and Monday earnings beat or hint at expanded trials, we get:
Gamma exposure flipping from neutral to positive
Dealers forced to hedge upward
Shorts squeezed from multiple levels
Price targeting 75 to 90 to 110 in a matter of weeks
And every dollar higher costs shorts tens of millions in floating losses.
They’re already down over 500 million since mid-June.
A move above 75 brings many of those positions to 50 percent losses — the exact pain point where margin calls trigger.
And when that starts? There’s no graceful exit.
Final thoughts
The world is sleeping on CRSP.
But you’re not.
You’re watching. You see the setup. You understand the math. You feel the potential.
This is not financial advice.
This is a call to wake up — to learn, to dig, to question what they want you to believe.
Because just like with Tesla at 30 dollars… Apple in the garage… Amazon when it only sold books…
The next generation of wealth won’t come from playing it safe. It comes from understanding the moment before it arrives.
And this is one of those moments.
Seed
BTC AI Prediction Dashboard - 6h Price Path (31.07.25)
Prediction made using Crypticorn AI Prediction Dashboard
Link in bio
BTCUSDT Forecast:
Crypticorn AI Prediction Dashboard Projects 6h Price Path (Forward-Only)
Forecast timestamp: ~14:00 UTC
Timeframe: 15m
Prediction horizon: 6 hours
Model output:
Central estimate (blue line): -118,124
Represents the AI’s best estimate of BTC’s near-term price direction.
80% confidence band (light blue): 117,836 – 118,977
The light blue zone marks the 80% confidence range — the most likely area for price to close
40% confidence band (dark blue): 117,650 – 119,908
The dark blue zone shows the narrower 40% confidence range, where price is expected to stay with higher concentration
Volume on signal bar: 177.26
This chart shows a short-term Bitcoin price forecast using AI-generated confidence zones.
Candlesticks reflect actual BTC/USDT price action in 15-minute intervals.
This helps visualize expected volatility and potential price zones in the short term.

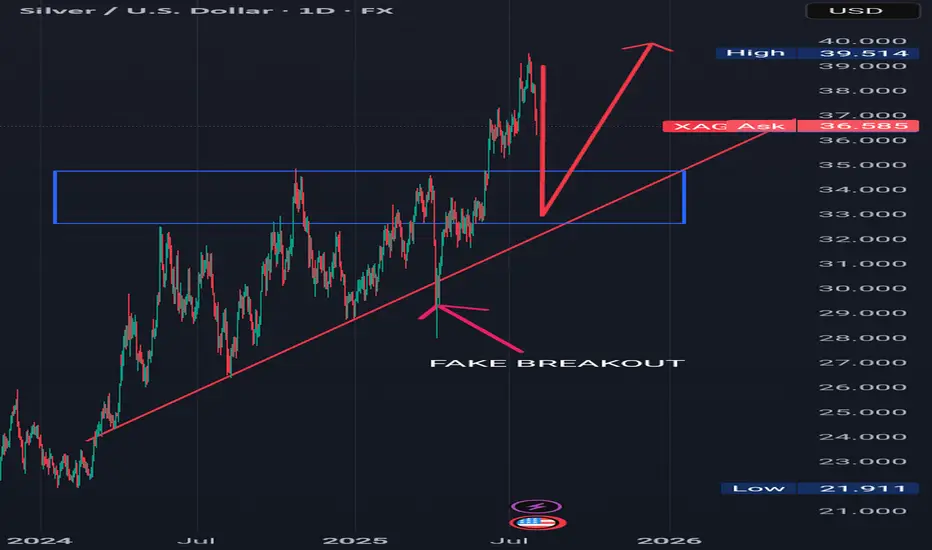
BUY AFTER THE PULLBACK Analyzing the daily time frame of silver, we can see that silver is in a bullish uptrend.
The price of silver is respecting a rising trend line which is acting as support in the past, only for some few times in the past did it exhibit a fake breakout which is indicated with an arrow.
I see the price of silver from its current price actions selling to our required point of interest and looking for buy liquidity to buy at our confluence which is both previous resistance which was broken to the upside which I indicated with a blue rectangle and a rising trend line.
Please look for buys at the previous broken resistance which is indicated with a blue rectangle in confluence with a rising trendline.
.............,...........................................
Please kindly share your thoughts on silver
Opening - LYFT Aug 8th 15 Covered CallOpened for $13.40 debit.
Notes:
Sold the approx. 40 delta call against shares for an earnings play to take advantage of vol crush. Best case stock moves higher and we can close out at max profit. Should it move against us then we continue rolling the call out and down.
Mostly I trade option strategies that are essentially theta positive and short volatility. But I have never really played around with covered call strategies or letting positions getting assigned on the put side. With the preference to roll out & up/down vs. allowing a position to get assigned. So I am experimenting by just outright getting into a covered call position to experience what it is like to manage an assigned put position with short calls.
Trade Data:
Cost Basis: 13.40
Max ROC: 11.94%
Position Net Delta: Approx. .60 long delta

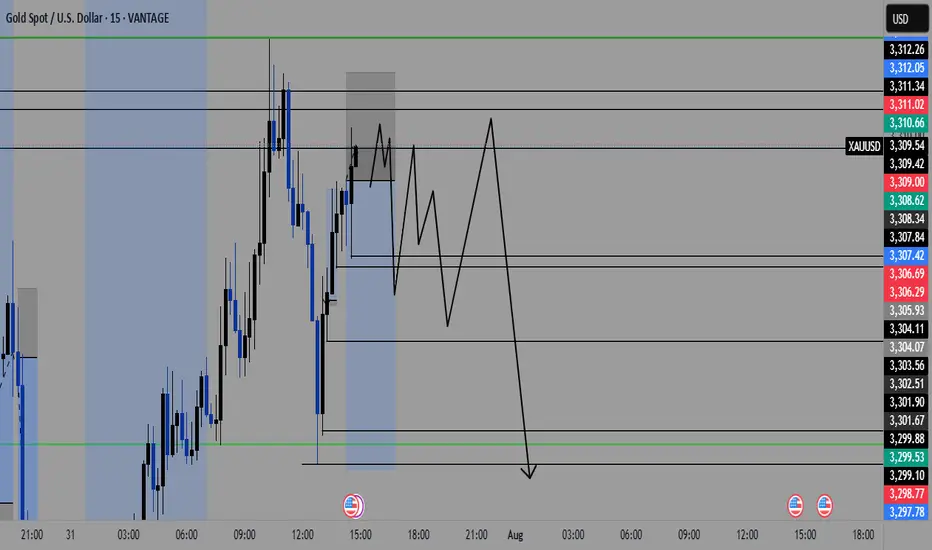
gold on buy retrace#XAUUSD price have reformed back above 3306, now we are expecting bullish from 3309 on 2 times breakout.
Entry 3309 2 times breakout, target 3326-3335, SL 3297.
Below 3297 holds bearish reversal, target 3270. 3317 will reject, H1 closure there will continue bullish.

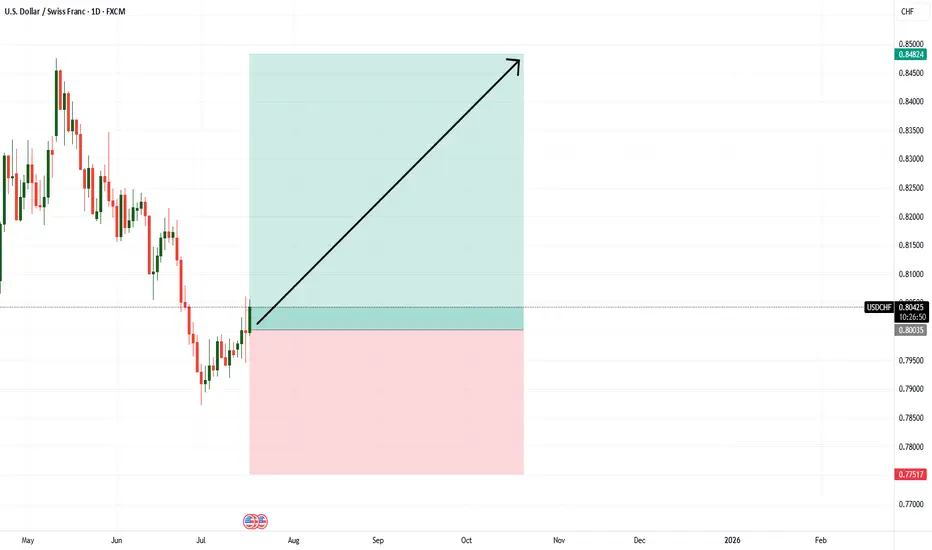
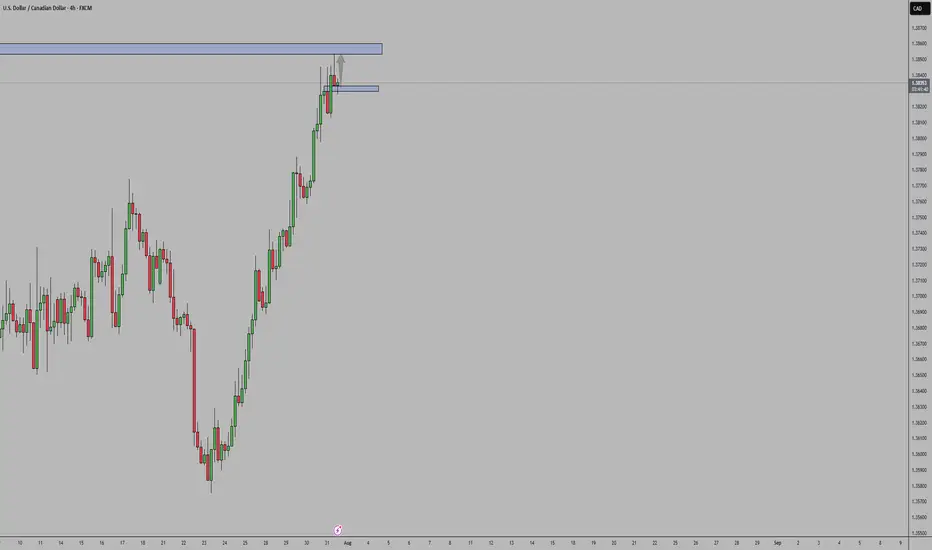
USDCADSupport Zone: Price has retested a strong support area
Price Action: The retest held — buyers defended it, showing rejection wicks / bullish candles.
Bias: Bullish while support holds → look for continuation to next resistance.
Invalidation: Bias weakens if support breaks and closes below the zone.
So as long as price stays above the retested support, USD/CAD remains bullish.
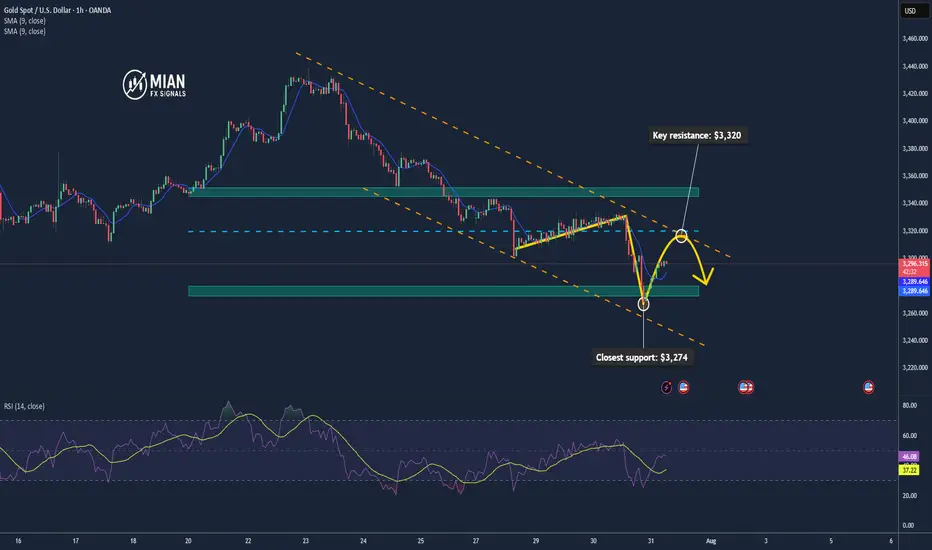
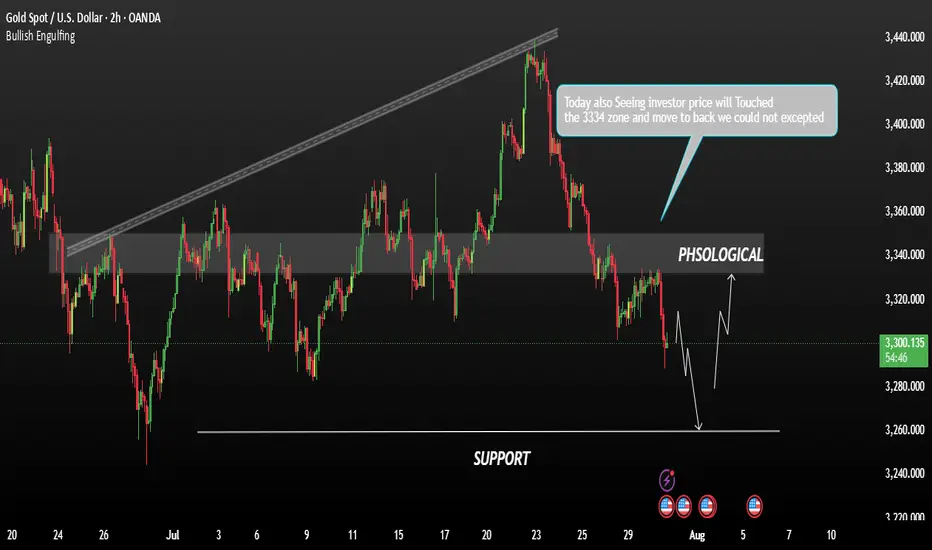
Gold May Rise Technically after Testing the $3,300 Zone📊 Market Overview:
Spot gold is trading around $3,295–$3,301/oz, influenced by slightly lower U.S. Treasury yields and a softer dollar tone. Analyst consensus from Reuters projects gold likely to stay above $3,220/oz through 2025 and possibly hit $3,400 in 2026 amid continued safe-haven demand
📉 Technical Analysis:
• Key resistance: $3,320 / $3,345
• Closest support: $3,274 – $3,280
• EMA09: Price is currently below the 9 period EMA on H1, indicating a short-term bearish bias.
• Candlestick / volume / momentum: There was a minor bounce from the support zone around $3,274, but volume remains low. RSI isn't oversold, suggesting room for technical pullback.
📌 Outlook:
Gold may experience a technical rebound if it holds above $3,280. A breakout above $3,320 would likely require clear catalyst—such as weak U.S. data or a dovish Fed tone.
💡 Suggested Trading Strategy:
SELL XAU/USD: $3,320 – $3,323
🎯 TP: 40/80/200 pips
❌ SL: $3,326
BUY XAU/USD: $3,279 – $3,282
🎯 TP: 40/80/200 pips
❌ SL: $3376
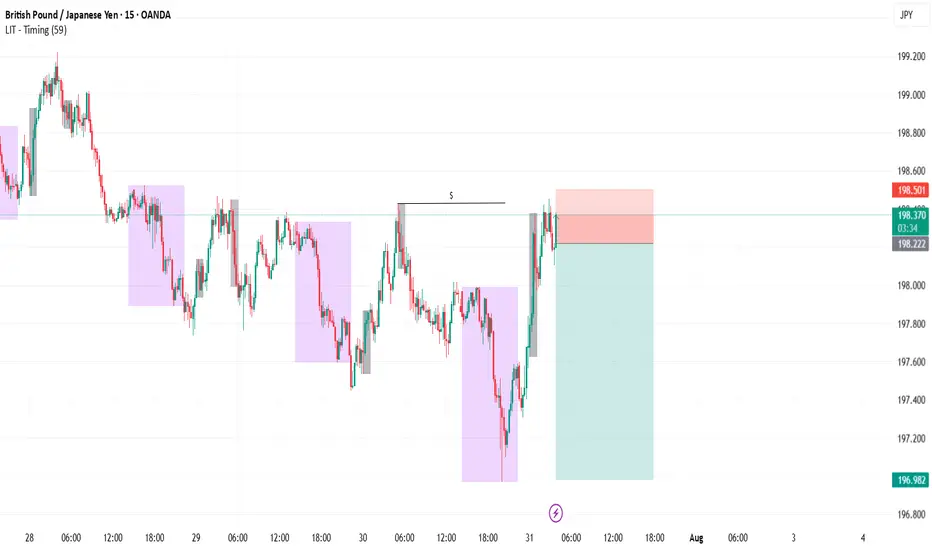
GBPJPY SellExternal structure is now bearish and the internal structure did a liquidity grab. Price should continue lower and go towards asia low to complete daily cycle.
NAS100 - SHORTPrice hit TP after yesterday's long position. Created new all time highs into the asian/London session. We have a nice gap I will target as my potential full TP.
Gold is faking a bullish trapWe are gonna go down to the 3294 level before we see a bounce up. The 3294 level is gonna show up as a strong support to push trough the 3345 area.
Very Strong Short!Hello all. as you see market needs a new lower low. a little above we have an Strong level that in throw the market down. be happy and Trade it if your method confirm. (wink)

BITCOIN, GOLD ANALYSISQuickly we dive into analyzing our favorite pairs for the day we check and confirmed our directional biased which at the end of the day 1:2 is being targeted. BTC is is in a tricky spot but we will always follow the direction of the market to be more o the safer side.

USDCAD Update: Don’t Sleep on This Uptrend’s First LegYo traders, Skeptic from Skeptic Lab here! 🚀 USDCAD’s serving a hot long trigger for pattern traders chasing the first leg of a big uptrend! We’ve got an ascending triangle breakout on the daily, with bullish candles stacking up, hinting at a return to the weekly bullish trend. Too early to confirm, but the momentum’s fire.
📈 Today’s FOMC meeting’s got everyone buzzing—will Powell cut, hold, or drop resignation hints? Check the full setup in the video, but with crazy news like Federal Funds Rate
, s tick to high-probability trades, keep risk low, and no FOMO or revenge trading! Drop your thoughts, boost if it vibes <3

XAUUSD – Bearish Outlook Ahead of FOMCGold is currently under bearish pressure as markets await the highly anticipated FOMC meeting, scheduled to begin in less than an hour. Investors are closely watching the Fed's interest rate decision and the release of the meeting minutes, which could trigger sharp volatility across the forex and commodities markets.
Technical Outlook:
From a technical perspective, the price action suggests a potential continuation of the bearish trend. If the FOMC event leads to a stronger U.S. dollar or a hawkish tone from the Fed, gold prices may decline further.
Resistance Zone; 3315 / 3330
Support Levels: 3282 / 3260
You May find more details in the Chart.
Trade wisely Best Of Luck Buddies.
Ps: Support with like and comments for better insights Thanks for understand.
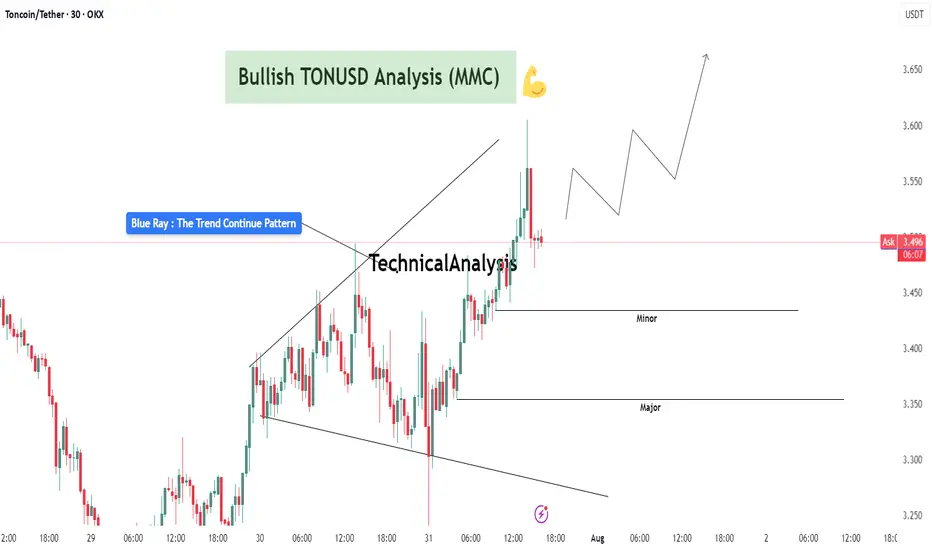
TONUSDT Analysis : Bullish Setup Breakout – Advanced MMC Analyze“Blue Ray Pattern Breakout Confirms Bullish Trend Continuation”
The 30-minute chart of TONUSDT highlights a clean and structured bullish setup based on the MMC (Mirror Market Concepts) methodology. The price action exhibits disciplined market behavior, respecting structural levels, breakout dynamics, and volume-based reactions.
🔷 1. Blue Ray Pattern – Trend Continuation Phase
This chart begins with the formation of the Blue Ray, a visual representation of trend consolidation and energy buildup. This pattern functions as a trend continuation flag or wedge. Prices compressed within a narrowing range, forming higher lows and lower highs, signaling accumulation under buyer control.
Once the pattern matured, we witnessed a decisive bullish breakout, where the price closed above resistance with conviction. This event marked a clear market intention shift and established a new impulsive leg.
🔍 2. Breakout Confirmation and Follow-Through
Post-breakout, TONUSDT experienced:
High-volume candles with elongated bodies, indicating increased buyer participation.
Immediate upside momentum that pushed the asset into a short-term overextended condition – often a healthy sign of strength when followed by a controlled pullback.
The breakout wasn’t just a false move – it was sustained, and the price held above the broken structure, proving that supply was absorbed and buyers were dominant.
🔑 3. Demand Zones (Minor and Major)
Two key MMC demand zones are highlighted:
🔹 Minor Demand Zone (~3.43–3.45):
This is the most immediate support and current price is hovering just above it. It's the first zone of interest for buyers and may serve as a re-entry or scaling point.
🔸 Major Demand Zone (~3.34–3.36):
In case of deeper retracement or volatility, this zone is expected to act as a strong bounce region based on past structure and MMC’s reversal logic. Price memory here suggests accumulation or reactive interest.
📐 4. Structure, Momentum, and Higher Timeframe Confluence
TONUSDT is in a confirmed uptrend, forming a clear sequence of higher highs and higher lows.
The structure supports a bullish flag breakout with minimal overhead resistance.
The projected path drawn on the chart illustrates a stair-stepping price pattern with continuation toward 3.60–3.70, if current levels hold.
📊 5. MMC Strategy Bias – Bullish
Using the MMC lens:
Blue Ray breakout confirms continuation
Volume absorption succeeded at the base of the flag
No signs of dominant supply entering post-breakout
Wave projection supports ongoing momentum
Structure favors buying dips, not shorting spikes
💡 Trader’s Takeaway:
TONUSDT is providing a textbook bullish opportunity under the MMC framework. As long as price stays above the Minor Demand Zone, continuation upward toward 3.60 and beyond remains in play. If price dips to the Major Zone, watch for strong buyer reactions for fresh entries.
Ideal for MMC traders and technical analysts looking to align with structured, logic-based entries and exits. This setup reflects market strength, technical clarity, and volume confirmation – a powerful trio for continuation plays.
Trading balanceTrading balance The price of the asset has rebounded from the balance zone. With the prospect of growth into the resistance zone.
GBPusd short position31/07/2025English : According to our analysis, we anticipate a bearish scenario.
Morocan Darija : kanchofo d'apres l'analyse dyalna antsanaw hboot
ATENTION : I only share my ideas, not signals

GoldTVC:GOLD price overall is bearish and looks like during NFP tomorrow it does looks like it's bout to be drop all the way down. But what are your ideas guys let me know on the comment session

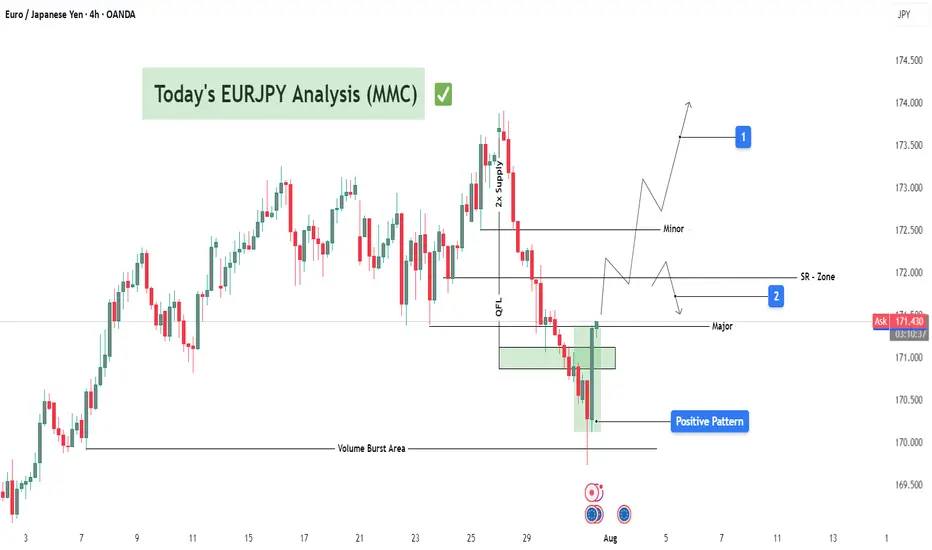
EURJPY Bullish Setup : EURJPY Forecast + Demand Zone🧠 Introduction: What's Happening on the Chart?
Today’s analysis on EURJPY is built on the MMC trading framework, which emphasizes the identification of institutional supply and demand zones, reaction points, QFL patterns, and volume bursts to map out high-probability trading paths.
We are currently observing a market in a corrective phase following a significant bearish drop. However, the presence of a major demand zone, along with a positive bullish pattern, suggests potential upside reversal or at least a short-term retracement.
🔍 Technical Breakdown – Zone by Zone
🔻 1. The Drop from 2x Supply Zone
EURJPY experienced a significant decline from the 173.60–174.00 area, which acted as a 2x confirmed supply zone.
Sellers took control with strong bearish candles that broke through previous minor support levels.
This drop was impulsive, showing momentum-driven selling, often linked with institutional activity.
🟩 2. Demand Reaction at Major Zone
Price entered a key demand zone marked in green (170.80–171.00), where historically buyers have stepped in.
A "Volume Burst" is visible here—large volume candles with long wicks to the downside, which typically indicate accumulation.
A positive pattern (possibly engulfing or a pin bar structure) has formed, signaling a potential bullish reversal or relief rally.
🧱 3. QFL Structure (Quantum Flat Line)
The chart highlights a QFL base, where the price consolidates after an initial drop, then continues lower before a sharp bounce.
QFL is often used to identify trap zones where retail traders are shaken out, and smart money enters.
The recent bounce from the QFL base suggests smart money might be accumulating for a reversal move.
📐 Key Levels and Zones
Type Zone/Level Role
🔵 Volume Burst Area ~170.80–171.00 Aggressive buyer entry; accumulation zone
🟢 Major Demand 170.80–171.20 Key structural low supporting bullish bias
🟠 SR Flip Zone 171.80–172.00 Crucial breakout/retest level
🔴 Minor Resistance 172.60–173.00 Short-term pullback zone
🟥 2x Supply 173.60–174.00 Strong reversal point; ideal target
🔁 Scenarios to Watch
📈 Scenario 1: Bullish Breakout and Rally (Blue Box 1)
If price breaks above 172.00, we expect:
A potential retest (bullish confirmation).
Continuation toward minor resistance at 173.00, and possibly the 2x supply zone at 174.00.
This aligns with the positive pattern formed at the base and the idea of a market rotation from bearish to bullish structure.
📉 Scenario 2: Rejection and Retest of Lows (Blue Box 2)
If the price fails to sustain above 172.00, sellers may step in:
Price could revisit the major demand zone again or even break down to 170.50.
This would invalidate the bullish setup in the short term and imply a larger continuation of the bearish trend.
🧠 Strategic Insights (MMC-Based Thinking)
The MMC approach teaches us to mirror the market’s emotion and behavior.
In this case, we see signs of:
Panic selling → smart money accumulation.
Institutional traps (QFL drop) → bullish absorption.
Traders applying MMC would anticipate reactive setups at the SR Flip Zone to determine next directional bias.
💡 Trade Ideas (For Educational Purposes Only)
Strategy Entry SL TP1 TP2
Aggressive Long 171.30–171.50 170.70 172.50 173.50
Breakout Retest Long 172.10 (after breakout) 171.50 173.00 174.00
Sell on Rejection 172.00 (bearish confirmation) 172.60 171.00 170.40
📌 Conclusion & Final Thoughts
EURJPY is showing a potential bullish reversal setup from a well-defined demand zone, supported by volume bursts and positive price action patterns. However, the SR Zone at 172.00 remains the key pivot—how the price reacts here will determine whether we see a deeper pullback or a continuation to test upper resistance levels.
Stay flexible and responsive. Let the market give confirmation before execution. As always, follow proper risk management and trade the reaction, not the prediction.
FX Wars Episode 6 - The return of the USDA simple idea, which I will gradually fill with life:
The USD returns and with it the claim to its FX throne.
Act 1:
📊🔮🇺🇲 US retail sales, which will be published today at 14:30, will be higher than consensus expectations.
🟡-> the US consumer is alive and well and will continue to keep the US economy afloat.
Further acts will follow ✅️