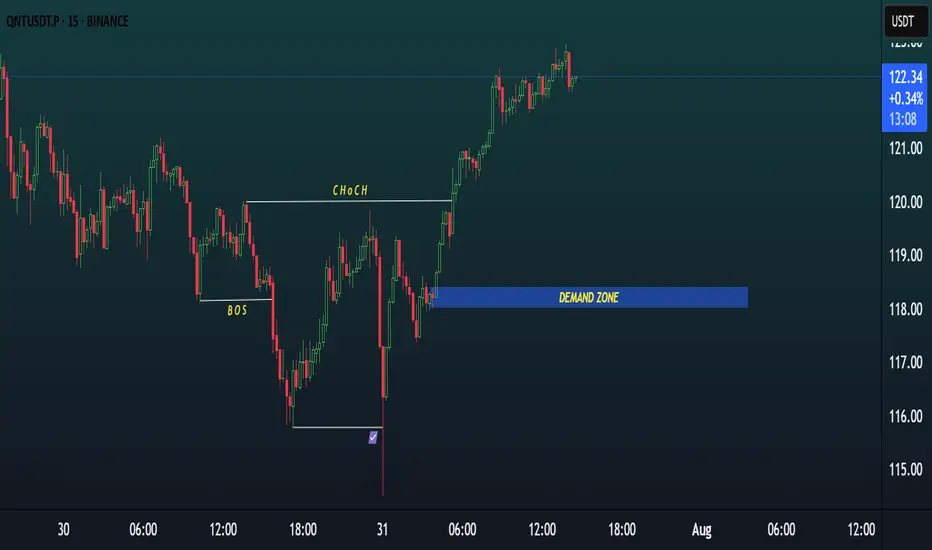
QNT/USDT 15m SETUP.QNT/USDT 15m Setup 🔥
Price made a strong Change of Character (ChoCH) to the upside, confirming bullish intent.
After the shift, price rallied and created a clean Demand Zone around $117.80–$118.50.
✅ Now waiting for a potential pullback to this zone for a high-probability long entry.
SMC-based setup — wait for confirmation before entry
Beyond Technical Analysis
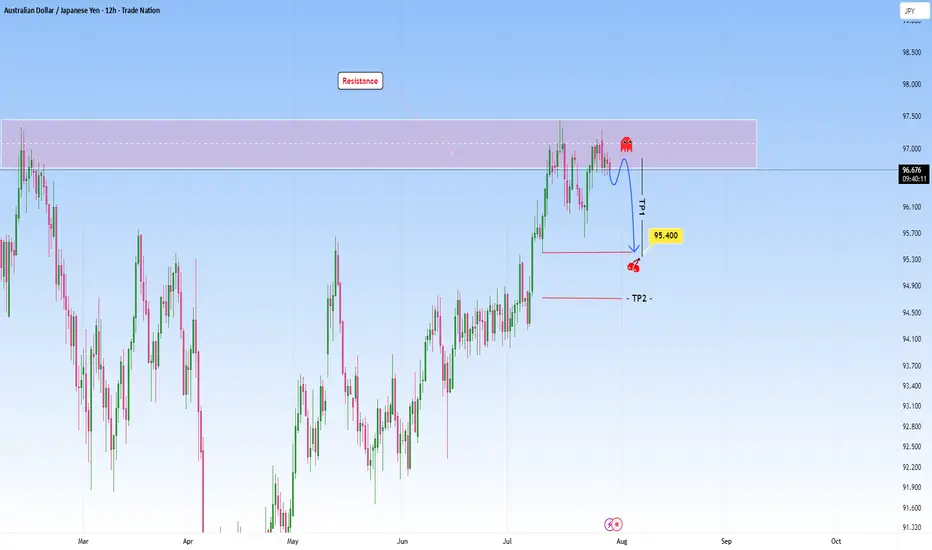
AUDJPY at Resistance: Could we see a reversal here?The market on this pair shows us a classic scenario where price presses into a resistance zone after a sustained bullish move. Price action approaching this zone appears hesitant, with smaller candles and wicks showing signs of exhaustion, meaning the possibility that buying momentum is weakening. There is a clear intention in this structure and I am anticipating a reversal here.
My first target (TP1) at 95.400 is placed just above a previous structure low and it’s a logical level for a partial exit, as price may pause or react there. The second target (TP2), placed even lower, hints at a full mean reversion idea targeting the origin of the previous bullish leg.
The setup requires patience, waiting for confirmation perhaps in the form of a strong bearish rejection before committing to the short. Overall, it’s a disciplined setup that mirrors the kind of analysis I like to gravitate toward: structured, simple and driven by high probability reversal zones.
Disclosure: I am part of Trade Nation's Influencer program and receive a monthly fee for using their TradingView charts in my analysis.
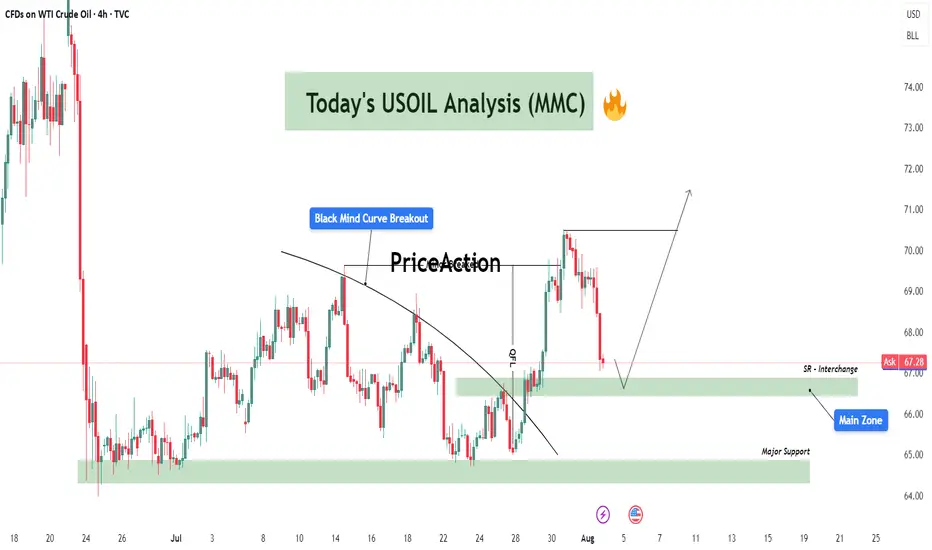
USOIL Technical Analysis – Black Mind Curve Breakout & Reversal🔍 Overall Market Context:
The current USOIL structure is a great example of market shift from compression to expansion, characterized by a breakout of the Black Mind Curve followed by a measured impulse move. This chart is not just reacting technically, but it reflects how institutional smart money manipulates curves, breaks minor structures, and then retests zones to refill orders before continuing directionally.
Let’s break the market psychology and price action phase by phase:
🔄 Phase 1: Black Mind Curve Breakout ✅
The Black Mind Curve represents long-standing supply pressure that had been capping price.
Its breakout marks a shift in market intention, often signaling the end of a distribution phase and beginning of a possible accumulation or re-accumulation.
Price broke above this curve cleanly with strong bullish candles, which also broke minor structure levels, confirming short-term bullish sentiment.
The breakout was also backed by momentum and volume as the market pushed 130+ pips upward—an aggressive impulse that trapped late sellers below.
📉 Phase 2: Retracement to Interchange Zones
Now, we’re in the retracement phase, where price is pulling back toward:
🔹 SR Interchange Zone ($66.80 - $67.30)
This zone was previous resistance, now flipping to support.
In MMC terms, this area is expected to serve as a refill zone where smart money will look to accumulate again after the breakout.
We are watching for confirmation candles or MMC-style reversal patterns here (e.g., inside bar breakouts, demand imbalances).
🔹 Main Zone ($65.80 - $66.50)
If the first zone fails, this is the next key demand base.
It holds historical value from previous accumulation phases (see July 10–25) and aligns with the origin of the last impulse.
Expect a sharper wick or deeper liquidity grab if price moves into this area.
📉 Phase 3: Final Defensive Zone – Major Support ($63.70 - $65.20)
This zone marks the last line of bullish defense.
A move here would mean the bullish structure is being reevaluated or absorbed by sellers.
However, if price hits this level, it could also attract significant institutional demand, setting up for a more powerful long-term leg up.
Reactions here are typically large and volatile, with a risk of fakeouts and fast reversals.
📈 Possible Scenarios (MMC Based Forecasting):
✅ Scenario 1 – Bullish Continuation (Primary Path)
Price finds support inside SR Interchange Zone.
Forms a base (MMC reversal structure) and pushes back to recent highs near $71.
Breakout above $71 opens room for next supply zones between $72.50 - $74.00.
⚠️ Scenario 2 – Deeper Liquidity Grab
Price breaks below SR Interchange and tests Main Zone for a deeper accumulation.
A wick or shakeout may happen before bullish continuation.
This trap zone could give the best R:R entry.
❌ Scenario 3 – Breakdown to Major Support
If both zones fail and bearish pressure sustains, price may revisit Major Support.
That would reset the bullish structure and require fresh MMC assessment.
🧠 MMC Logic at Work:
The curve break symbolizes the shift from supply dominance to a possible demand-led phase.
Minor structure breaks add fuel to trend shift and indicate participation from larger players.
Retracements are not weaknesses—they are refills for those who missed the move.
Smart money uses these zones and flips (SR interchanges) to hide in plain sight.
🎯 Key Takeaway for Traders:
This is a textbook MMC setup that combines:
Curve Breakout + Impulse
Zone Retest + Interchange Logic
Liquidity Engineering before Continuation
Traders should remain patient and observe reactions at each zone. Don’t chase—wait for the market to reveal its hand via MMC entry signals (break-of-structure, bullish engulfings, imbalance fills, etc.)
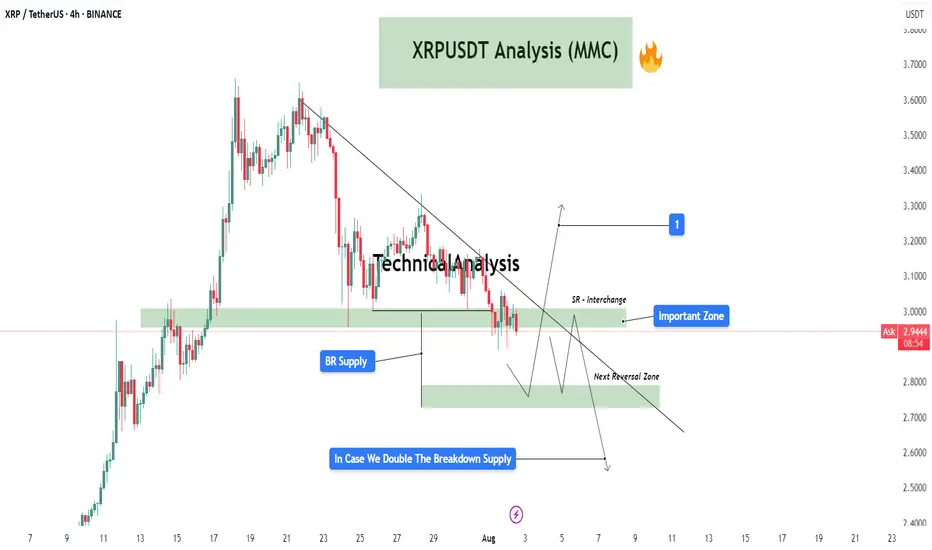
XRPUSDT Analysis (MMC) : Decision Point + Next Move Loading In this 4-hour chart of XRP/USDT, we're observing a critical structure forming under the Mirror Market Concepts (MMC) framework. Price action is compressing near an important descending trendline, suggesting that a breakout or breakdown is imminent. Let’s break it down zone by zone:
🔍 Key Zones & Price Structure:
Important Zone (SR Interchange Zone – $2.95 - $3.05)
This is a major supply-to-demand flip zone. It has served as both resistance and support in the past and is now acting as a potential interchange level. The price is hovering just below this area, retesting it after a significant bearish structure.
BR Supply Zone (Breakdown Retest Supply – $2.93 - $2.98)
After price broke down from this zone, it created a base for a retest. This level has since acted as a cap to further upside movement. It also coincides with the descending trendline, adding confluence to its strength as resistance.
Next Reversal Zone ($2.75 - $2.85)
In case the price fails to reclaim the Important Zone, we could see a bearish continuation move into the next zone of interest. This is a likely reversal or reaction area based on previous demand imprints and price imbalance.
SR Flip Watch
If price breaks above the trendline and sustains above the SR Interchange Zone, this could trigger a potential bullish breakout toward the $3.20+ region (labeled as target “1”). This move would be backed by trapped sellers and liquidity above the descending structure.
📈 Potential Scenarios:
✅ Bullish Case:
Break and close above the descending trendline.
Successful retest of the Important Zone as demand.
Push toward $3.20 - $3.30 where the next supply awaits (target 1).
❌ Bearish Case:
Rejection at the Important Zone and trendline resistance.
Breakdown below $2.90 confirms bearish pressure.
Possible liquidity sweep and reaction from the Next Reversal Zone ($2.75-$2.85).
If this zone fails to hold, continuation toward lower zones becomes likely.
🧠 MMC Perspective:
From a Mirror Market Concepts (MMC) standpoint, the market is currently at a reflection point where a decision between bulls and bears is about to play out. The clean diagonal structure plus clear horizontal liquidity pockets makes this setup ideal for anticipating manipulation traps and smart money moves.
DOGEUSDT Analysis : Trendline Decision & Dual Directional Point📌 Market Context & Current Setup:
DOGEUSDT has been trading within a well-defined descending channel, respecting a strong trendline resistance, which has acted as a bearish ceiling for several sessions. The price action has been heavily influenced by supply zones formed after sharp impulsive drops, creating multiple QFL (Quick Flip Levels) — key to spotting structural bottoms and high-probability reversal zones.
Currently, the price is hovering near a critical decision point, where two key scenarios may play out:
A breakout and bullish reversal toward major resistance
A dip into a deep demand zone for final accumulation before reversal
Your plan reflects MMC (Market-Mind-Confirmation) methodology, preparing for either scenario with clear levels, logic, and psychology in place.
📐 Technical Breakdown:
🔻 1. Trendline Confirmation (Bearish Control):
The price has respected the downtrend line multiple times, confirming strong bearish momentum.
No candle body has closed decisively above it, showing sellers still have control.
However, price is now consolidating near this line, indicating a potential weakening of selling pressure — a classic sign of upcoming trend exhaustion.
🟩 2. Support Zones – Structural Layers:
📍 Minor Zone (S/R Flip – ~$0.215–0.220):
This zone is a previous support turned resistance.
It’s the first checkpoint the price needs to reclaim to confirm a breakout.
A successful flip from resistance back to support would add strong bullish confidence.
🟩 Reversal Zone (~$0.185–0.190):
Marked on your chart as a "Reversal Area" — likely derived from QFL methodology.
Price has historically bounced from this area, indicating buyers are willing to step in aggressively.
This zone aligns with smart money demand accumulation and could serve as a final liquidity sweep zone before a major reversal.
📍 Major Resistance Zone (~$0.250–0.260):
The next major objective once a trendline break is confirmed.
Also aligns with previous highs and volume nodes — a solid target for bullish trades.
🔄 Scenario-Based Strategy:
📈 Scenario 1 – Breakout Toward Major Resistance:
Price breaks above the descending trendline and reclaims the minor S/R zone.
This would confirm a bullish structure shift, validating that sellers are losing strength.
After reclaiming ~$0.215, the path toward $0.240–0.260 opens up.
Retests or flag breakouts within this range can be re-entry points for trend traders.
📉 Scenario 2 – Deeper Retest and Accumulation:
If the price fails to break out and dips further, the reversal demand area (~$0.185) becomes critical.
This is where buying pressure is expected to return, and as labeled in your chart:
👉 “If it goes down, we will double the supply”
This suggests an averaging-down or pyramiding strategy based on strong structural confidence.
This technique is valid only when the area is backed by solid confluence (trend exhaustion, demand, and past bounces).
🧠 MMC Strategy (Market – Mind – Confirmation):
Market: Bearish short-term trend, but price is approaching oversold territory near structural demand.
Mind: You’re prepared for both outcomes – breakout or dip. Emotion is out of the plan.
Confirmation: You wait for signs — break and retest of trendline, bullish engulfing candles, or wick rejections from demand.
This mental clarity helps maintain trading discipline and keeps emotional bias out of decision-making.
⚙️ Execution Plan:
Component Scenario 1 (Breakout) Scenario 2 (Deep Buy Zone)
Entry Signal Break & close above trendline + minor SR reclaim Bullish reversal candle within demand zone
Stop Loss Below trendline + S/R flip (~0.210) Below demand zone (~0.182)
Target 1 $0.235 $0.235
Target 2 $0.255–$0.260 $0.255–$0.260
Risk Level Medium Higher R:R potential
Strategy Notes Aggressive on confirmation only Add to position on wick traps
🧠 Trader Psychology Tips:
Be patient — confirmation beats prediction.
Set alerts at key levels to avoid emotional entries.
Scaling into trades based on zone reactions builds flexibility and control.
"Double the supply" approach must be paired with strict invalidation levels.
✅ Summary:
DOGE is trading within a descending wedge.
Key decision zones are marked clearly (trendline, S/R flip, reversal demand).
Breakout could lead to a quick 15–25% upside.
Reversal zone offers great R:R with accumulation opportunity.
Strategy is well-aligned with disciplined execution and trader psychology.

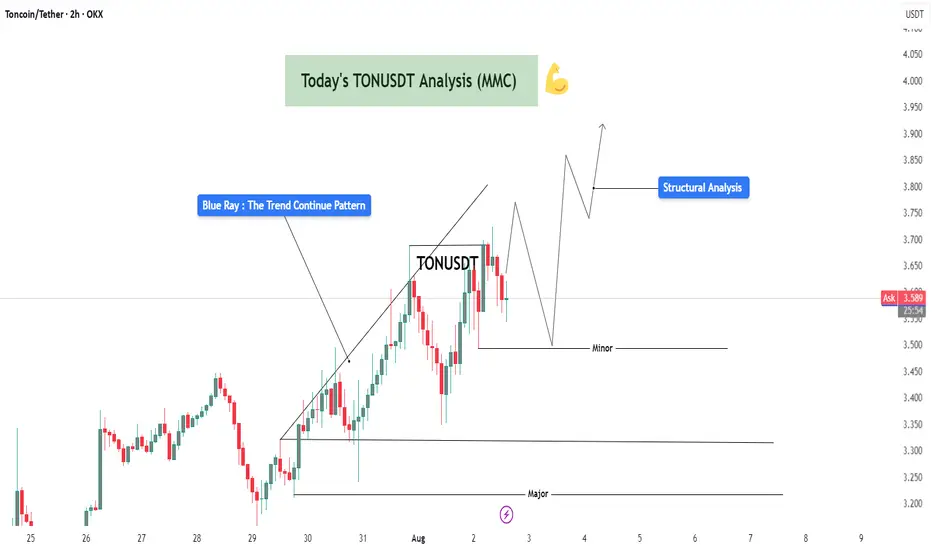
TONUSDT Bullish Structure Continuation – Minor Pullback Leg Up🧾 1. Overview of the Chart Setup:
The current TONUSDT (Toncoin/USDT) 2-hour chart exhibits a strong bullish market structure, characterized by a clear sequence of higher highs and higher lows. This confirms bullish momentum and suggests that the market is in a well-established uptrend.
The key highlight here is the "Blue Ray – Trend Continuation Pattern", which signals sustained bullish pressure following a clean breakout. This breakout was preceded by a consolidation phase, indicating accumulation by smart money before the expansion move.
🔍 2. Technical Structure and Pattern Breakdown:
🔵 Blue Ray – Trend Continuation Pattern:
This diagonal support trendline captured the initial breakout after the market bottomed near July 29–30.
Price respected this ascending line multiple times before accelerating, confirming bullish control.
Once the price broke above the previous swing high, it completed the pattern and triggered a momentum-driven rally.
🔲 Structural Zones – Major and Minor:
Minor Support Zone (~3.50 USDT):
Currently acting as short-term demand.
Price is showing early signs of rejection here, suggesting bulls may reload for a second impulsive move.
If this zone holds, we expect a new higher high to form, potentially targeting 3.80–4.00+ USDT.
Major Support Zone (~3.20–3.25 USDT):
Acts as long-term bullish defense.
In case of deeper retracement or shakeout, this is the key level to watch for possible trend continuation and re-entry.
📈 3. Structural Analysis and Price Projection:
The projected path on the chart shows a classic price action structure:
Impulse
Correction (toward minor support)
Next Impulse (break of recent high)
Higher low (continuation within trend channel)
Potential final push toward the 3.90–4.00 range
This type of Elliott Wave-inspired behavior suggests we're in wave 3 or 5 of a bullish sequence, with minor dips offering low-risk long setups.
📊 4. Candlestick & Market Behavior:
Recent candles show long lower wicks, suggesting buyers are stepping in during dips.
Bearish candles are relatively smaller and followed by immediate bullish response.
This indicates buy-the-dip sentiment, common in a trending market.
🔄 5. Trading Plan & Scenarios:
✅ Bullish Continuation (Base Case):
Wait for a clear bullish engulfing or price bounce at the minor support zone (~3.50 USDT).
Enter with confirmation: bullish candle close, volume spike, or trendline reaction.
Targets:
TP1: 3.80 USDT
TP2: 4.00–4.10 USDT
Stop Loss: Below 3.45 (or structure-based trailing stop)
⚠️ Bearish Case / Deeper Pullback:
If 3.50 fails, look for signs of accumulation around the major support (~3.20–3.25).
This zone can serve as the ultimate defense for trend continuation and provide a second long opportunity with better R:R.
🧠 6. Mindset for Traders:
Don’t chase: Let price come to your level, and focus on confirmation.
Trade with the trend: Structure supports bullish movement — trade in the direction of strength.
Use proper risk management: Define SL and TP before entering. Partial profits at key resistance zones are a smart strategy.
Avoid overtrading : Wait for structural retests or confirmation candles to stay on the right side of the market.
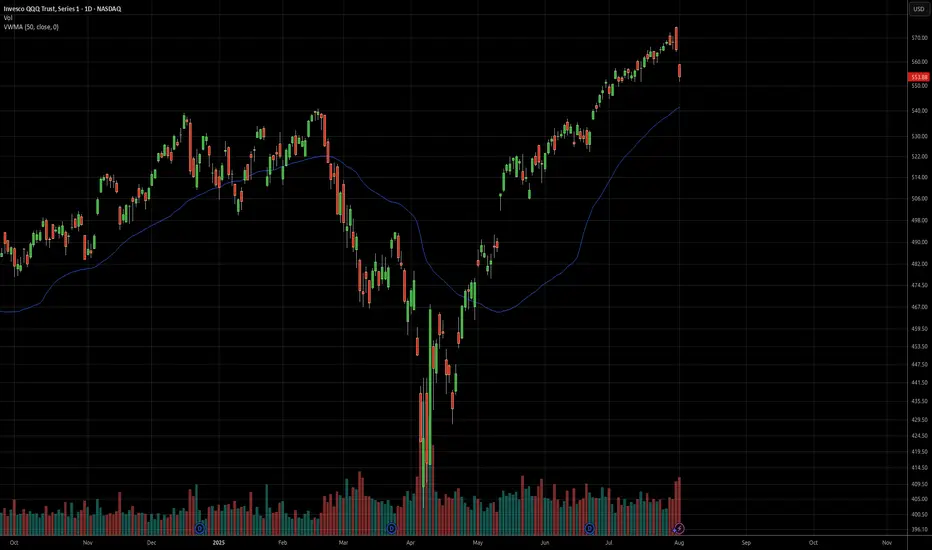
Stock Allocation IdeasIf you're building a stock portfolio, how you allocate your money matters as much as what you buy. Here’s a practical, risk-aware approach for retail traders and investors:
1. Core and Satellite Approach
Core (60–70%): Stick with strong, stable companies—large-cap names with reliable earnings like AAPL, MSFT, or JNJ. These form the foundation of your portfolio.
Satellite (30–40%): Use this portion for high-potential ideas—growth stocks, emerging tech (like AI or EV), or small caps. Higher risk, but higher potential return.
2. Mix Between Defensive and Growth Stocks
In volatile markets, lean toward defensive sectors (healthcare, consumer staples, utilities).
In bull markets or improving conditions, increase exposure to growth sectors (tech, consumer discretionary).
3. Blend Growth and Value
Balance high-growth stocks with undervalued, stable companies.
When interest rates are high or inflation is rising, value stocks often perform better.
When rates fall or the economy picks up, growth stocks usually lead.
4. Don't Ignore International Exposure
While U.S. stocks are strong, consider adding 20–30% exposure to global markets (Europe, Japan, or select emerging markets).
5. Stay Disciplined with Rebalancing
Check your portfolio every 3 months.
Take profits where gains have outpaced, and reinvest in areas that are still fundamentally strong but lagging.
Final Tip: Focus on position sizing and risk management. You don’t need to hit every trade—preserving capital and staying in the game is the priority.
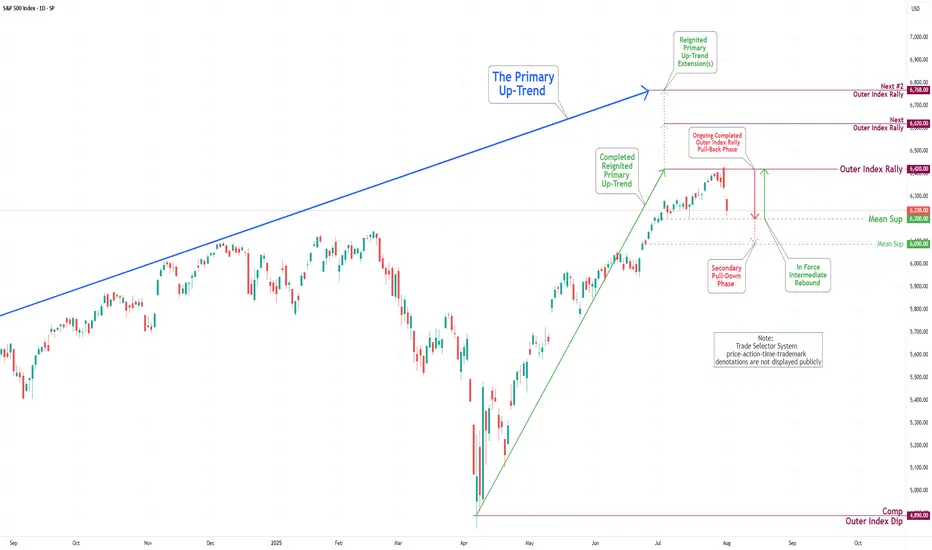
S&P 500 Daily Chart Analysis For Week of August 1, 2025Technical Analysis and Outlook:
During the trading activity of the previous week, the S&P 500 Index displayed a predominantly bearish movement after completing our Outer Index Rally target of 6420, as highlighted in the prior week’s Daily Chart Analysis, with the primary objective now being to plug our Mean Support at 6200.
It is essential to recognize that the current price movement may trigger a significant further pullback to the Mean Support level of 6090. Following this downturn, it is expected that the index will resume its upward momentum, aiming for a retest of the Outer Index Rally peak at 6420.
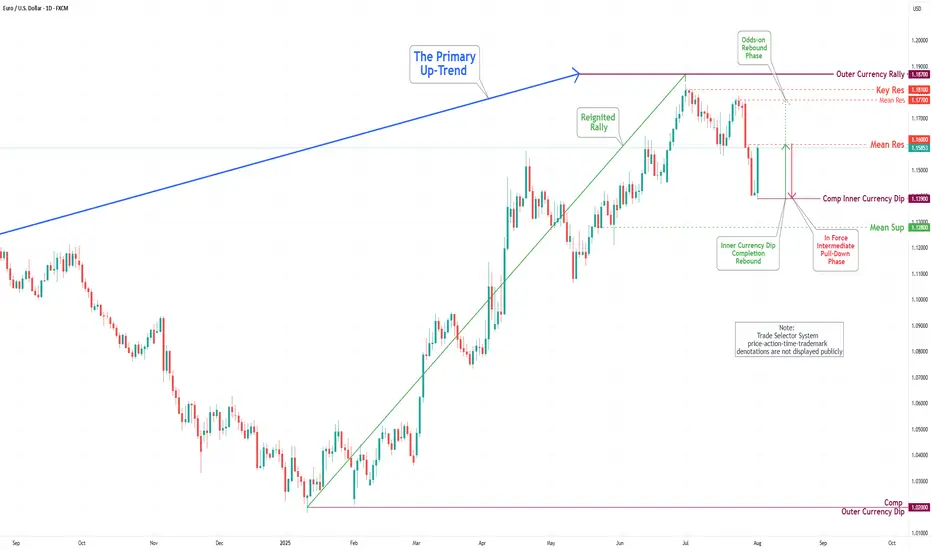
EUR/USD Daily Chart Analysis For Week of August 1, 2025Technical Analysis and Outlook:
In this week's trading session, the Euro experienced a significant drop, reaching the 1.139 level, and completing what is referred to as the Inner Currency Dip. As a result of the completion, the currency reversed direction and made a strong rebound, hitting the Mean Resistance level at 1.160. Recent analyses suggest that the Euro is likely to enter a sustained downward move after retesting the Mean Resistance at 1.160, with the target set to revisit the completed Inner Currency Dip at 1.139. However, it is essential to consider the possibility of continued upward momentum towards the Mean Resistance level of 1.177. Such a movement could trigger a significant rebound and lead to the completion of the Outer Currency Rally at 1.187.
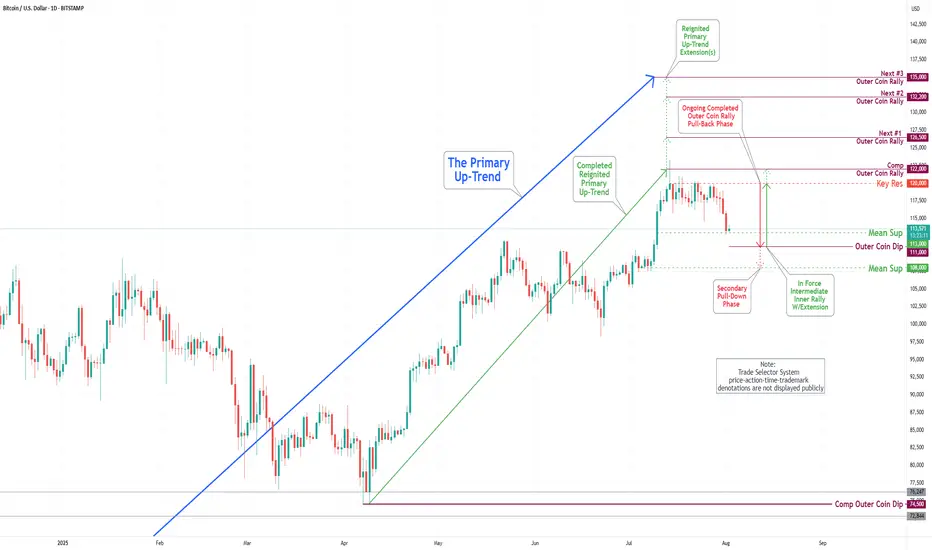
Bitcoin(BTC/USD) Daily Chart Analysis For Week of August 1, 2025Technical Analysis and Outlook:
In this week's trading session, the Bitcoin market experienced a notable pullback. The primary reason for this movement was the Key Resistance level, which led to a decline that reached our Mean Support level of 113000. This anticipated pullback is prompting the completion of the Outer Coin Dip target of 111000, with a strong likelihood of moving towards the Mean Support level of 108000.
XAUUSD Daily Sniper Plan – August 4, 2025🧠 Macro & Context
Gold is surging back toward premium structure after sweeping 3287. With no major news today, flow is dictated by structure, liquidity, and the residual strength from July’s closing push. Bulls have reclaimed internal control, but are now pressing into major resistance zones. This is the perfect battleground for sniper entries.
🔥 Bias: Bullish short-term, but hitting premium exhaustion
The current candle is testing prior supply and imbalance. Unless we break 3375–3380 cleanly, price remains vulnerable to rejection from premium. Above that, clean air until external zones. Any pullbacks into discount (under 3310) remain buyable — if the structure holds.
🎯 Daily Sniper Zones
🔷 3360–3375 – Decision Supply
📍 Where we are now
This is the current premium pressure zone. Built from a bearish OB + unmitigated imbalance from late July. First contact is live. If price rejects this level, sellers may regain control short-term. But if buyers break and hold above 3375 → bullish expansion is open. This is our Decision Zone.
🔷 3387–3405 – External Supply Block
📍 Premium target for breakout move
Clean HTF OB + imbalance resting above liquidity. If 3375 gives way, this is the next sniper target. Expect strong reaction — either reversal or inducement wick. Ideal for shorts if price shows exhaustion and BOS on LTF.
🔷 3430–3439 – Final Supply Cap (Weekly)
📍 Extreme supply wick
This is the highest defined zone on the Daily/Weekly chart before unknown territory. Full wick zone, untouched since early May. Reactions from here tend to be sharp. A strong rejection could initiate a new sell cycle.
🔷 3310–3325 – Mid-Demand Support
📍 Pullback buy zone
If price rejects 3375 and pulls back, this is the first area to monitor for higher low formation. Built from bullish OB, Fibonacci 50%, and alignment with internal structure. RSI supports buyers here if retested cleanly.
🔷 3285–3300 – Key Reversal Demand
📍 The origin of the current rally
Strong institutional footprint. Last BOS + OB confluence area. Any retest here is valid for sniper buys as long as no bearish HTF shift appears.
🔷 3240–3260 – Final Daily Demand Base
📍 Only valid if structure breaks down
If we lose 3285, this is the last demand zone holding Daily structure. Deep discount + HTF mitigation block. A visit here would require bearish breakdown first.
🧠 Game Plan Summary
⚠️ Right now, we are in a decision zone (3360–3375). Do not rush. Wait for confirmation.
✅ If we break 3375, next bullish target = 3405, then 3439.
🔻 If we reject 3375, watch for controlled retracement into 3325 or 3300 for buys.
⛔️ Do not sell blindly into current price — we are at equilibrium.
💬 If this sniper breakdown sharpened your vision, show some love ❤️
Comment, follow, and hit that like to stay locked in with GoldFxMinds.
More sniper updates dropping 💥
Powered by Trade Nation – for clear structure and no chart noise.
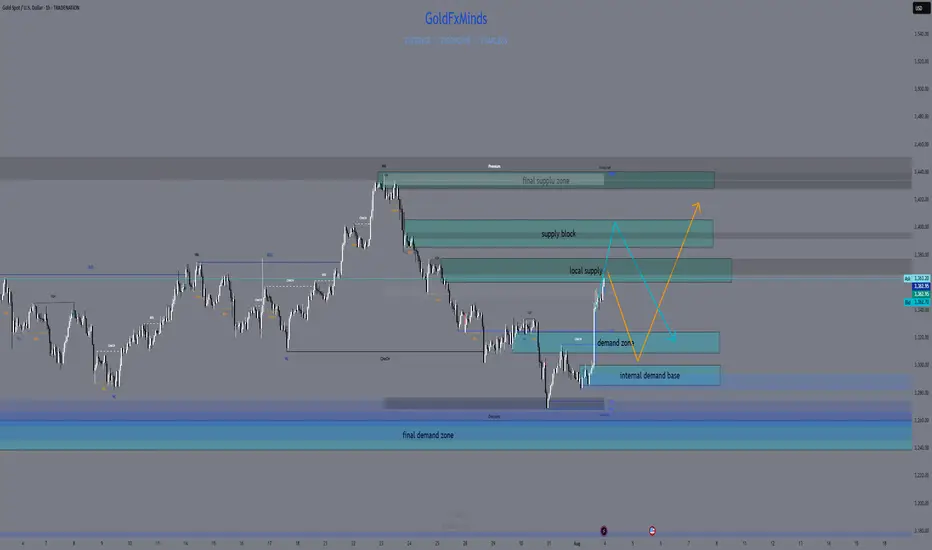
XAUUSD H4 Outlook – August 4, 2025Structure is bullish — but supply is layered. Precision now matters more than bias.
—
Gold is trading at 3362, sitting right inside the heart of a key structural zone. After a strong breakout from 3285–3260, price reclaimed imbalance, broke internal structure, and powered higher into premium. The trend is bullish — but we’ve just stepped into stacked supply.
Let’s break down every zone that matters now, from top to bottom:
🟥 3360–3375 – Valid H4 Supply Zone
This is the first active supply block — the origin of the last bearish leg. It holds a clean OB + imbalance and is currently being tested for mitigation.
We're inside it right now. This zone is critical:
→ If price breaks and holds above it, continuation is likely
→ If we reject here, it confirms sellers are defending their level
🟥 3385–3398 – Internal Supply Trap
A secondary supply zone built from previous order flow.
If bulls push through 3375 without rejection, this is the next area to watch for weakness.
This zone often creates fake breakouts, especially when momentum slows. RSI is already showing signs of exhaustion approaching this level.
🟥 3420–3440 – HTF Supply Trap
This is the top — the last unmitigated supply on the weekly.
It's not in play yet, but if bulls break above 3398 decisively, this is where the bigger trap could form.
Any long into this zone must be backed by strong structure and continuation candles — otherwise, it’s a liquidation magnet.
🟫 3322–3310 – Flip Reentry Zone
If we reject from current supply, this is the first high-probability reentry for bulls.
It’s where the last CHoCH confirmed, and it aligns with EMA confluence and minor imbalance.
Buy setups from here must be confirmed on M15/M30 — no blind longs.
🟦 3285–3260 – Breaker Demand Base
The true origin of the bullish move.
This zone caused the structural flip — clean OB, FVG stack, and liquidity sweep.
If price returns here, it becomes a must-hold for bullish continuation. One of the best sniper zones for longs.
🟦 3222–3205 – Final Demand Layer
Deep structure zone holding imbalance + previous HL base.
Only comes into play if 3260 fails. A break below this would shift bias to neutral or bearish on H4.
🎯 Bias Summary
✔️ H4 bias = bullish
✔️ Price is inside 3360–3375 supply
✔️ EMA 5/21/50 aligned, but RSI is elevated
⚠️ This is not a breakout — it’s a test zone
🔁 Execution Plan
📍 Rejection from 3360–3375 → sell scalp toward 3322
📍 Clean break of 3375 → watch for next short at 3385–3398
📍 Failure of 3398 → HTF draw toward 3430–3439
📍 Pullback toward 3322–3310 → potential long zone
📍 Clean drop to 3285 → high-RR buy area
📍 Break below 3260 → only valid demand left is 3222
—
This is not the time to chase. It’s the time to stalk.
You’re in premium. Supply is active. Let structure decide — you just execute with clarity.
—
Which zone are you watching for your next move?
Comment your bias below 👇🏼 Smash the ❤️ if this brought clarity, and follow GoldFxMinds to trade with precision every day.
Disclosure: Chart based on Trade Nation feed (TradingView).

analysis future of eurusd and goldtarget zone1: 1.18473 - 1.19752
target zone2: 1.22543 - 1.21326
eurusd and gold have inverse correlation
just big banks and investors message on telegram:@gando979

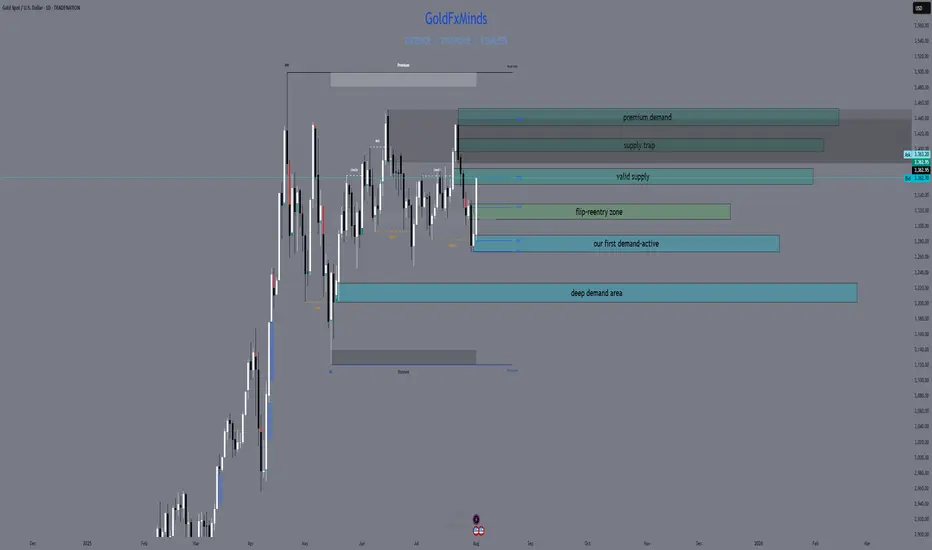
XAUUSD Daily Outlook – August 4, 2025We’re not in breakout. We’re deep in premium — and supply is stacked.
—
Gold is now trading at 3362, sitting right inside the first valid daily supply zone — the same block between 3355 and 3375 that caused the last rejection. The bullish rally from 3272 was clean: liquidity sweep, CHoCH, imbalance filled, HL confirmed. Bulls did their job. Now they’re walking straight into pressure.
Above this zone, things don’t get easier — they get trickier.
Just a bit higher, we have an internal supply trap between 3398 and 3412. It’s a reaction zone built from imbalance and inducement — not strong enough to hold a reversal on its own, but perfect to fake out breakout buyers. If price pushes through 3375 and enters this pocket, snipers should be watching carefully for early signs of weakness.
And finally, at the top of the current structure sits the HTF supply trap at 3430–3439 — the last weekly wick, the macro reversal zone. That level is sacred. If price makes it there, either we’ll see full-blown expansion… or a violent reversal born from overconfidence.
So what do we do now?
We wait.
If price starts to reject from this 3355–3375 supply with bearish intent, we target the flip reentry zone at 3318–3328 — the previous CHoCH break and dynamic EMA cluster. That’s your first intraday long trigger if bulls want to come back strong.
If that breaks, next is the demand base at 3287–3267, the origin of this entire bullish move. Below that? Imbalance support near 3225 — the final line before structure shifts.
—
🟥 Valid Supply Zone → 3355–3375
🟥 Internal Supply Trap → 3398–3412
🟥 HTF Supply Trap → 3430–3439
🟫 Flip Reentry Zone → 3318–3328
🟦 Demand Base → 3287–3267
🟦 Imbalance Support → 3225–3205
—
This isn’t a breakout. It’s a build-up inside premium.
The smartest move today might be no move — until structure speaks.
—
Are you watching for the rejection? Or the breakout trap?
Let us know your bias below 👇🏼
Tap that ❤️ if this gave clarity, and follow GoldFxMinds to stay ahead of every key level — no noise, just structure.
—
With sniper calm and strategic clarity,
GoldFxMinds 💙
Disclosure: Analysis based on Trade Nation TradingView chart feed.
USD/JPY Wyckhoff Accumulation on weekly Chart Looks like a fairly textbook Wyckhoff accumulation on the USD/JPY Pair and looking ready to move up and to the right soon.

Continued recovery, positive after NFP news✍️ NOVA hello everyone, Let's comment on gold price next week from 08/04/2025 - 08/8/2025
⭐️GOLDEN INFORMATION:
Gold prices surged over 1.5% on Friday, climbing toward $3,350, as a weaker-than-expected U.S. Nonfarm Payrolls (NFP) report signaled a faster-than-anticipated slowdown in the labor market. Heightened geopolitical tensions between the U.S. and Russia further boosted safe-haven demand for the precious metal.
Following the disappointing July jobs data, markets began pricing in a potential interest rate cut by the Federal Reserve. While the Unemployment Rate held relatively steady, signs of labor market softness supported recent comments from Fed officials Michelle Bowman and Christopher Waller, who advocated for a 25-basis-point rate cut at the July 29–30 meeting.
Additional data added to the cautious sentiment: the ISM’s July report confirmed that U.S. manufacturing activity remains in contraction territory, while consumer confidence took a hit, according to the University of Michigan’s latest survey.
⭐️Personal comments NOVA:
Gold prices continue to be positively affected after last week's NFP news, market expectations of an early rate cut are rising
🔥 Technically:
Based on the resistance and support areas of the gold price according to the H4 frame, NOVA identifies the important key areas as follows:
Resistance: $3384, $3434
Support: $3331, $3307, $3268
🔥 NOTE:
Note: Nova wishes traders to manage their capital well
- take the number of lots that match your capital
- Takeprofit equal to 4-6% of capital account
- Stoplose equal to 2-3% of capital account
- The winner is the one who sticks with the market the longest

XAUUSD Weekly Outlook – August 4–8, 2025
The question isn’t whether gold is strong. The question is — will price expand, or rebalance?
🔸 Macro Overview
Gold begins the week consolidating just below its final HTF supply zone (3439), while USD weakens amid mixed macro data and growing speculation of future rate cuts. Markets await fresh catalysts, and gold’s recent impulsive rally is now facing the big test: break the wick, or pull back?
🔸 Weekly Structure & Bias
Element Observation
🔹 Trend Bullish continuation — clean structure
🔹 Last BOS March 2025 — impulsive, with imbalance below
🔹 Price Action Top wick rejection forming near 3439
🔹 Bias Still bullish, but entering exhaustion zone
🔹 RSI Above 70 — overheated
🔹 EMAs EMA5 > EMA21 > EMA50 > EMA100 — perfect trend
🔸 Key Weekly Levels (Zones + Confluences)
Zone Type Price Range Confluences
🔴 Supply 3350 – 3439 HTF wick supply + FVG + RSI 70+ + liquidity trap
🔵 Demand 3270 – 3215 Weekly OB + FVG + EMA21 support
🔵 Demand 3120 – 3070 Old BOS + deep FVG + psychological level
🟢 Support 3000 zone EMA50 + historical consolidation
🔸 Fibonacci Extensions (Above 3439)
Extension Level Price Target Confluences
1.0 (Swing Full) 3439 Supply wick high
1.272 3505 Next psychological milestone
1.414 3560 Mid-extension + liquidity
1.618 3610 Golden expansion target
2.0 3740 Full trend extension (max)
🔺 These levels serve as potential breakout targets ONLY if we get a confirmed weekly close above 3439 with clean BOS on LTF.
🔸 Weekly Scenarios
🟢 Scenario 1 – Break and Expand
If gold breaks 3439:
Expect clean continuation to 3505 → 3560 → 3610
Best entries come from new OBs on H4/D1 around 3350–3370
Follow momentum — but don’t chase without retrace confirmation
🔻 Scenario 2 – Rejection + Retracement
If price holds below:
Pullback toward 3270 – 3215 expected
EMA21 acts as dynamic support
If selloff gains strength, next demand = 3120 – 3070
🎯 This zone aligns with macro OB + re-entry for long-term bulls.
🔸 Conclusion & Gameplan
Gold is pressing against its final weekly ceiling.
Structure remains bullish, but every sniper knows — at the edge of premium, timing is everything.
✅ Above 3439 → expansion opens to 3505 → 3560 → 3610
🟦 Below 3439 → retracement into 3270 → 3215 → 3070
The best setups will be born from confirmation, not prediction. Let the market decide.
—
What would you do if 3439 rejects hard this week?
Comment your plan, tag your sniper level, and let’s stay ahead together 💬
—
With clarity, confidence, and perfect timing,
GoldFxMinds 💙
Disclosure: Analysis based on Trade Nation (TradingView) chart feed.

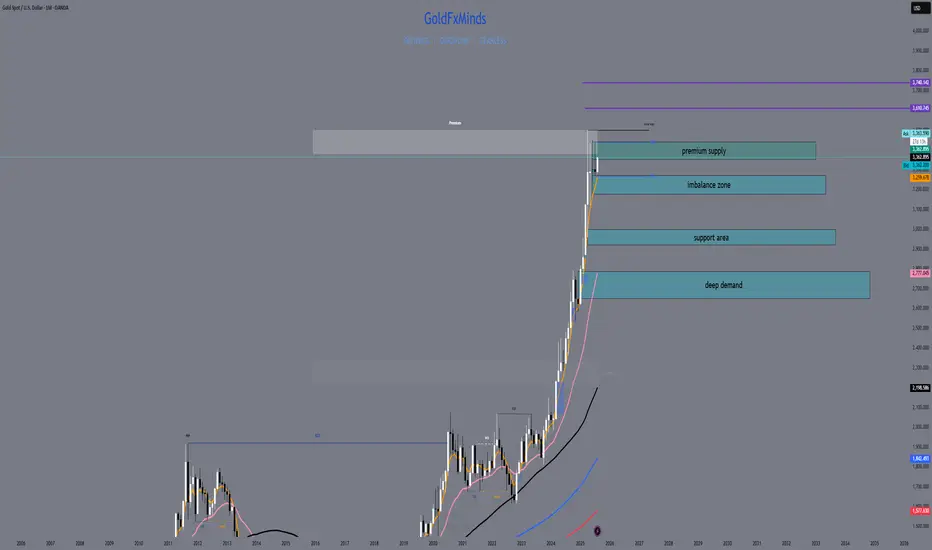
XAUUSD August 2025 Monthly OutlookWelcome to August — and welcome to the top of the macro ladder. Gold is not just rising. It’s rewriting structure.
🔸 Macro & Fundamentals
Gold opens August with a fresh impulsive breakout above $3360, fuelled by a weaker USD, rising global risk sentiment, and continued speculative positioning from institutional buyers. The upcoming Jackson Hole meeting and shifting Federal Reserve expectations create the perfect climate for volatility. All eyes are now on the premium structure top — but will gold expand beyond it or retrace to refill?
🔸 Monthly Trend & Bias (HTF Overview)
🔹 Structure: Clean bullish BOS, continuation leg in progress
🔹 Last CHoCH: April 2023 → Confirmed full trend shift bullish
🔹 Current Monthly Candle: Explosive push into supply with top wick rejection beginning to show
🔹 Bias: Still bullish but in extreme premium — watch for cooling/rebalancing
🔸 EMA Structure
| EMA Type | Status | Signal |
| ----------- | -------------- | ------------------------------------- |
| EMA 5 / 21 | Strong Bullish | Dynamic expansion, steep angle upward
| EMA 50 | Below | Clean breakout from range
| EMA 100/200 | Far below | Long-term uptrend deeply intact
🔸 Key HTF Levels (Wick-to-Wick Mapping)
Zone Type Price Range Confluences
🔴 Premium Supply 3350 – 3439 Monthly FVG + Wick exhaustion + RSI 80+
🔵 Bullish Imbalance 3180 – 3270 Monthly FVG + old BOS + EMA5 baseline
🔵 Mid-Level Support 2920 – 3000 Monthly OB + FVG + structure base
🔵 Deep Demand 2670 – 2780 HTF equilibrium zone + RSI support
✅ The current candle has pierced into the final wick supply, but with clear signs of loss in momentum.
⚠️ If 3439 breaks cleanly, next expansion zone opens toward 3505 → 3610 (Fibonacci projection). Otherwise, expect cooling to 3270–3180 first.
🔸 Fibonacci Context
🔻 Swing Low: 1810
🔺 Swing High: 3439
🎯 Current price ($3363) sits just below the 100% Fibonacci projection, with the 1.272 and 1.618 extensions at 3610 and 3740.
This confirms we are in a macro premium, and any long positions from here forward must be built only on strong LTF confirmation or clean pullbacks into value.
🔸 August Scenarios
🟢 Scenario 1 – Breakout + Price Discovery
If bulls break 3439 with strong volume and close:
New leg toward 3505 → 3610 opens
Watch for LTF continuation on H4–D1 with bullish OB reentry
Only valid if 3350 holds as new support
🔻 Scenario 2 – Rejection + Healthy Pullback
If price holds below 3439 and monthly wick exhausts:
Clean retracement toward 3270 → 3180 expected
EMA5/21 rebalancing will support bullish structure
Deeper rejection could retest 3070 zone if volatility spikes
🔸 Conclusion & Action Plan
We open August fully inside the last monthly supply zone. Trend is still bullish, but RSI, FVGs, and EMA distance warn us: this is not the time to chase — it’s time to wait for structure to speak.
📌 Key pivot = 3439.
Above it → Expansion.
Below it → Retracement.
Let August unfold — but stay sharp. The next big move will be born from this compression.
—
What’s your take — are we just getting started or about to cool off?
Drop your thoughts, chart it out, and stay ready for what August brings. ⚔️
—
❤️ Like if you enjoy clean, actionable updates🚀🚀🚀
🔁 Share with traders who love structure over noise
With clarity, confidence, and control,
GoldFxMinds
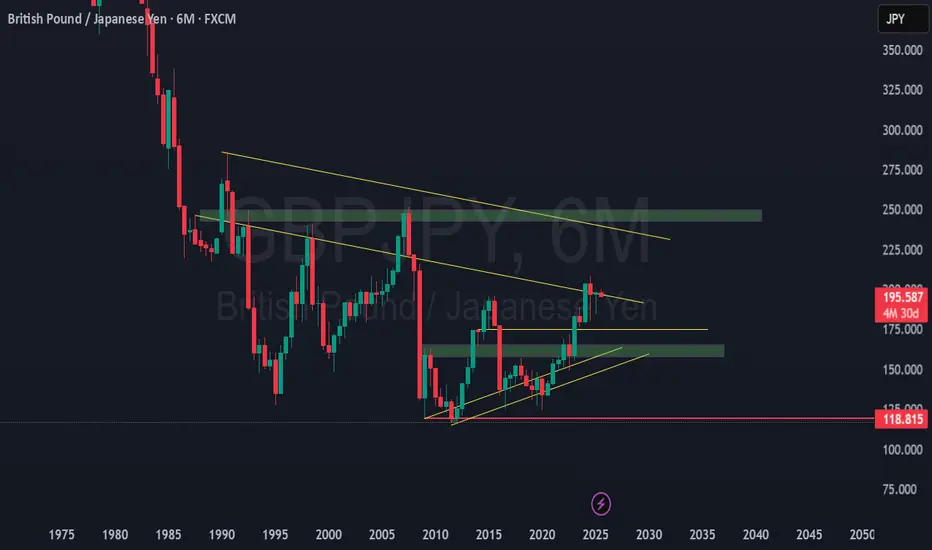
why not eh doodling on the chart, I can change my mind depends on how price moves
key levels and 4 trendlines to gauge the stenght of the waves
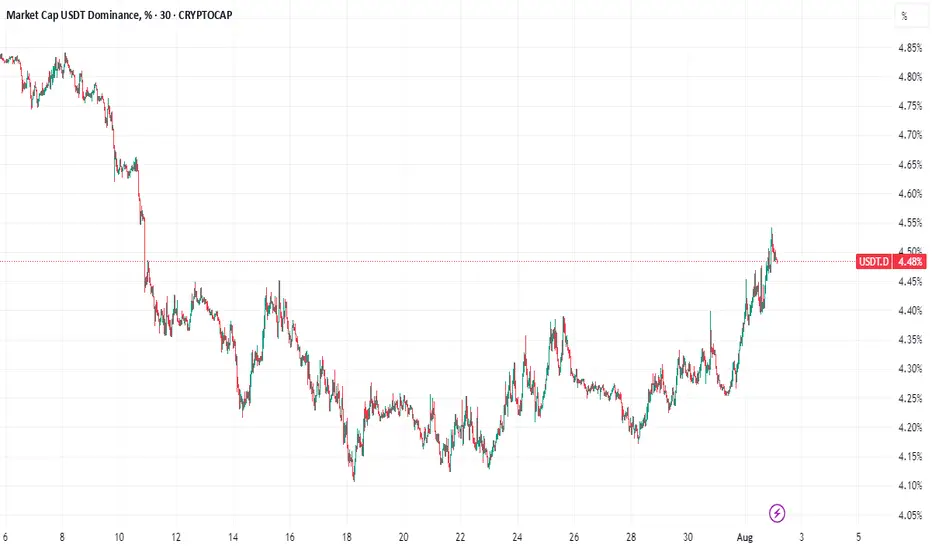
Tether Rakes in $4.9B Q2 Profit, Cementing Its Reign as Crypto’sTether Q2 Net Profit Hits $4.9 Billion, Pushing Total Earnings to $5.7 Billion: What It Means for the Crypto Industry
Tether Holdings Ltd., the issuer of the world’s largest stablecoin USDT, has once again made headlines with its Q2 2025 earnings report, revealing a staggering net profit of $4.96 billion. This brings the company’s total profits for the first half of the year to $5.7 billion—a record-breaking milestone for both the company and the broader stablecoin ecosystem.
This article explores the implications of Tether’s Q2 performance, the sources of its revenue, its impact on the crypto markets, and the growing significance of stablecoins in the evolving financial landscape.
________________________________________
A Record-Setting Quarter for Tether
Tether’s Q2 2025 results have astonished even seasoned analysts. The company’s reported $4.96 billion in net profit in a single quarter represents one of the most profitable periods in the history of any fintech or crypto-native company. What’s even more remarkable is that this profit was not driven by speculative trading or token sales, but by conservative, yield-generating strategies rooted in traditional finance.
The company’s Q1 earnings were already impressive at $0.76 billion, but Q2’s results eclipse those numbers entirely. Tether’s cumulative profit year-to-date now stands at $5.72 billion, putting it on track to potentially exceed $10 billion in earnings for the full year if current trends continue.
________________________________________
What’s Driving Tether’s Massive Profit?
Tether’s incredible profitability is primarily fueled by one key factor: the interest earned on its reserves. As the issuer of USDT, Tether is responsible for maintaining a 1:1 backing of every token in circulation. These reserves are primarily held in short-term U.S. Treasury Bills (T-Bills), reverse repos, and cash equivalents.
Here’s a breakdown of the main profit drivers:
1. High Interest Rates on U.S. Treasuries
With the U.S. Federal Reserve maintaining elevated interest rates to combat inflation, short-term T-Bills have become highly lucrative. Tether holds tens of billions of dollars in these instruments, generating billions in annual interest income.
For example, the yield on a 3-month Treasury bill in Q2 2025 averaged around 5.2%, and Tether’s reserve base has hovered near $90 billion to $100 billion. Even a conservative allocation can earn several billion dollars in annual yield.
2. Reverse Repurchase Agreements (Reverse Repos)
Tether has also expanded its use of reverse repos, which allow it to lend cash to counterparties in exchange for securities, earning a premium on the transaction. This has contributed significantly to its earnings, especially in a high-yield environment.
3. Gold Holdings and Bitcoin Exposure
Tether has acknowledged that a small portion of its reserves includes gold and Bitcoin holdings. These assets appreciated in Q2, contributing to the overall profit. While not the primary revenue source, their performance added notable value during the quarter.
4. Equity Investments
The company has begun investing in infrastructure and technology firms related to blockchain and AI. While these investments are not liquid, mark-to-market gains may have also contributed to the net profit figure.
________________________________________
A Closer Look at Tether’s Reserve Report
Tether’s Q2 attestation report, published alongside its earnings update, provides transparency into how its assets are allocated. Here are some highlights:
• Over 85% of reserves are held in U.S. Treasury instruments
• $5.4 billion in excess reserves—a buffer above the value of circulating USDT
• $3.3 billion in gold and Bitcoin holdings
• Minimal exposure to unsecured commercial paper or riskier debt instruments
Tether has continuously emphasized its commitment to transparency and risk management. Unlike in its early years, when it faced criticism over opaque reserve practices, the company now releases quarterly attestations audited by third-party firms such as BDO Italia.
________________________________________
USDT’s Growing Dominance
Tether’s profits are closely tied to the growth of its flagship product: USDT, the world’s largest stablecoin by market cap. As of August 2025, USDT has a circulating supply exceeding $110 billion, giving it a dominant share of the stablecoin market.
This growth can be attributed to several factors:
1. Increased Adoption in Emerging Markets
USDT is widely used in countries with unstable fiat currencies, such as Argentina, Nigeria, and Turkey. For many users, USDT represents a dollar-denominated safe haven in environments plagued by inflation and capital controls.
2. DeFi and Cross-border Payments
USDT continues to be a core asset in decentralized finance (DeFi) protocols, serving as a stable medium of exchange and collateral. It's also a preferred tool for cross-border remittances, given its speed and low transaction costs compared to traditional banking systems.
3. Institutional Integration
Major crypto exchanges, custodians, and payment processors have incorporated USDT into their platforms, driving further liquidity and utility. In many cases, USDT is preferred over fiat due to its 24/7 availability and blockchain-native nature.
________________________________________
What Does This Mean for the Crypto Industry?
Tether’s Q2 performance is more than just a corporate milestone—it’s a bellwether moment for the crypto industry. It signifies the maturation and institutionalization of digital assets and stablecoins. Here’s what it means for the broader ecosystem:
1. Stablecoins as Profitable Financial Products
Tether’s profitability proves that stablecoins are no longer just “crypto plumbing.” They are now financial products generating billions in yield, much like money market funds. This is reshaping how investors and regulators think about stablecoins—not as speculative tools, but as interest-bearing assets backed by real-world securities.
2. Regulatory Scrutiny Will Intensify
With Tether generating profits that rival traditional banks, expect regulators to increase oversight. Stablecoins have long been in the crosshairs of the U.S. Treasury, SEC, and global central banks, and Tether’s dominant market share will likely place it under further examination.
However, Tether’s transparency efforts, including quarterly attestations and reserve disclosures, may help it navigate these regulatory waters more effectively than in the past.
3. Competition Will Escalate
Tether’s extraordinary profits will likely attract new entrants and existing competitors to the stablecoin arena. Circle’s USDC, PayPal’s PYUSD, and even central bank digital currencies (CBDCs) are all vying for market share.
Tether’s early-mover advantage, global reach, and deep liquidity make it hard to displace, but increased competition could pressure margins in the long term.
4. Decentralized Alternatives Will Seek Market Share
Decentralized stablecoins like DAI, FRAX, and USDD aim to offer alternatives to centralized issuers like Tether. While they remain relatively small, the ethos of decentralization might gain appeal, especially in regulatory-heavy environments.
Still, decentralized stablecoins have struggled to maintain pegs during market stress, giving Tether an edge in terms of trust and resilience.
________________________________________
The Road Ahead for Tether
As Tether moves into the second half of 2025, several strategic themes will define its trajectory:
Continued Profitability
If interest rates remain elevated and USDT circulation continues to grow, Tether’s annual profit could reach or exceed $10 billion—putting it in league with the most profitable fintech firms globally. This surplus could be reinvested in:
• Infrastructure expansion
• Strategic acquisitions
• Reserve diversification
• R&D for stablecoin innovation
Expansion into Emerging Markets
Tether has hinted at expanding its presence in Latin America, Africa, and Southeast Asia, where demand for dollar-denominated assets is high and banking infrastructure is limited. Expect to see more localized partnerships and on-ramp/off-ramp solutions.
Embracing Blockchain Innovation
Tether is already deployed on multiple blockchains—Ethereum, Tron, Solana, and more. The company is likely to support new Layer 1s and Layer 2s to enhance speed, reduce costs, and maintain competitiveness in the DeFi space.
There are also rumors that Tether may be exploring tokenized asset offerings and programmable money features, allowing USDT to integrate more deeply with smart contracts and enterprise use cases.
________________________________________
Criticisms and Controversies: Still Lingering?
Despite its success, Tether continues to face criticism from parts of the crypto community and regulatory world. Concerns include:
• Lack of full audits (attestations are not the same as full financial audits)
• Opaque ownership structure
• Past legal issues, including settlements with the New York Attorney General and the U.S. CFTC
However, it’s worth noting that Tether has addressed many of these concerns over the past two years. Its transparency has improved, and its operations have become more conservative and professional.
Still, its scale and impact on the crypto market mean that any misstep could have systemic consequences. Investors and regulators alike will continue to scrutinize its activities.
________________________________________
Final Thoughts: Tether’s Moment of Ascendance
Tether’s Q2 2025 net profit of $4.96 billion doesn’t just reflect a successful quarter—it marks a paradigm shift in crypto finance. What began as a controversial stablecoin project has evolved into a global financial powerhouse, rivaling traditional banks and asset managers in profitability.
More than just a win for Tether, this moment signals the growing legitimacy of stablecoins in the global financial system. It shows that crypto-native firms can not only survive but thrive in traditional financial environments, leveraging yield, transparency, and blockchain infrastructure to create sustainable business models.
As the world watches, Tether’s next chapters will likely be shaped by innovation, regulation, and global expansion. But for now, with $5.7 billion in profits in just six months, one thing is clear:
Tether is no longer just a stablecoin issuer—it’s one of the most powerful financial entities
in the digital age.
________________________________________
Disclaimer: This article is for informational purposes only. It does not constitute financial advice. Always conduct your own research before making investment decisions.
$UNH BEARISH SETUP – WEEK OF AUG 1
🔻 **\ NYSE:UNH BEARISH SETUP – WEEK OF AUG 1** 🔻
**UnitedHealth Group (UNH)** is showing classic breakdown signs. Here’s what the data says:
📉 **RSI Breakdown**
• Daily RSI: **20.6**
• Weekly RSI: **19.3**
→ Deeply oversold + no bounce = 🚨 momentum flush risk
📊 **Volume Surge**
• Weekly Volume: **145M** (1.9x avg)
→ Heavy **institutional selling**, NOT dip buying
🧠 **Options Insight**
• Call/Put Ratio: **1.17** = Slight bullish noise
• But... Expiry Gamma is 🚨HIGH = IV Crush incoming
• VIX: **20.7** = Volatility tailwinds intact
💣 **TRADE IDEA (PUT PLAY)**
• Direction: **BUY PUTS**
• Strike: **\$230**
• Expiry: **08/08/2025**
• Entry: **Monday Open**
• Target Premium: **\$0.10**
• 🎯 PT: \$0.30 | 🛑 SL: \$0.03
• Confidence: **70%**
📌 **Narrative**:
Oversold + High Volume Dump + No support bounce = Perfect storm for continuation dump. This is a high gamma play, time-sensitive, low-cost lotto setup. Risk small. Aim big.
---
💥 **Watchlist Tag**: ` NYSE:UNH AMEX:SPY AMEX:XLV `
🧠 **Strategy Tag**: #OversoldFlush #PutPlay #0DTETrap
🚀 Follow for more weekly earnings & options breakdowns!

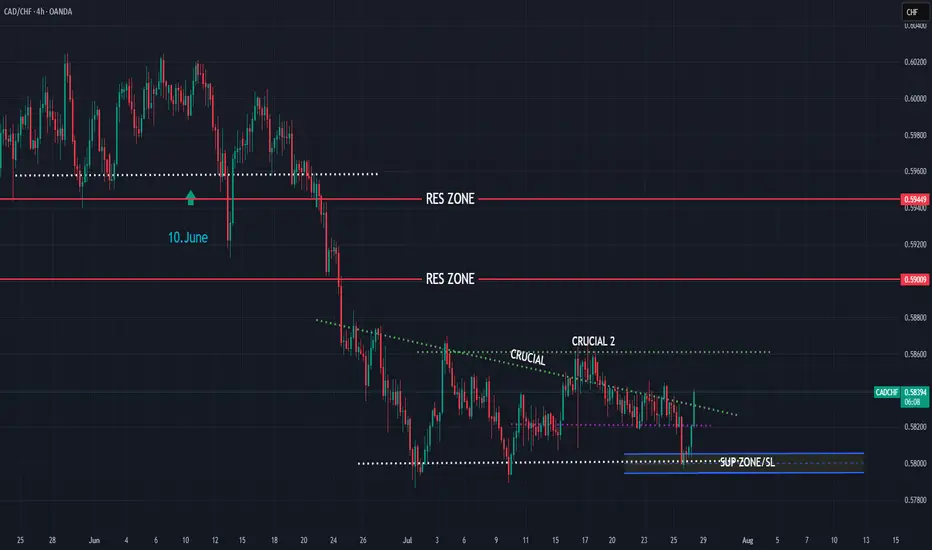
CADCHF bullish expectations for next period
OANDA:CADCHF interesting chart, bearish trend last 5M, i am have bullish expectations on 10.June, but price is make one more strong bearish push.
Currently nice structure created, price pushing bullish, from here expectations are bullish trend to see.
SUP zone: 0.58050
RES zone: 0.59000, 0.59450
Daily Orderflow on ES and NQ. 01.08.2025, NFP FridayCME_MINI:NQ1! CME_MINI:ES1!
Orderflow explanation. Sessional delivery and New York Price action
