$BIO 1D Trading Explosion - Unlock Key Levels & RSI SecretsBINANCE:BIOUSDT
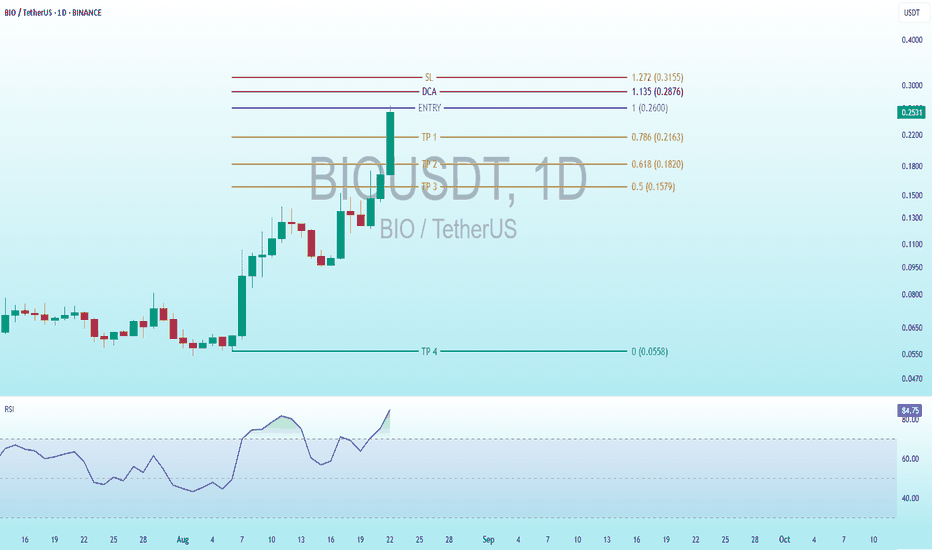
Key Levels (marked with lines):
SL (Stop Loss): 1.272 (0.3155 USDT) - A level to close the position at a loss.
DCA (Dollar Cost Averaging): 1.135 (0.2876 USDT) - A level for additional purchases if the price drops.
Entry (Entry Point): 1 (0.2600 - 0.2570 USDT) - The price where the position was opened.
TP1: 0.786 (0.2163 USDT) - The price where the position was opened.
TP2: (Take Profit 1): 0.618 (0.1820 USDT) - The first profit target.
TP3: 0.5 (0.1579 USDT) - The second profit target.
TP4: 0.0558 (no specific price marked, but it is a low profit level).
Price Movement:The price had a noticeable increase up to the entry level (0.786), but then experienced a sharp decline, approaching the TP levels.
The latest candlestick is green, suggesting a positive daily close, but it is still far from previous highs.
RSI Indicator (Relative Strength Index):RSI is around 85.13, indicating an overbought condition. This suggests that the price may be overextended and could see a reversal or consolidation.
Interpretation:Strategy: The chart suggests a trading strategy with an entry at 0.786, with profit targets (TP) and a stop-loss (SL) for risk management. The DCA level indicates a plan for additional purchases if the price drops.
Current Status: With a high RSI and the price near TP1, it might be time to take profits or monitor for a potential pullback.
Risk: The SL level is relatively high, suggesting tolerance for losses, but the risk increases if the price continues to drop toward DCA.
Biousdtshort
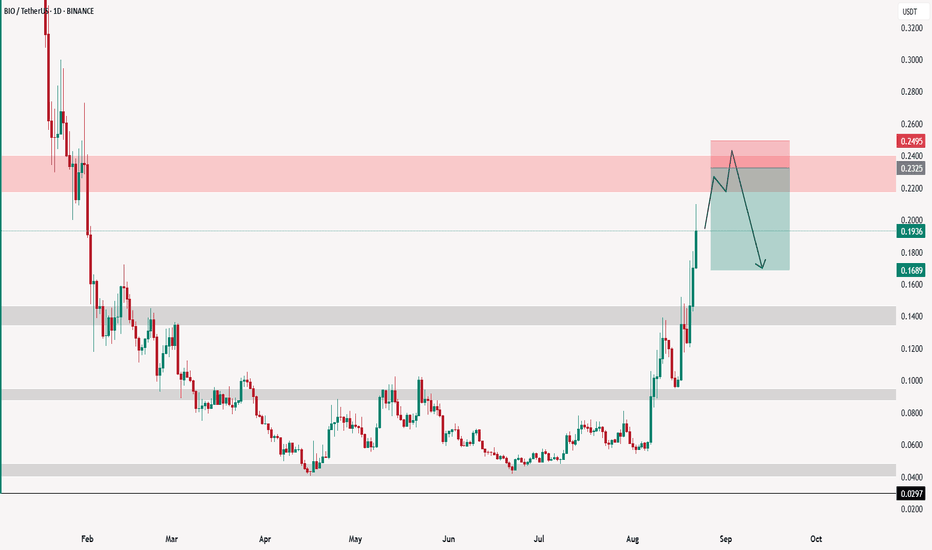
BIO CON PRICE ANALYSIS AND POSSIBLE TRADE IDEAS !!NYSE:BIO Coin Update 🎣.
• Currently NYSE:BIO Coin Price trading in overbought zone on LTF's and HTF's.
• If you get bearish confirmation right now or Until it's Price trading below 0.23$ ( Daily resistance) then you are able to execute quick short scalp on it. ( with tight SL)
• Personally if i take trade then i will update✅
Warning : That's just my analysis DYOR Before taking any action🚨🚨
Comprehensive Technical Analysis of BIOBINANCE:BIOUSDT
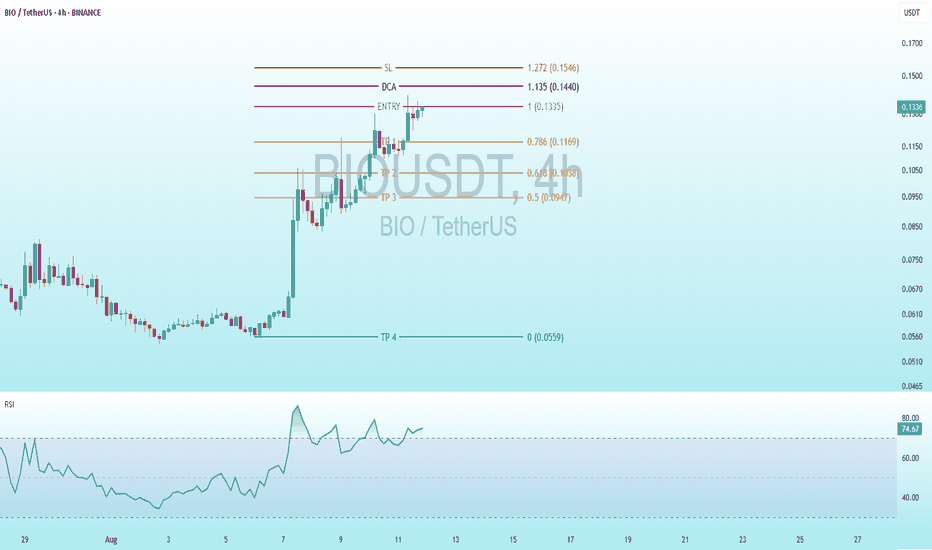
Fibonacci Levels and Trading Setup
These levels appear to be Fibonacci retracement/extension levels, drawn from a low (0% at 0.0559 USD) to a high (100% at 0.1335 USD), but used for a short setup. This is unusual for an uptrend but suggests the chart creator (AltcoinPioneers) expects a decline after the pullback. Here are the detailed levels (with prices in brackets):
SL (Stop Loss, red): 1.272 (0.1546 USD) – Extension level above 100%, where the position closes if the price rises further (maximum risk).
DCA (black): 1.135 (0.1440 USD) – Possibly a level to add to the short (average down) if the price rises slightly, to lower the average cost.
ENTRY (purple): 1 (0.1335 USD) – Entry level for short (sell). The current price is very close (0.1310), so it might be active or pending.
TP1 (orange): 0.786 (0.1169 USD) – First Take Profit, a retracement level.
TP2 (orange): 0.614 (0.1038 USD) – Second TP, near the golden ratio (0.618).
TP3 (orange): 0.5 (0.0947 USD) – Third TP, half of the range.
TP4 (green?): 0 (0.0559 USD) – Final TP, at the previous low.
RSI Indicator Analysis
Current Value: Around 70-73, with the blue line peaking at ~80 and now slightly declining.
RSI Trend: Started from ~30 (oversold) during the price decline, rose sharply with the upward impulse (indicating bullish momentum), but is now in the overbought zone (>70). This signals the asset might be "overpriced" in the short term, and a correction downward is possible (bearish divergence if the price doesn’t confirm upward movement).
Interpretation: An RSI above 70 often precedes a pullback or bearish reversal, especially on a 4h timeframe. If it falls below 50, it confirms weakness.


