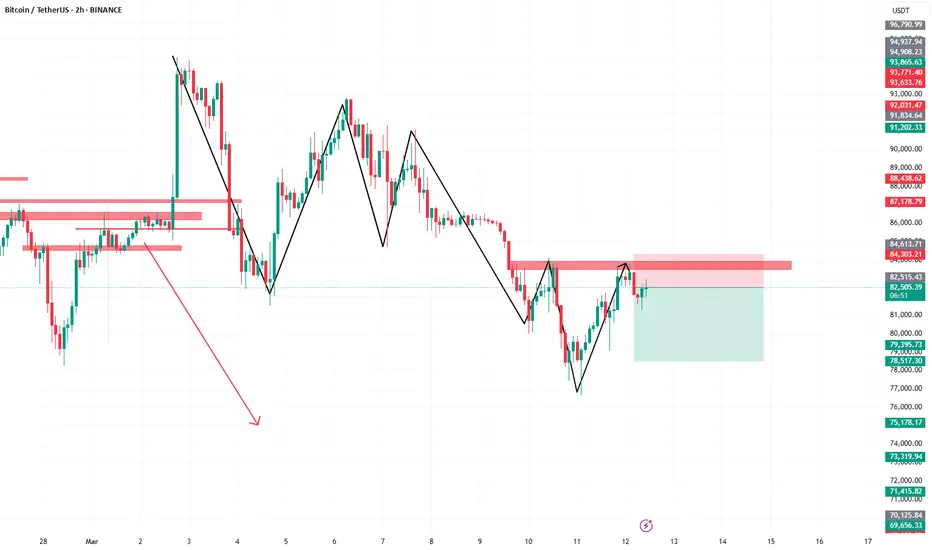
BTC/USDT SELL/SHORTbitcoin can move down
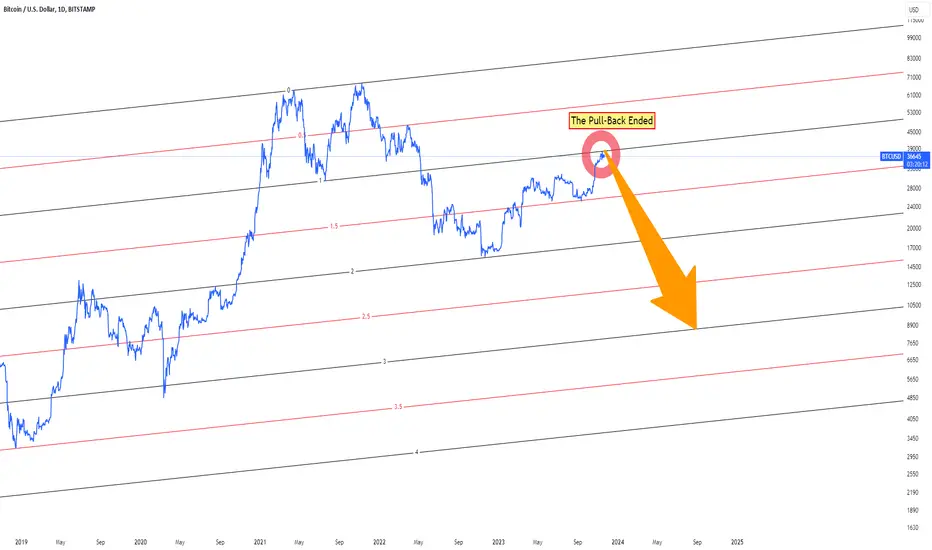
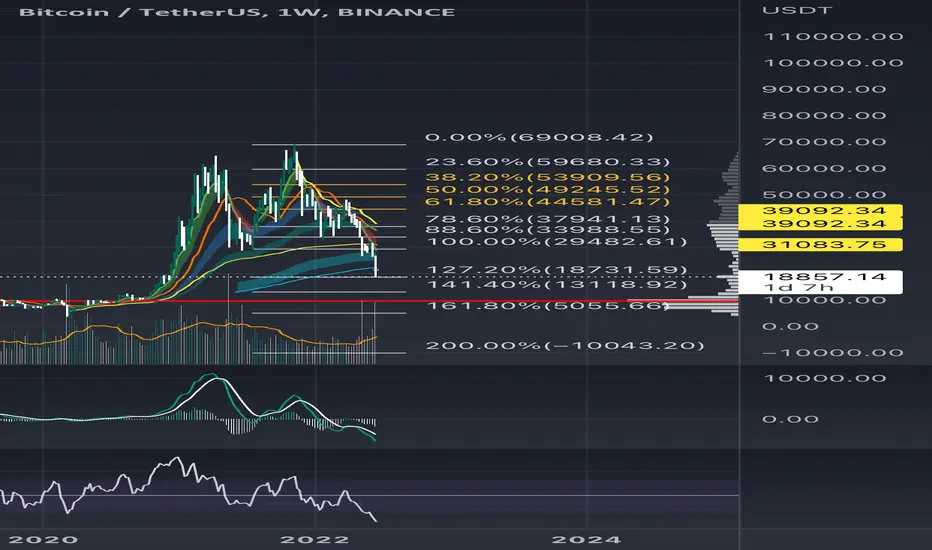
In this analysis, we are observing the potential repetition of market history by comparing the current Bitcoin price action to the previous bearish cycle. By utilizing Fibonacci retracement levels, historical patterns, , we can formulate a hypothesis that the market might follow a similar trajectory if bearish sentiment prevails.
Bitcoin-bitcoin
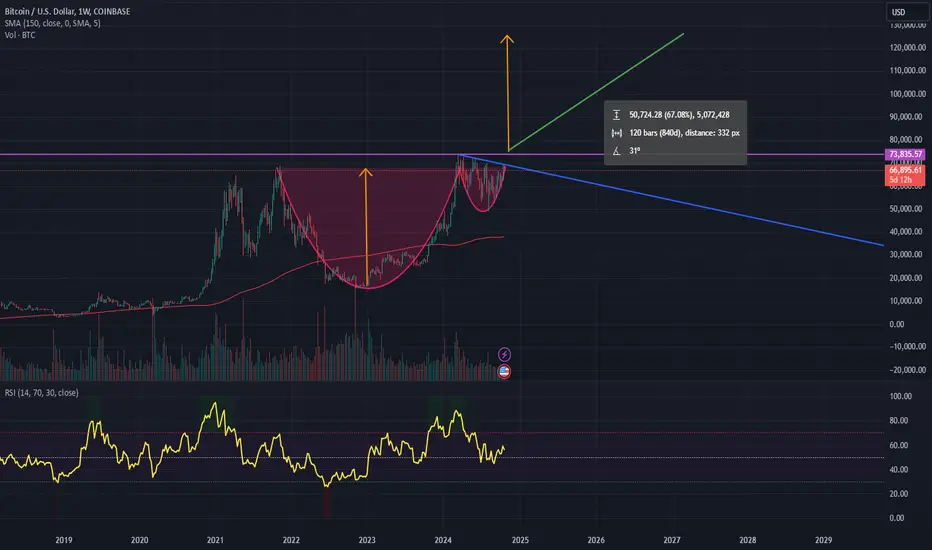
Bitcoin to 120,000 ?Bitcoin to 120,000 ? Weekly Cup & Handle pattern + Above the average line 150 + After a fourth crossing event. Only an idea and not a recommendation for trading!
Time to Buy Bitcoin Bitcoin downward momentum should be over now... Waiting for a lower time frame confirmation or shift to the upside in a higher time frame like 30mins or 1hr I mean a break of recent pullback to confirm a trend change before taking the risk. Buy Bitcoin and hold

Time to Buy Bitcoin Bitcoin downward momentum should be over now... Waiting for a lower time frame confirmation or shift to the upside in a higher time frame like 30mins or 1hr I mean a break of recent pullback to confirm a trend change before taking the risk. Buy Bitcoin and hold
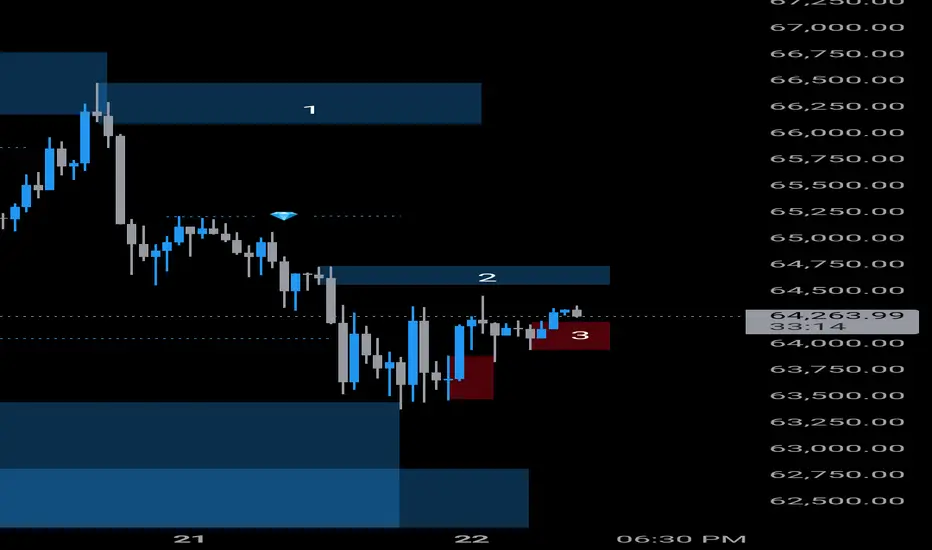
BTCBTC mitigating Daily timeframe order block to moving upside. Next Bitcoin mitigate order block (3) to moving upside is high possible.
Order block (2) was sell side order block. So some downside correction possible. If the order block (2) was fail, bitcoin moving upside.
Bitcoin mitigating Daily timeframe order block. So the Trend reversal was high possible. But $62800 is best support zone. Maybe Bitcoin moving downside to touch the support to moving upside is high possible.
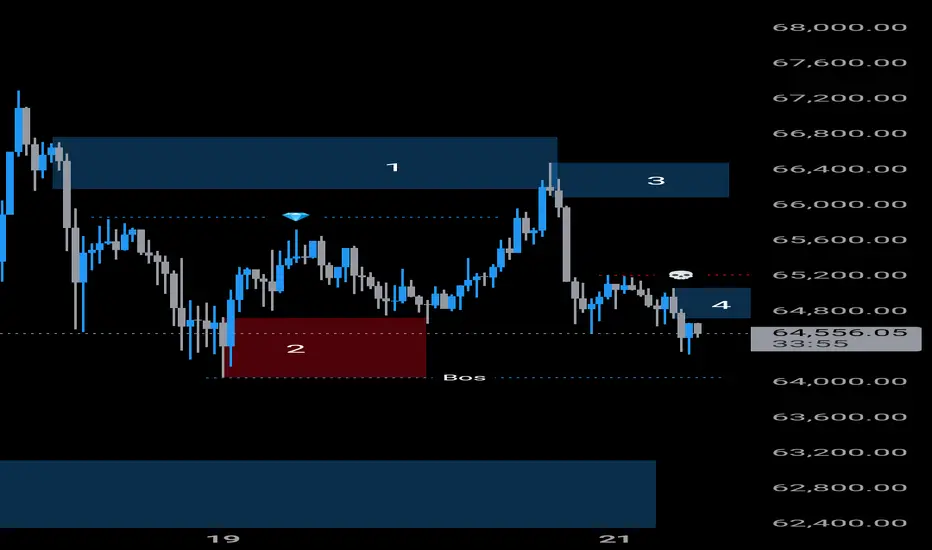
BTCBTC mitigating orderblock (1) to moving downside. Order block (2) was already work. So this time it was fail high possible.
Order block (4) was next sell side order block. If this order block was fail, bitcoin moving upside and sweep the swing high (💀) to moving downside.
Next $63100 is possible support area.
BTC Bitcoin Strong Bullish Will Rise to 37000,46000 and 71000USDBTC Bulls to Retarget $31,500
BTC could be in for a choppy session as investors consider the chances of SEC approvals for the ETFs and US inflation in focus.
the crypto news wires provided much-needed support. News of Fidelity filing for a spot Bitcoin Exchange-Traded Fund (ETF) was the key to the bullish session.
This morning, BTC was down 0.03% to $30,524. A bearish start to the day saw BTC fall from an early high of $30,534 to a low of $30,507.
Looking at the EMAs and the 4-hourly candlestick chart (below), the EMAs sent bullish signals. BTC sat above the 50-day EMA ($30,032). The 50-day EMA pulled further away from the 100-day EMA, with the 100-day EMA widening from the 200-day EMA, sending bullish signals.
A hold above S1 ($30,158) and the 50-day EMA ($30,032) would support a move through R1 ($30,882) to give the bulls a run at R2 ($31,232). However, a fall through S1 ($30,158) and the 50-day EMA ($30,032) would bring S2 ($29,784) into view. A fall through the 50-day EMA would send a bearish signal.
Resistance & Support Levels
R1 – $ 30,882 S1 – $ 30,158
R2 – $ 31,232 S2 – $ 29,784
R3 – $ 31,956 S3 – $ 29,060
Strategy Bullish
3Lots
2 Lots will be excecuted at Profit Target Zones
1Lot will follow the Trend
It will be only!!! excecuted ,if Bullish Trend changes
The stops will be delivered as soon as possible to break even,better some pips above the Buyinh price
I have marked my profit targets
Psychology:
1:The price is always right
2The Market is alwas right
3 The Chart is always right
4 IGNORE THE NEWS; Plan your trades and trade your plan.
5Drawdowns are partof the game
6 Risk management and money mangement is King!
7 wHATEVER HAPPENS;sTICK TO YOUR PLAN!
8 In a bear market no price is weak enough
9 In a bull market no price is strong enough
10 Patience !Wait for confirmation: Control emotions and tensions.

Bitcoin (Urgent Analysis) 😱😱Hello Guys.
How are you?
I hope you always be happy and successful
➖➖➖➖➖➖➖➖➖➖➖➖➖➖➖➖➖➖➖➖➖➖
Today I want to give you an update on the movement of the Bitcoin
So, Let's go.
In my opinion, Bitcoin is done, Unless the price can stabilize above $38300 with a strong candle, preferably Marubozu with high volume (stay above 38300 for 2-3 days) the volume must confirm this move.
If Bitcoin succeeds in being stable above 38300, the next target will be 58000 USD
otherwise, Bitcoin will drop more than you think. and we are still in the bearish trend.
Wait for the big news. for example, canceling the ETF at this time The expansion of the war in the Middle East the start of the China-Taiwan war, or something else that will cause to drop in Gold and other markets.
Please don’t forget to write your comments ✍️✍️ like 👍👍 and Share 👌👌 this vision with your friends.
And Tell me do you agree with me or Not?
Please don't hesitate to write your comments below.
❤️❤️ Wish you the best ❤️❤️
I believe my analysis.
Good Luck
Ho3ein.mnD
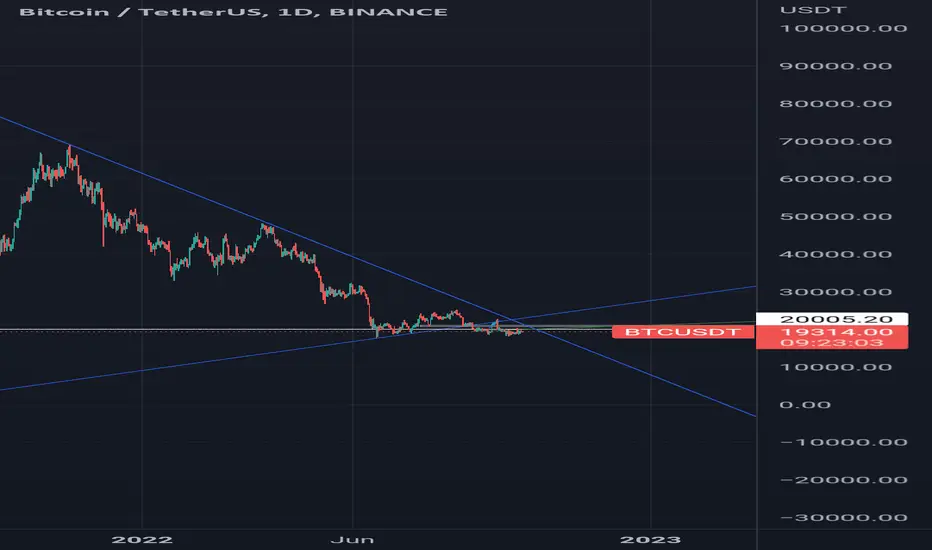
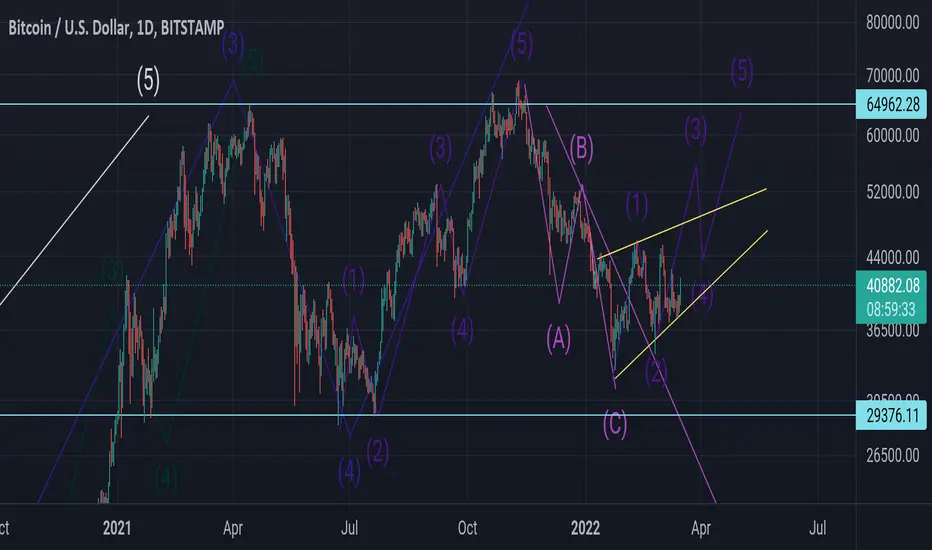
BITCOIN long term technical analysis Two important trend lines, you can see on my chart, what I think is we're gonna see more of bearish market!
I believe we're gonna test the 17000-17500 soon enough.
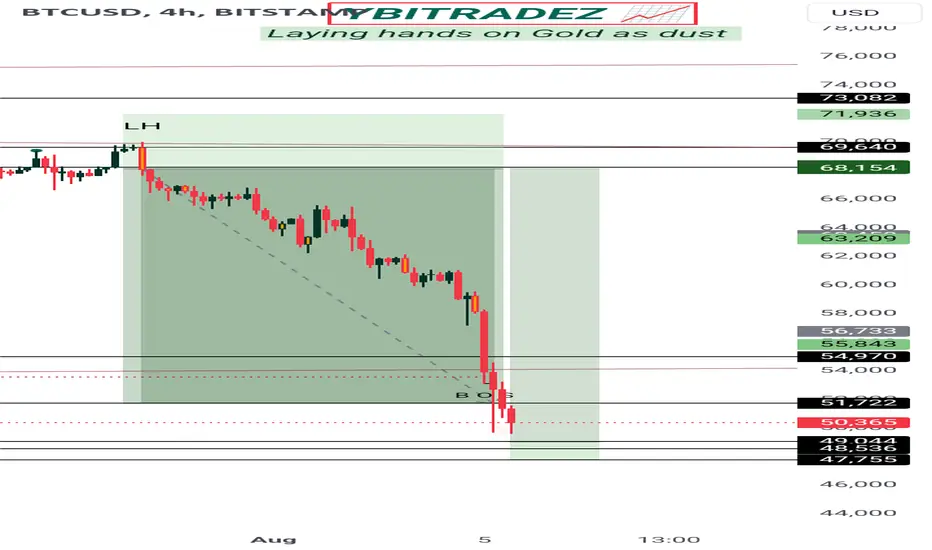
Bitcoin Day Trading Setups, Scalping Entries🖥️ We have determined there is a 65% chance Bitcoin will Fall from our current entry point.
📉 SHORT BTC - Entry Price Adj. to : $24,460 📉
💵 Length of trade: we are expecting BTC to hit a 300 scalp, with a high end of $500, and a minimum expectation of $200.
We see BTC back testing $24,000
We are playing off that generally after these news spikes with the CPI, we have a retracement in the next 48 hours.
🕰️ Duration of trade: we are expecting this to occur in 6 hours of this signal, with a maximum duration of 9 hours .

BTC bounce or die ?Few things to note. BTC is now at a fib extension which may or may not hold as support for a bit . We’re also near 200MA on the weekly . POC (price lvl with most volume ) currently stands at around $10,000
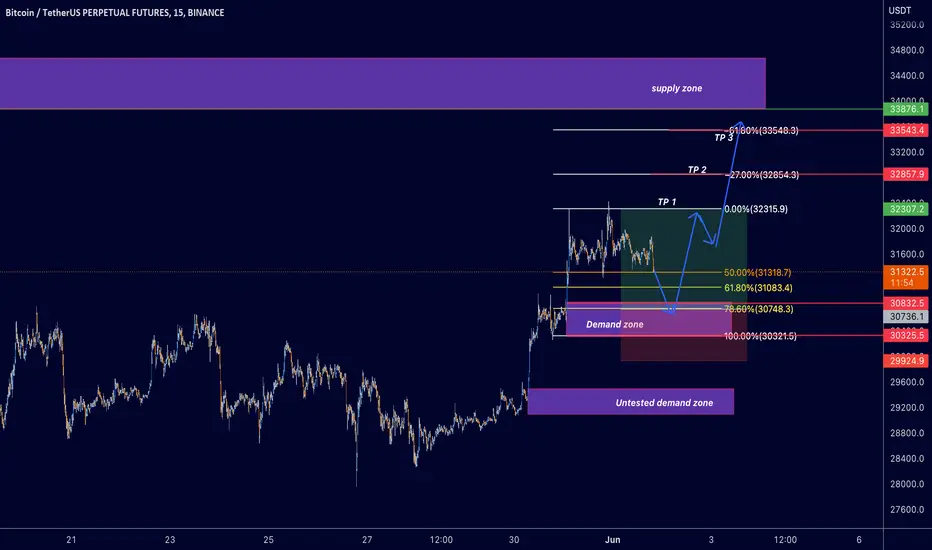
Bitcoin potential trade setupBitcoin is likely to come down to 30,832 - 30,325 before its next leg up towards 34k. This key zone also merges with our golden zone(78.6-61.8) of fib play and is a major order-block/liquidity level which is required for the push further up, as btc has ran out of steam from its previous pump.
A possible trade setup is also presenting itself,
Trade : BTCUSDTPERP
Entry - 30,736
Stop loss - 29,924
Take profit 1 - 32,307
TP 2 - 32,854
TP 3 - 33,548
DO NOT RISK MORE THEN 2% OF YOUR CAPITAL FOR THIS TRADE
Risk - Untested demand zone below stop loss. ( check charts)
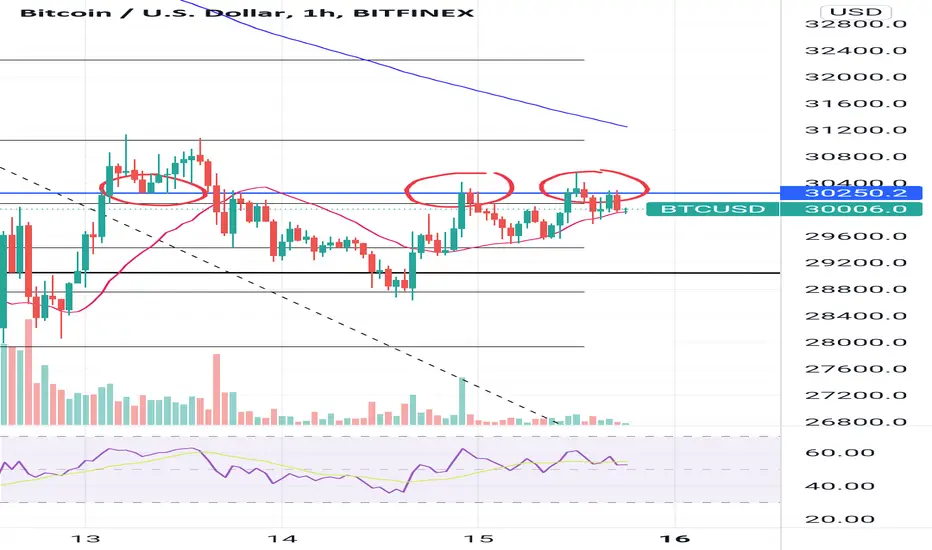
BitcoinBitcoin can't break the resistance key at $30.250 in the short term, it can be down move to $25 or $22k, nfa
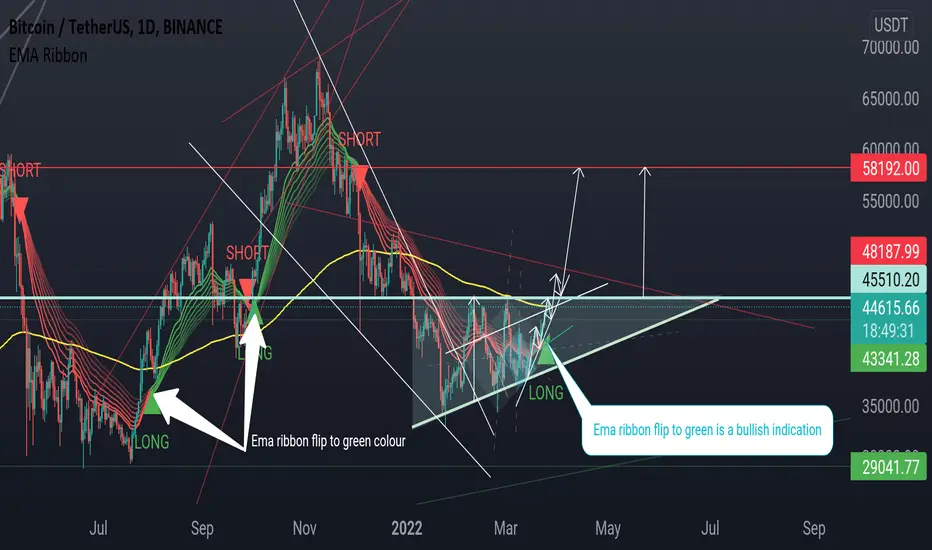
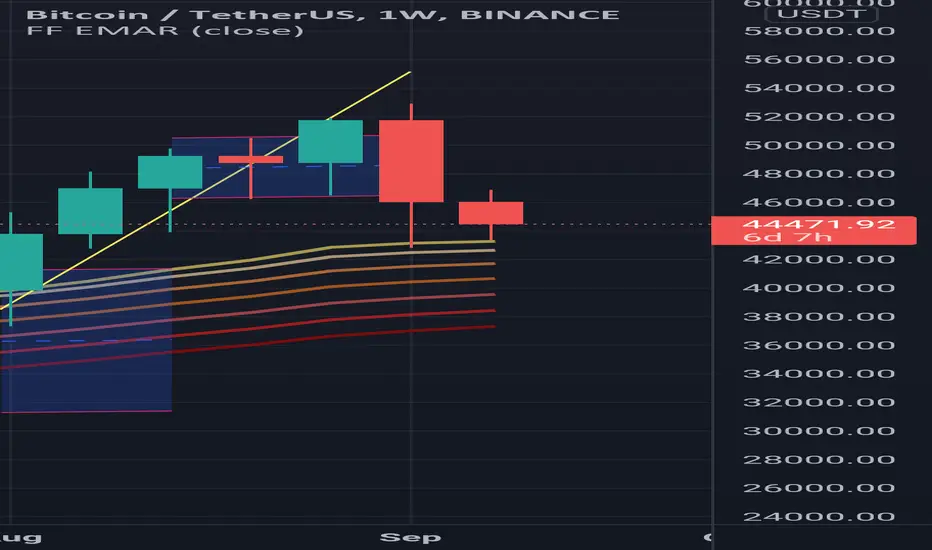
Bitcoin super bulish medium term. on my road to 58.000Bitcoin forming an ascending triangle
Is a bullish pattern for bitcoin price
And the EMA ribbon
Show flip from red to green
Is a good signal for us to long for bitcoin
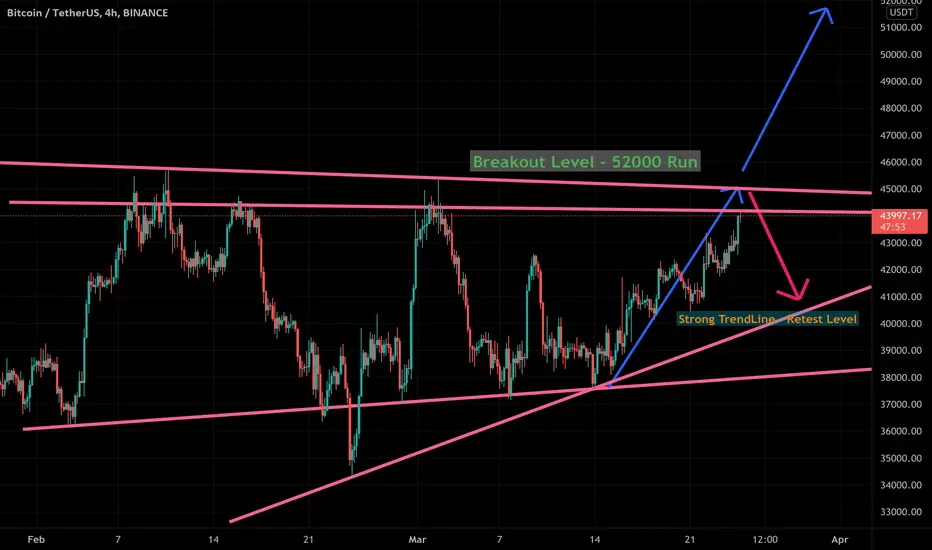
Bitcoin Try to Break Upper Level SoonThere is some good news on crypto market. I think war is an opportunity for btc. Now Bitcoin want’s to move on 52000 , but here is 3 times strong support line.
Wait untill Bitcoin test the 41000 price zone or near by . Then you have an opportunity for buy it. Also watch alter for better profit. I am purely bullish with some correction.
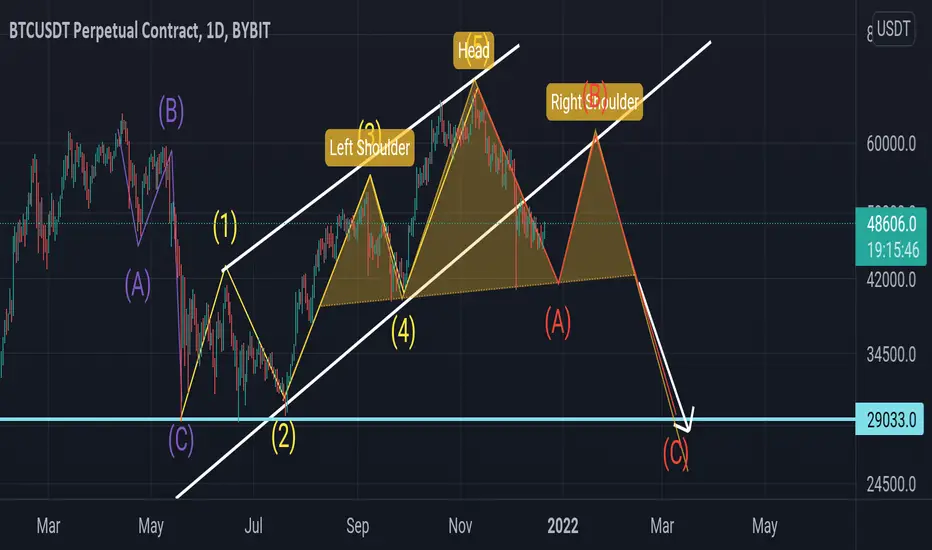
Bitcoin, possible formation of head and shoulders pattern?Bitcoin, on the 4H chart we see a formation of descending channel. Would it break to the upside and form the right shoulder? Are we on the ABC correction and going for the wave?
Bitcoin breakdown imminent If bitcoin breaks the 21 day moving average on weekly chart, I think it will go all the way down to the 200 moving average for retest.
37.5 k zone is a beautiful buy signal.

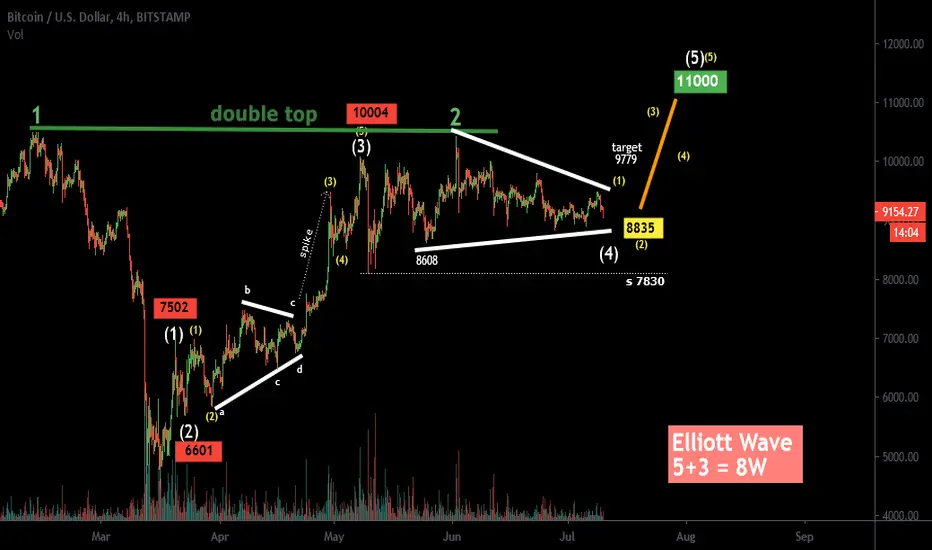
Elliott Wave for Bitcoin on 4hrs chart!We clearly see up-move and the target will be first as 9779 .
5-Wave R 11000 nearby
There is a question, what is 0 starting point of sub-wave, 8835/8608? please say in the comment section.
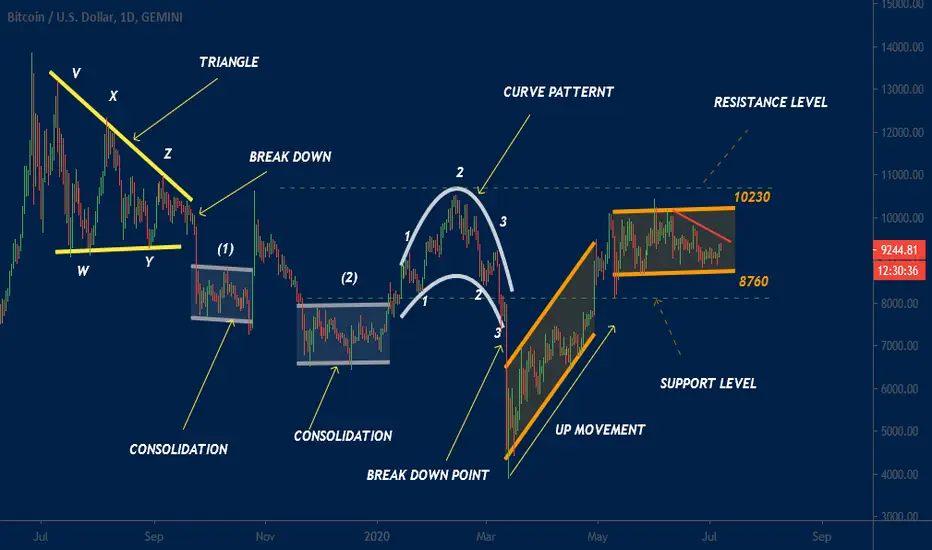
Be ready for big move on BitCoin!Consolidation/Price Rotation/Price Conjection, what you call this area is going to break very soon and the price will get a new road.
Breakout range of 10230 to 8760
If you want to deep and compressive study , kindly say in the comment section.
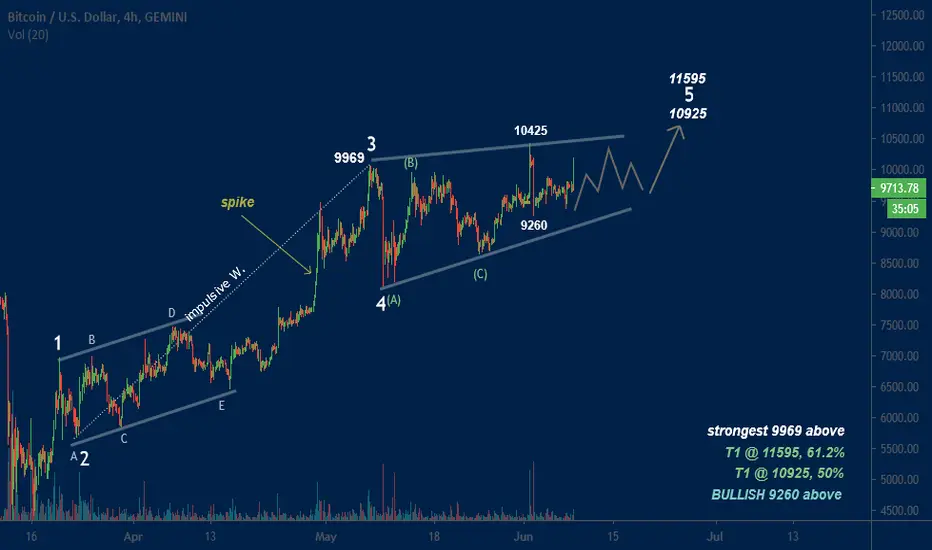
EWT-4hrs chart for BTC on long side entry levels.Buying above 9900 of 3rd Wave , for Target 10900/11500
Risky traders , can buy 9396-9260 for the same targets (10900/11500). Targets 10120-10400 if you don't want to hold longer time period.
--------------------------------------------------------------
Click on "REPLAY Button" for the previous succeed update.
PART (i)
PART (ii)
If you're happy with my hard afford, you can say in the comment section and you can share your LOVE by hitting LIKE Button.
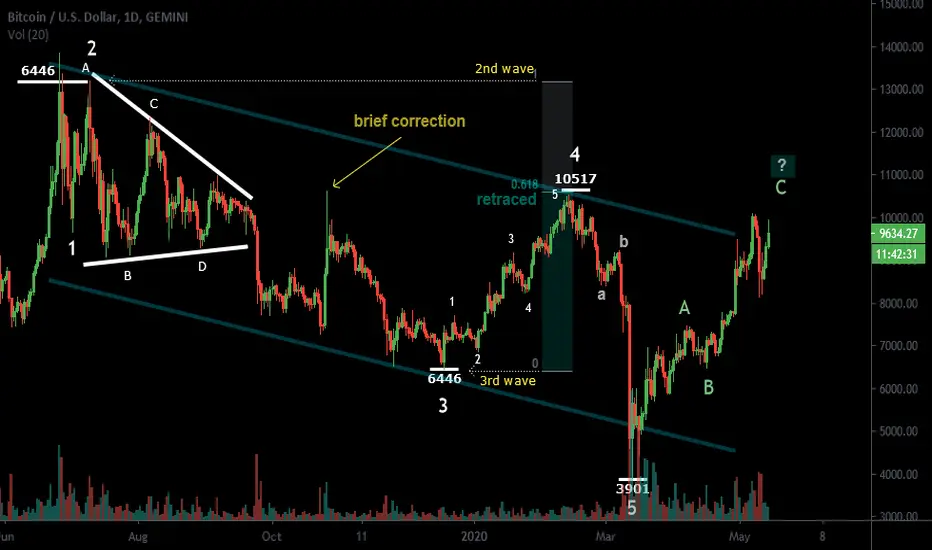
Kinnari + Elliott's wave theory (5 + 3 = Waves), Bitcoin!Attention to the rhythm of the wave for bitcoin.
---------------------------------------
Kinnari + Elliott's wave theory
5 + 3 = Waves
---------------------------------------
The price is under Wave A, B, and C.
ABCDE, Triangle leading by 2-wave.
The "Parallel Channel" is respected wave 2 and waves 4 and parallel towards 3-wave.
You have figured out that Wave 4 would normally retrace 0.618% of Wave 3.