You need a dollar dollar, a dollar💰 on Bitcoin...!!!30-min chart - New "Value Area " negative sign (U-turn)
R-8912 nearby
The "Parallel Channel" price congestion expected with decisive zone :
still not clear up or down...?
==> ✍ Kindly Vote in comment , what you think Plan A or B?
Weekly Trouble/Downtrend:
This is the road of the Bitcoin, we can see where it goes together
You & I know, trend is downward from this pattern.
Bad times are coming and I & you reap Dollars, isn't it?
It's been a long old trouble long old troublesome road below 8241 w hich can push price down free fall.
Last Selling Successfully Target achieved of Bitcoin:
Bitcoin-bitcoin

No change in PLAN, but little more advance clues! BTCPlan (B):
Sell, 10086-10333 nearby for target 8874-8838 and 8842 nearby
Bottom of the page, this plan(B) original idea posted.
=> Below 9819, the price is not bullish and its can continue to create new value are approximately given in projection.
If you are holding your position from Plan (B), trial stop-loss on closing base of candle above 9818. And you can continue to hold first target at 9444 nearby.
You can write your query in comment section and kindly dont forget to hit LIKE button.
The parallel channel has two resistance, one is at 9857 nearby and one exact near the cmp.
The positive sign is developed. two chart are opposite to each other.
Be active and careful...!
Just look at this simple support .
-------------Active call for swing traders------------
Follow me if you want more update. Thanks.

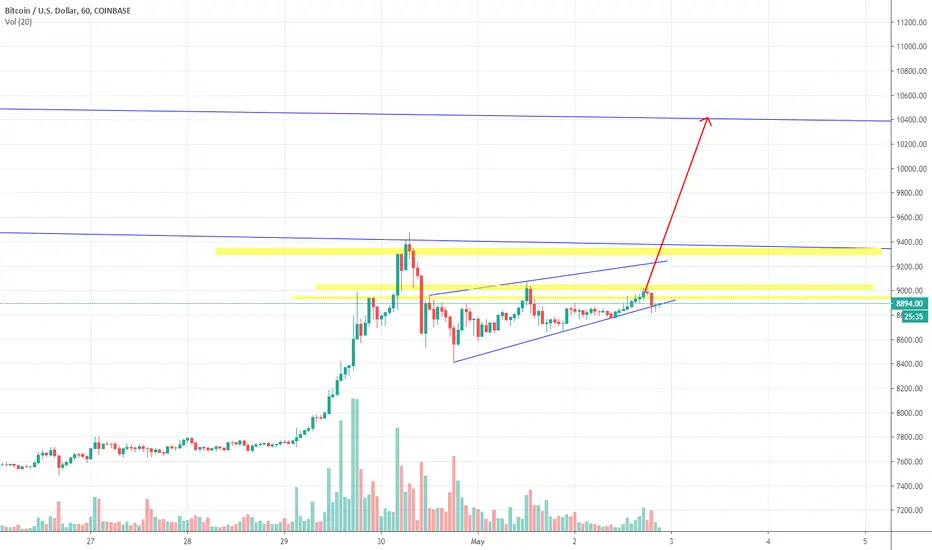
Bitcoin - Getting Ready To Blast HigherHi traders.
BTC has approached a support trend line.
Believe it is time for a slight push upwards.
Week upwards target shown by red arrow.
Bitcoin halving coming up soon so price should hopefully rise.
Like & drop a follow if you agree!
Note: DO NOT FOLLOW THIS TRADE BLINDLY!
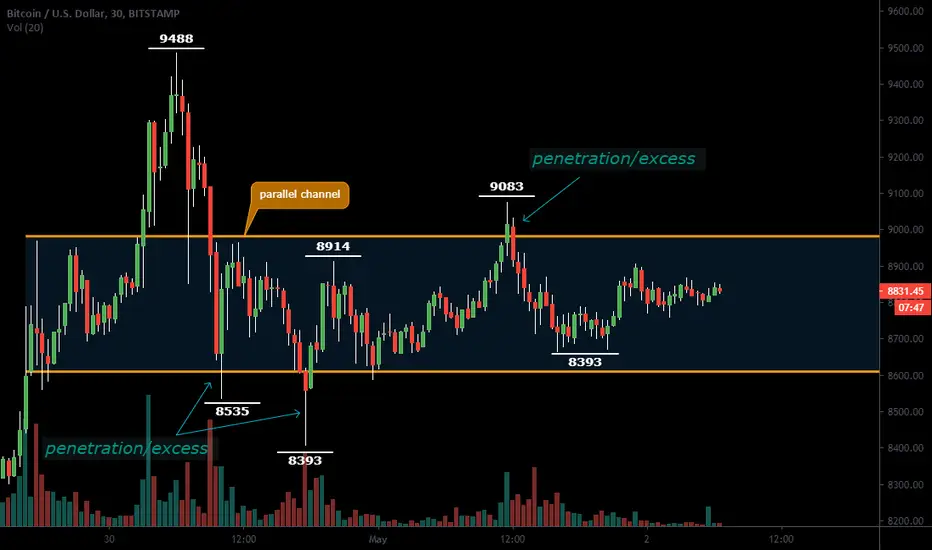
The possibility of something is cooking in Bitcoin kitchen...!All the major resistance and support plotted on the chart.
The price breaking out any of these R 9083 and R 8398 will give us new direction of trend .
The excess/penetration has been seen out side of parallel channel/value area. The price can be dump and damp between Upper Bound: Parallel Channel and Lower Bound: Parallel Channel.
Traders can trade both either buy at pepper bound or sell at lower bound until breakout the channel with confirmation.
Let take a closest look with different angles:
Very Low Volume
Narrow range in price with series of almost no body of candle.
price rotation
remarkable point: price falling with vol. volume before the price rotation.
---> You will get big move shortly with volume surged .
Breakout will give you a truck of money...! Yes,...It is taking more to develop value area. Money can be poured into your home by filling the sack but the right timing ad correct interpretation will give you by patience. Just wait for a breakout and focus on volume .
"Just as it takes time to make/develop something happens, it also takes to break it. This statement also applied to bitcoin."
The price will also hold or take time to fall therefore forecast of a future move in a forecast of a future conspiracy.
We are on the radar of the U-turn cause of channel.

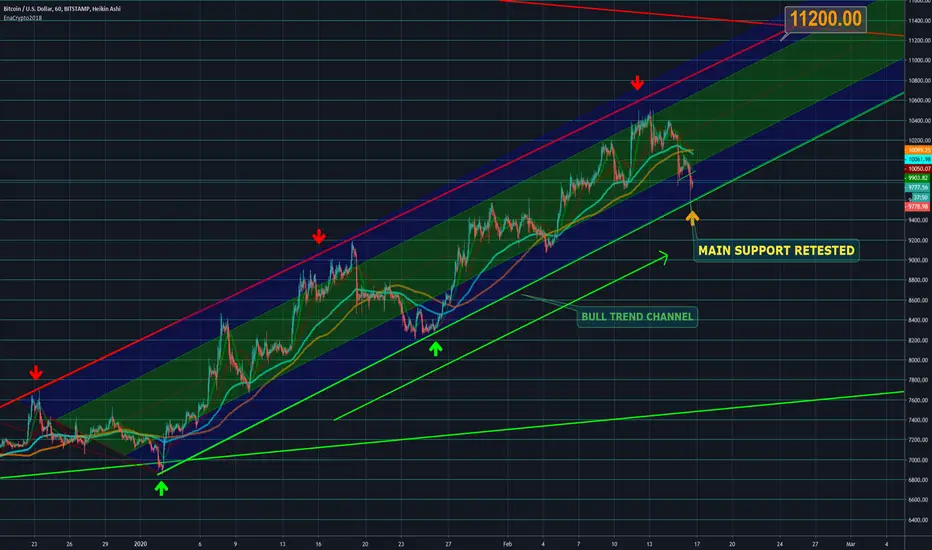
BITCOIN 1H VIEWA view of 1H Chart
Bitcoin is now retesting the main support line (on green)
Is Perfectly following his UPTrend channel
for now its just retracing (The ALT Marke
ts could be affected)
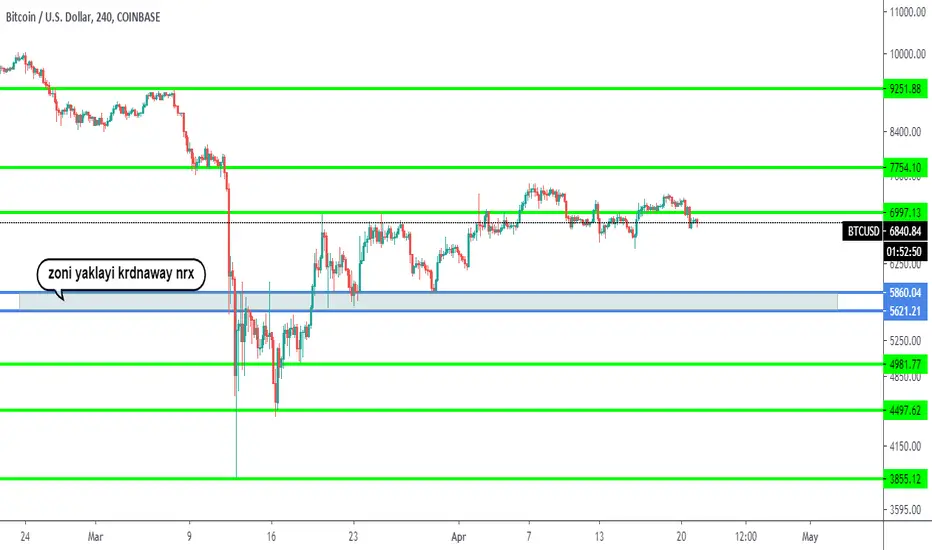
Bitcoin Price Prediction:BTC/USD is a step away from $6000 retun 1. Bitcoin price in the second half of trading on Wednesday is trading in the green, holding gains of 0.22%, as the bulls resume buying pressure.
2. BTC/USD is making strong progress towards a return of the $6000 territory.
BTC/USD bulls are moving gradually through the sticky supply area of $5500-600 range. They need just one final push and the price could very quickly return back up to the $6000 territory.
**BTC/USD short time sell target 5170 and 5080 Area and Other side of long Buy 5060 level . 5060 level H4 200 ma Moving Average so good position for buy , target 5500/5650 and finally 5830 Area.
The largest digital asset was trending sideways between $5,100 and $5,200 prior to Tuesday breakout. Technical levels remain intact in spite of Bitcoin failing to move past $5,350.
3. BTC/USD bulls try to hold the ground above critical support.
4. The critical resistance lies with $5,500.
High: 5219.93
Low: 5129.19
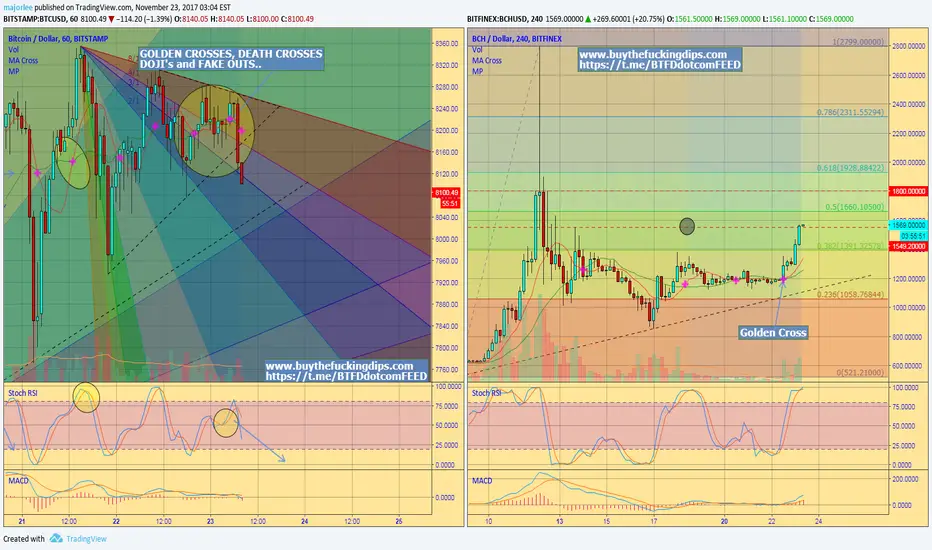
BTC & BCH dual update 27th Nov 2017 [BTFD]BTC still climbing may have hit a top at 9700 area but will restest for sure, its still within the white Gann Fan area so sticking by the fan this height for bitcoin can go much higher especially if it is parabolic like some experts are predicting Bitcoin to goto $180k, so i would start a small HODL of bitcoin just incase. (also make sure your exchange accounts are verified just incase u need to take out large sums of money)
BCH has a golden cross and failed its rise to over 3k yesterday due to huge volume going into bitcoin, still sticking within patterns and support, just waiting on BTC
There was bit of a dump back to 1600 area but massive support holding it, its worth getting some as low as possible

Bitcoin & Bitcoin Cash Side by Side, Flipping the King & Queen watch how we sell load of BCH and buy loads of bitcoin
rinse and repeat until lambo :P
updates here:
t.me
Bitcoin likely to make short term lows in coming weeksBTC/USD has been tumbling in past months and there seems to be no shortage of bears in the markets currently. While the fundamentals of the protocol and currency remain innovative and potentially disruptive to global finance, the short term is likely to see a continuance of downside pressure.
Most recently prices fell through the long term lower bound trend line at $460USD and unless markets can rally through early week trading to regain a positive stance above the aforementioned trend, lower target seem likely. While major target prices exist between the lower medium term trend line and the lower long term trend line this projection focuses on a worst case scenario of a fall to the lower bound between $215 - $305. Bulls will likely see a formidable re-entry to the markets at this juncture and could potentially reignite a new long term uptrend.

Bitcoin swing playRecently took profits off a short from 515 area and am anticipating a h&s (gag) break could run to 560. 580-590.. and I'm sure you can read a simple chart. Failure to break past neckline would be very bearish.

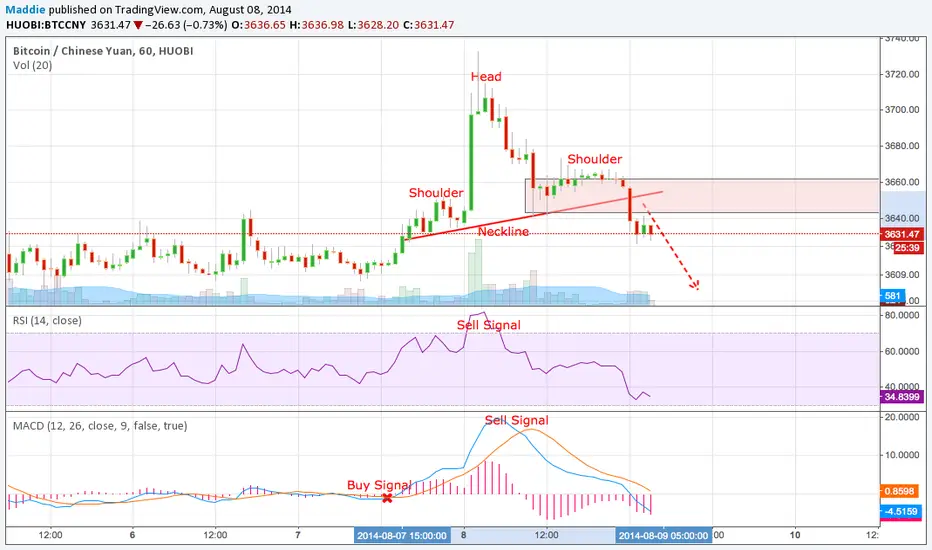
Head and Shouders Pattern Formed On Huobi Again!Better sooner than later!
BTC showed us again a head and shouder formation!
This will take us back to at least 3615 because there we have strong reactance from the last weeks.
It's time to go short to for a few hours and wacht carefully if we break 3615.
If that happen the target at least 3600 or maybe even lower.
Our target is calculated just like the cup and handle pattern.
Measure the distance between the head and the neckline, and that is approximately the distance that the price will move after it breaks the neckline.
3720-3630=85
3650-80=3570 (580USD)
I hope this helped!
If you like my chart or my description, don't forget to like :)
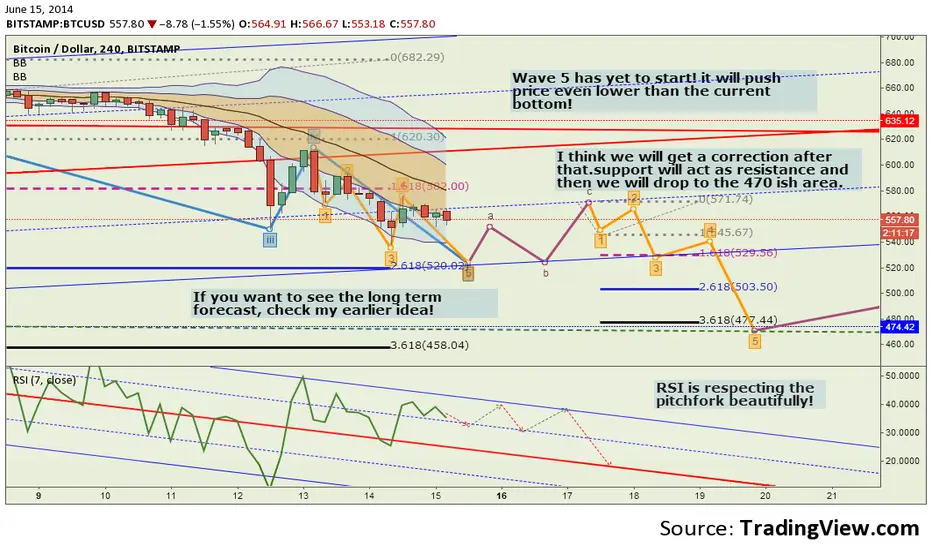
BTC BITSTAMP SHORT TERM FORECAST!Idea is based on a combination of EW and median line analysis. The target and stop loss are shown on my earlier idea, along with the rationale behind this forecast. Good luck
Why BTC Sold Off Last NightLike I said in January, I expect all bull markets
to be met with some strong selling pressure at resistance
levels due to "bag holders" who are looking to get out
at higher prices. This is exactly why I closed most
of my swing trade long position in between ~$585 & ~$660.
There was a nice short opportunity last night on the break
of the bull flag, but I didn't catch it because I was on a train
in Italy.
So far, the bull trend still looks "healthy", so we could see
higher prices, but I'm expecting more consolidation and
maybe a deeper pullback before going higher.
Fundamentally, there's sold silk road news that could add
extra selling pressure to the markets.

Now downward channel appearsShame for ma long on 565$, we are going down, if not bounce on 545$, I expect to see 512$ soon. It wopuld be first decisive moment, after destroying this, I would not be suprised of 100% correction even.

First Sign Of Demand Since My Last Buy ZonePer my last prediction:
I've been cautiously bullish around $440 - $475,
watching to see when demand would step back
into Bitcoin.
It's easy for newbie traders to look back
in hindsight at this trend line break and
have a "woulda coulda shoulda" response,
but the only thing that matters is if you can
buy when nobody else wants to, then take
profits when everybody else is chasing.
I'm still cautiously bullish and only buying on
retracements, because I know (from message
boards, tweets, etc) that rookie traders are chasing
price and are likely to get stopped out on any pullback.
Trade smart!

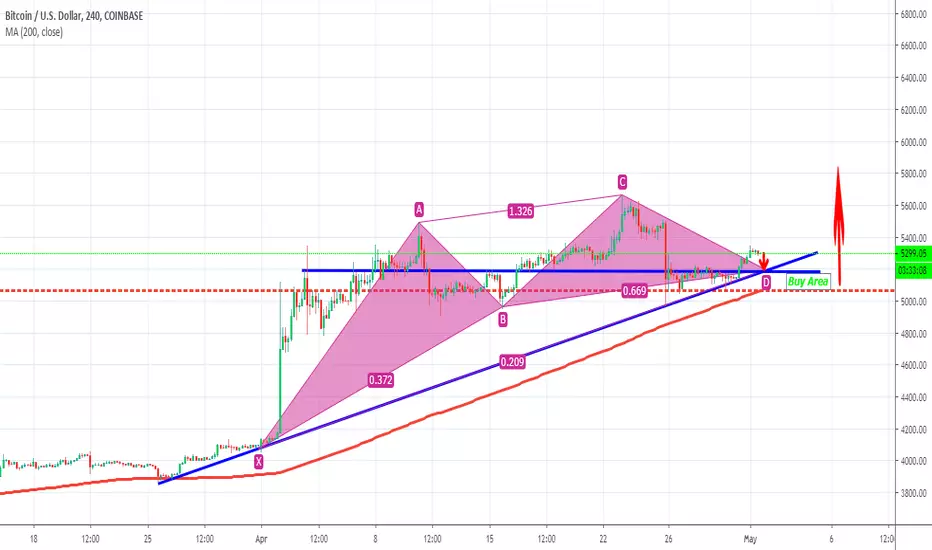
BITCOIN XABCD PATTERN+ 3 DRIVES PATTERN (FIBONACCI) UPDATEI am currently trying to study the Fibonacci sequence and some patterns.
0.618 and 1.618 are one on the most important ratio's in the Fibonacci sequence.
This is a update of my previous idea. I added a Three drives pattern.
Please leave a comment!

INVERSE HEAD AND SHOULDER -> BULLISH OR BEARISH? V2This is the first time I drawed a head and shoulder.
I hope I did a good job.
There is some thick support on the 449-480.
If it breaks, we can see some panic.
The neckline is arround the 440.
it it goes even more down under the Pull back line, I don't think Bitcoin can recover really quickly again.
