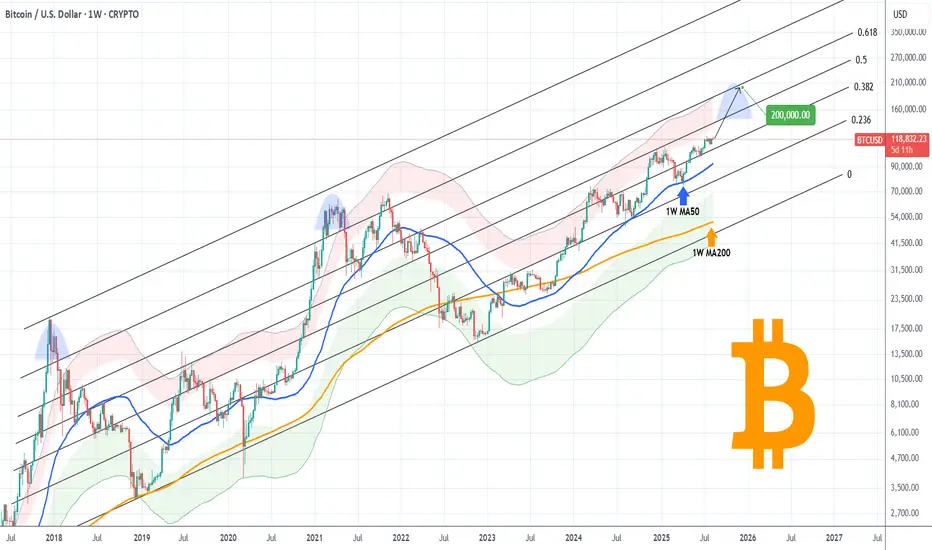
BITCOIN Can it break above this 3-year Resistance and hit $200k?Bitcoin (BTCUSD) is extending its main 1W MA50 (blue trend-line) fueled rebound, which only recently confirmed the continuation with a short-term bounce on the 1D MA50. The short-term setting is transferred now back to the long-term and the next Resistance, which is the middle (0.5 Fibonacci level) of the macro Channel Up, that has been dominating BTC's price action since late 2017.
The 0.5 Fib has made its last rejection/ failed attempt to break on December 16 2024. It's been holding as a Resistance since May 02 2022. The last two Cycle Tops however haven't only been priced above the 0.5 Fib but above the 0.786 level too (obviously as close to the Channel Top as possible).
As a result, if BTC does break above the 0.5 level, a 'mere' test of the immediate upper Fib (the 0.618) could be translated by the end of the year (timing of Cycle Top) to a $200k test. That would also be a test of the Top of the 1st SD above (red Zone) of the Mayer Multiple Bands (MMBs), which is technically still within high tolerance levels.
So do you think we can get near $200k by the end of the year if the 0.5 Fib breaks? Feel free to let us know in the comments section below!
-------------------------------------------------------------------------------
** Please LIKE 👍, FOLLOW ✅, SHARE 🙌 and COMMENT ✍ if you enjoy this idea! Also share your ideas and charts in the comments section below! This is best way to keep it relevant, support us, keep the content here free and allow the idea to reach as many people as possible. **
-------------------------------------------------------------------------------
💸💸💸💸💸💸
👇 👇 👇 👇 👇 👇
Bitcoin-btcusd
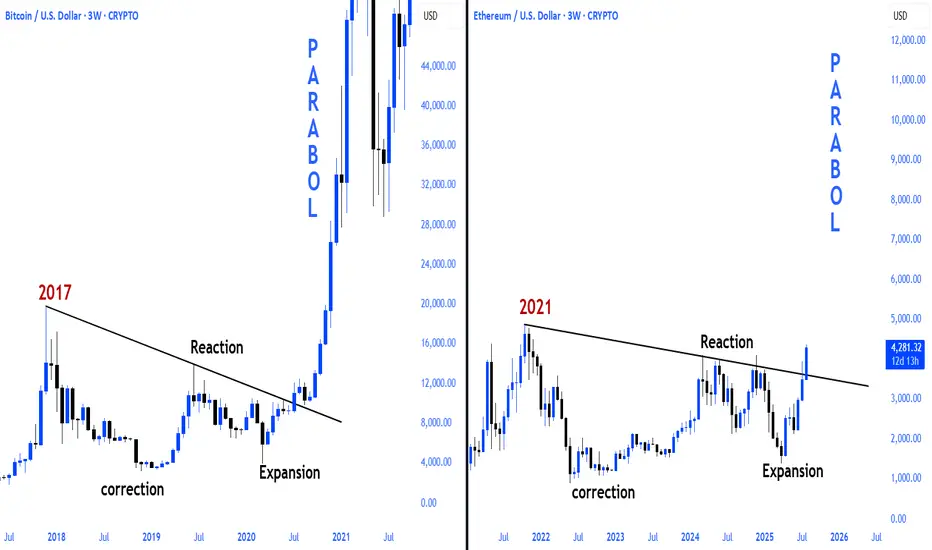
Don't sleep on Ethereum!Ethereum is following the pattern seen before the 2021 bull run of Bitcoin, and we are now in the final stages before the parabolic run for Ethereum.
CRYPTOCAP:BTC 2017\2021 vs. CRYPTOCAP:ETH 2021\2025
BITCOIN BULLS ARE GONNA DO THIS NOW!!!! (Fakeout Wick) Yello Paradisers! In this video, I've been updating Bitcoin price action and the Elliot Wave theory. I've been doing lots of advanced technical stuff. We've been going through channeling and updating ourselves about the most important support and resistance levels. We've been taking a look at the MACD histogram, the RSI, and the stochastic RSI. We've been professionally analyzing the volume; we've understood who is in power right now and what's going to happen next with the highest probability.
We've also been taking a look at what kind of confirmations we are waiting for in order for us to be able to open long or short positions.
Paradisers, make sure that you are trading with a professional trading strategy. Wait for confirmations, play tactically, and focus on long-term profitability, not on getting rich quick.
Remember, don’t trade without confirmations. Wait for them before creating a trade. Be disciplined, patient, and emotionally controlled. Only trade the highest probability setups with the greatest risk to reward ratio. This will ensure that you become a long-term profitable professional trader.
Don't be a gambler. Don't try to get rich quick. Make sure that your trading is professionally based on proper strategies and trade tactics.

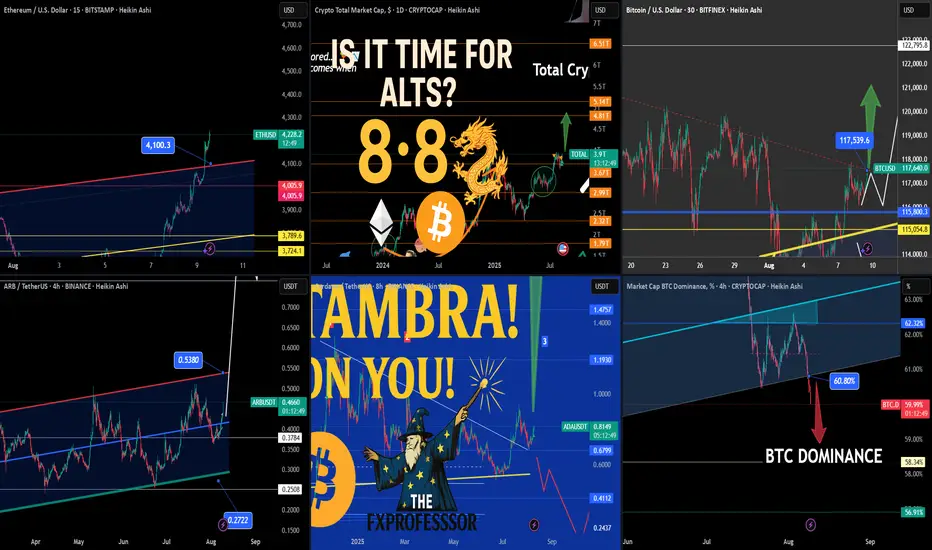
Today’s Crypto Market – From Ethereum Strength to ALTS Setup📅🔥 Today’s Crypto Market – From Ethereum Strength to ALTS Setup 🚀💡
In today’s market update video, we broke down what could be the critical handoff from Ethereum’s dominance to a broader ALT season.
The sequence is clear:
1️⃣ Bitcoin led the way.
2️⃣ Ethereum took control, smashing through $4,100.
3️⃣ Altcoins now have the setup to run, with BTC dominance breaking lower.
🎯 Key Levels from Today’s Charts:
Ethereum (ETH/USD) – $4,222 with breakout above $4,100.3; upside targets $4,420 – $4,800; supports at $4,005.9 and $3,789.6.
Bitcoin (BTC/USD) – Breaking out from wedge at $117,500; supports $115,803 & $115,054; upside potential to $120K+ and $122,795.8.
ARB/USDT – Rebound from $0.3784 aiming for $0.5380; key support $0.3500 and $0.2722.
Cardano (ADA/USDT) – At $0.8131; resistance $1.1930, then $1.4757; support $0.6799, $0.4112.
BTC Dominance – Breakdown under 60.80%, supports 58.34% & 56.91% — historically a strong trigger for ALT rallies.
📽️ Full breakdown and reasoning are in today’s video — we looked at why BTC dominance losing support is the green light for possible sector rotation, and which alts are primed.
One Love,
The FXPROFESSOR 💙
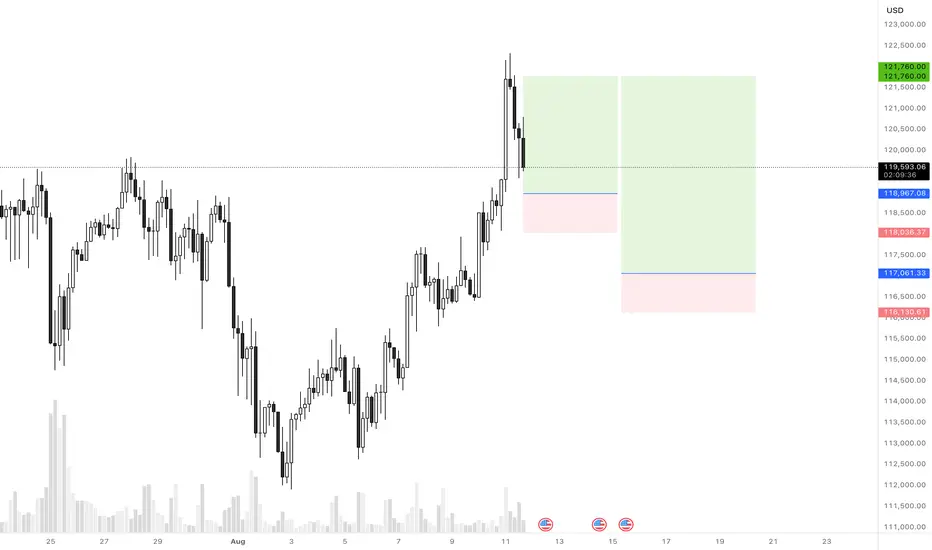
BTCUSD Long SetupHi everyone.
These two areas are good to set orders. But please consider the risk management for each..
I'll update TPs later..
Tradingview.com Platform Description:
Dear traders, please support my ideas with your likes and comments to motivate me to publish more signals and analysis for you.
Best Regards
Navid Nazarian
$BTC Breaking Down. Price bleeds, conviction doesn’t.Price bleeds, conviction doesn’t.
This was originally posted previously <24hrs but was hidden due to a link. Here is the pic of the original so you can see S1 bounced perfectly, lets see how much momentum we can get.
OG Thread continued..
Is this the dip worth buying?
BTC is retesting key quant support zones after a high-volume rejection near $116K. Despite the short-term dip, structure remains bullish from a mid-term lens.
• Quant Support Levels
• S1: $112,412
• S2: $110,935
• S3: $108,711
• Resistance Levels:
• R1: $116,113
• R2: $118,337
• R3: $119,814
On chain metrics:
• On-chain data confirms short-term holder capitulation into high-ownership clusters at $112K–$110K.
• Volatility contraction suggests a base-building phase, not a breakdown.
• Cup-and-handle formation remains valid on higher timeframes.
• Institutional Context:
• Accumulation increasing below $115K.
• Analysts projecting breakout potential to $129K–$133K if BTC can reclaim the $116.1K pivot.
Quant traders are eyeing this pullback as a healthy setup — not a breakdown.
I believe these are perfect accumulation levels anywhere in the blue square should be fine for a play to the upside.
Want Quant levels? Let me know!

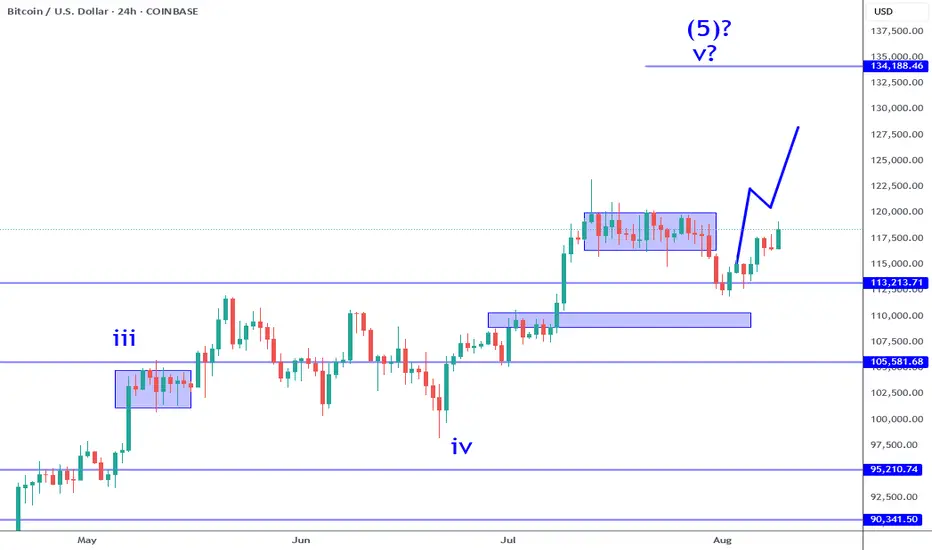
Bitcoin: 120K Break To Push 130Ks?Bitcoin has rallied off the buy signal that I wrote about over the previous week. In order to confirm follow through, price needs to CLOSE decisively above 120K this week. This means a solid candle close, NO pin bars. This needs to be followed by a new candle that breaks the previous candle high quickly, and NOT close weak. The blue rectangle on the chart represents a consolidation resistance where price is likely to test and potentially reject. The question that the market needs to answer is: can price push through this without any effort, OR does it get stuck and start to form bearish candles or reversals?
The wave count that I have been referring to in previous analysis is still intact. Subwave 4 never overlapped subwave 1 which means this move is most likely subwave 5. If you are maintaining a profit, it would be wise to trail your stop at least by two previous candle lows on this time frame. At this moment there is NO reason to sell since there is nothing but strength, BUT understand that it can change at a moments notice. It is within reason to wait and see IF price breaks out and if you are long from my price suggestion in my previous analysis, you have the luxury and flexibility to wait it out.
I regularly bring this up during my analysis streams, Wave 5's, ESPECIALLY 5th of 5th waves (which is what this is), imply that the market is highly vulnerable but this WILL not be obvious in any way. Wave 5's can be interpreted as the next wave to follow is LIKELY a corrective structure. This may take some weeks or longer to play out, but knowing that this is a Wave 5 should tell you that risk on the LONG side is ELEVATED. Increasing risk at these levels (same goes for the stock market) is unwise in my humble opinion. Price can run into the 130Ks or higher before it peaks there is NO way to know with any certainty (unless you are Michael Saylor).
Potential catalysts over the next few months can easily change things (NFP, CPI, FOMC meetings). What determines value, especially over the short term is the perception of the future and NOT reality. All it takes is a new "narrative" to proliferate.
Thank you for considering my analysis and perspective.
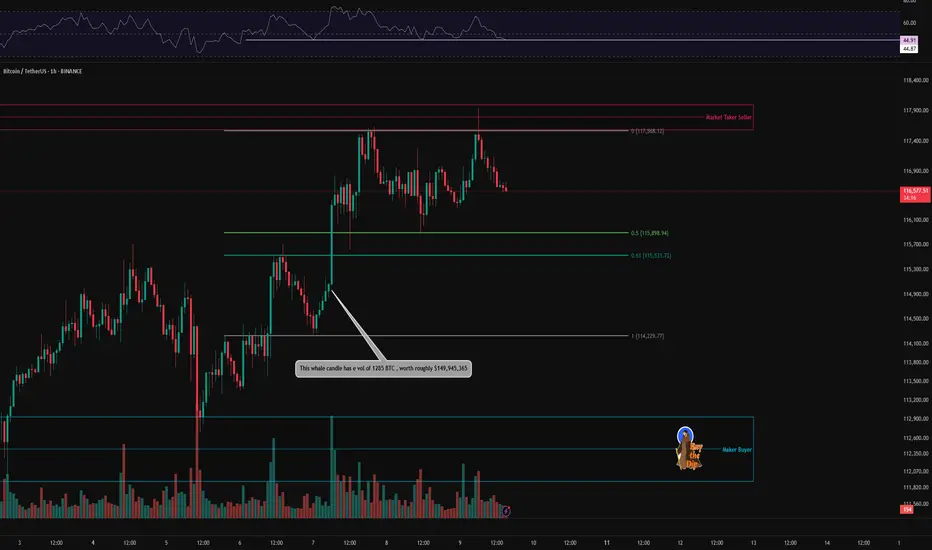
BTC 1H Analysis – Key Triggers Ahead | Day 6💀 Hey , how's it going ? Come over here — Satoshi got something for you !
⏰ We’re analyzing BTC on the 1-hour timeframe .
👀 On the 1-hour timeframe, Bitcoin rebounded from $114,200 after heavy whale buying. It broke through the $115,530 zone and moved toward its resistance at $117,600, but was rejected twice by strong seller tickers in that area. It is now moving toward its current support levels .
🎮 Key Fibonacci zones to watch are the 0.5 and 0 levels. A breakout of these areas can trigger potential long or short entries, making them valuable as breakout triggers .
⚙️ The important RSI pivot level is 44.87; losing this level could lead to a further correction .
🕯 Trading volume and transaction count are rising, suggesting the possibility of another “Bitcoin season.” Large institutions have been buying at the lows, increasing their positions each time. ETF data has turned highly positive, indicating strong recovery potential and attracting more risk capital .
🔔 There are two alert zones: one at $117,500 and another at $116,000. Setting alerts here can help you better track price behavior .
📊 USDT.D has broken above its range box , A break of the current zone could allow Bitcoin to push higher .
🖥 Summary : After its recent pump, Bitcoin is facing resistance from seller tickers and is trying to break through this zone. As long as BTC stays above $116,000, there is potential for another attempt to set a new high .
❤️ Disclaimer : This analysis is purely based on my personal opinion and I only trade if the stated triggers are activated .
BITCOIN PARABOLIC RUN TO CONTINUE!BITCOIN PARABOLIC RUN TO CONTINUE!
There is no doubt that the current parabolic run will continue, as Bitcoin has not yet reached its local peak.

BITCOIN Bounced on its 1D MA50. Bull Flag breaking soon?Bitcoin (BTCUSD) made a beautiful technical rebound on its 1D MA50 (blue trend-line), testing and holding it on 3 separate 1D candles. This has caused a short-term rebound so far, taking the price to the top of the Channel Down.
As we mentioned on previous analysis, if BTC breaks above that Channel, it will be technically confirmed as a Bull Flag, similar to the May 20 - June 20 pattern. Interestingly enough, that one was confirmed by a 1D MACD Bullish Cross, a formation that the MACD is about to make again. However it is not conclusive as 1 out of the last 3 such sequences was false.
In any case, if the break-out does take place, we are ahead of potentially two targets. Short-term $140000, which would be a +25.45% Bullish Leg, such as the one that led to the current Flag and medium-term $148000, which is the 2.0 Fibonacci extension.
Which Target do you think we'll hit, if any? Feel free to let us know in the comments section below!
-------------------------------------------------------------------------------
** Please LIKE 👍, FOLLOW ✅, SHARE 🙌 and COMMENT ✍ if you enjoy this idea! Also share your ideas and charts in the comments section below! This is best way to keep it relevant, support us, keep the content here free and allow the idea to reach as many people as possible. **
-------------------------------------------------------------------------------
💸💸💸💸💸💸
👇 👇 👇 👇 👇 👇

WE HAVE PREDICTED EVERY MOVE OF BITCOIN - HERE IS WHAT’S NEXT!! Yello Paradisers! we have predicted every single movement on Bitcoin in the past few months, and in this video, I will reveal to you what's going to happen next with the highest probability. Again, on the high time frame chart, we are seeing the ABC zigzag, and right now, we are trading inside of the C wave. Further in the video, we are zooming into the fourth wave.
On the medium time frame, we are seeing bearish divergence that is showcasing an absorption. We are describing Heron-Chorda's target and taking a look at the channel in which the zigzag is being formed. On the low time frame, we are analyzing the Elliott Wave Theory Triple Three pattern, and on the ultra-low time frame, we are analyzing the impulse.
We are describing what kind of conformations we are waiting for. Basically, it's a five ways to the downside. Then, we will be increasing our portfolio exposure on a corrective mode wave to the upside where we will be able to create a tight risk-to-reward ratio position and a high-probability trade setup. Trade smart, trade with a professional trading strategy, be tactical, and enjoy your weekend.
Remember, don’t trade without confirmations. Wait for them before creating a trade. Be disciplined, patient, and emotionally controlled. Only trade the highest probability setups with the greatest risk to reward ratio. This will ensure that you become a long-term profitable professional trader.
Don't be a gambler. Don't try to get rich quick. Make sure that your trading is professionally based on proper strategies and trade tactics.

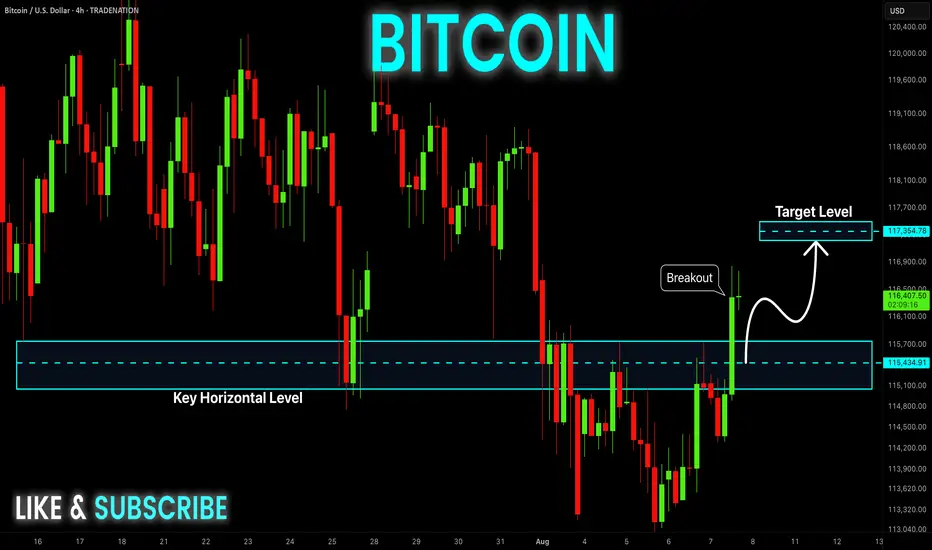
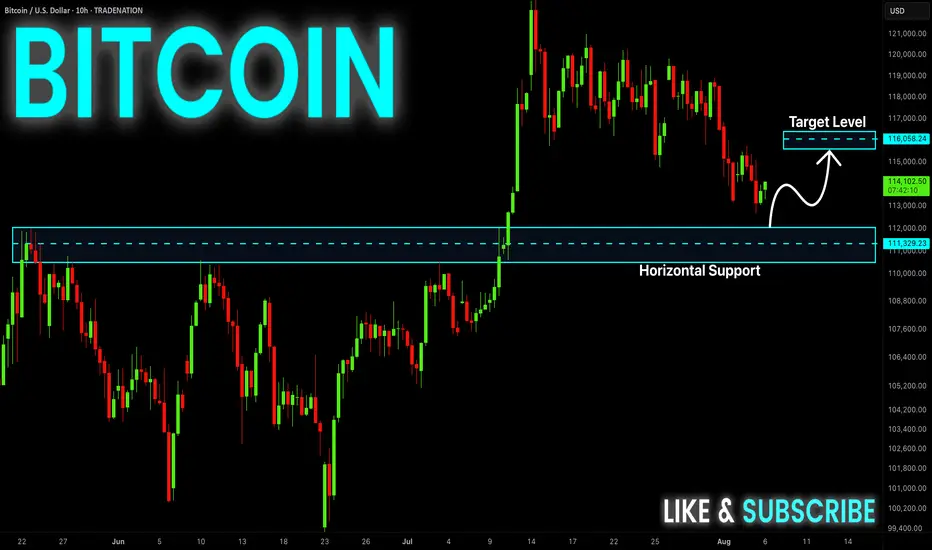
BITCOIN Bullish Breakout! Buy!
Hello,Traders!
BITCOIN made a bullish
Breakout of the key horizontal
Level of 115,5k$ and the
Breakout is confirmed so
We are bullish biased and
We will be expecting a
Further bullish move up
Buy!
Comment and subscribe to help us grow!
Check out other forecasts below too!
Disclosure: I am part of Trade Nation's Influencer program and receive a monthly fee for using their TradingView charts in my analysis.
Bitcoin bullish momentum ending very soon...Past Cycle Behavior:
Bitcoin showed strong bullish momentum in the past.
Many positive news updates came for Bitcoin and blockchain.
Despite this, Bitcoin completed its cycle and dumped for 13 months.
Current Market Situation (2025):
Bitcoin is now completing a 33-month bullish cycle in October 2025 (similar to past trends).
RSI divergence is forming, which often signals a trend reversal.
Again, positive news is coming for Bitcoin, just like before.
Time Cycle Theory in Trading:
Time cycles often work in financial markets, repeating past patterns.
However, this does not guarantee future price movements.
Risk Management (Important for Beginners):
Always set a Stop Loss (SL) to protect your capital.
Never risk more than 2% of your total trading balance on a single trade.
Even if the analysis is strong, market conditions can change anytime.

BITCOIN PREDICTION: a SECRET PATTERN is FORMING (watch out)!!!Yello paradisers! In this Bitcoin prediction, I'm updating you about the crash we predicted earlier in previous videos. I'm showing you on a high timeframe chart the ABC corrective mode wave; we are now forming the C wave. The C wave subdivides itself into five smaller waves because it's a motive mode wave. We are taking a look at the volume. We understand that bears are still in power, so we are waiting for some nice volume from bulls. We are spectating a bullish divergence on the MACD indicator. On RSI, there is exaggerated bullish divergence, and in stochastic RSI, we are in an oversold area.
Then, we are shifting our focus to a medium timeframe. We are zooming into the fourth wave, where we are making our sub-waves right now. On the medium timeframe, we are also spectating bearish divergence. We are waiting for the second booby that will basically increase the probabilities of absorption.
As we have seen previously, that helped us to predict that Bitcoin will be crashing. We are also taking a look at our head and shoulders target, which is at $109,000.
Then we are shifting our focus to a lower timeframe, where we are seeing the secret pattern, triple three. Right now, we are creating a sub-wave XX, which is forming itself as a possible zigzag. Paradisers, make sure that you are trading professionally, focus on long-term growth, and avoid get-rich-quick schemes. Any shortage in trading usually ends up sooner or later in bankruptcy.
Remember, don’t trade without confirmations. Wait for them before creating a trade. Be disciplined, patient, and emotionally controlled. Only trade the highest probability setups with the greatest risk to reward ratio. This will ensure that you become a long-term profitable professional trader.
Don't be a gambler. Don't try to get rich quick. Make sure that your trading is professionally based on proper strategies and trade tactics.

BITCOIN VS. GOLDAlthough there is a time difference between bitcoin, known as digital gold, and spot gold, it continues to follow suit, which we can clearly see on the chart.

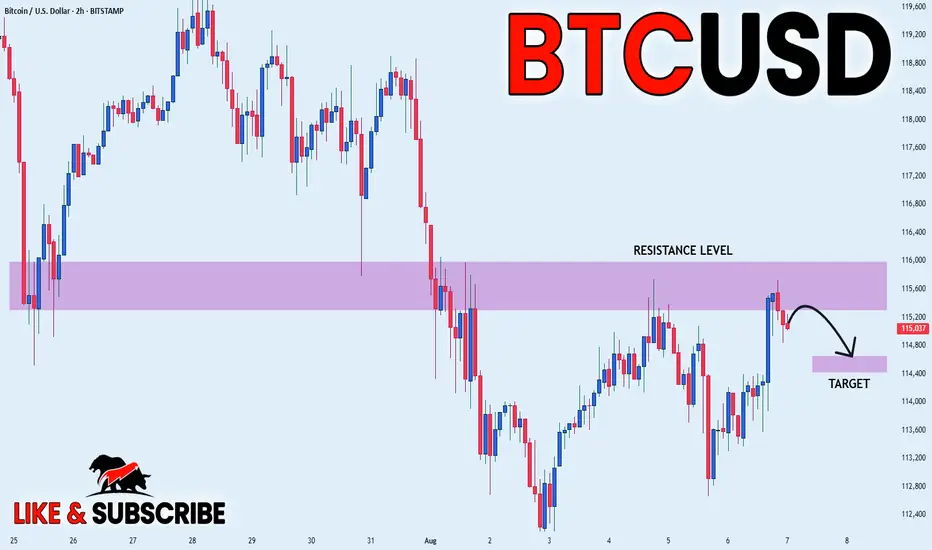
BITCOIN PULLBACK FROM SUPPLY AREA|SHORT|
✅BITCOIN price grew again
To retest the resistance of 116k
But it is a strong key level
So we are seeing a bearish reaction
And we will likely see a
Further bearish move down
SHORT🔥
✅Like and subscribe to never miss a new idea!✅
BITCOIN Swing Long! Buy!
Hello,Traders!
BITCOIN went down from
The highs but a strong support
Level is below around 112k$
So after the retest we will be
Expecting a local bullish rebound
Buy!
Comment and subscribe to help us grow!
Check out other forecasts below too!
Disclosure: I am part of Trade Nation's Influencer program and receive a monthly fee for using their TradingView charts in my analysis.
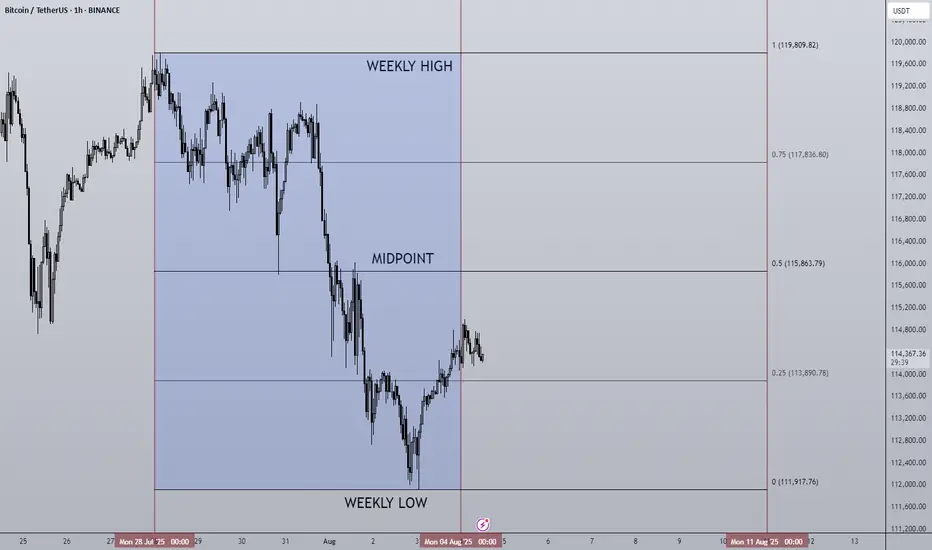
04/08/25 Weekly OutlookLast weeks high: $119,809.82
Last weeks low: $111,917.76
Midpoint: $115,863.79
First net outflow for BTC in seven weeks (-$643m) following the FOMC data release and also month end. Yet again no change by the FED but the chances of Septembers FOMC giving us a rate cut has drastically increased, currently at a 78.5% chance of a 25Bps cut.
Month end usually gives us a pullback/sell-off as larger institutions window dress which often includes de-risking somewhat. We saw this last Thursday combined with the weekends typical lower volume has resulted in quite a significant correction for BTC. Altcoins have down the same as many assets reject from HTF resistance areas, the correction has been on the cards and isn't too worrying on the face of it.
What I would say is August seasonality is generally not a bullish month and so expecting price to rebound and extend the rally would go against historical trends. I could see more of a ranging environment taking place for several weeks before any next leg up is possible.
This week I would like to see where altcoins find support and establish a trading range where some rotational setups tend to present themselves.
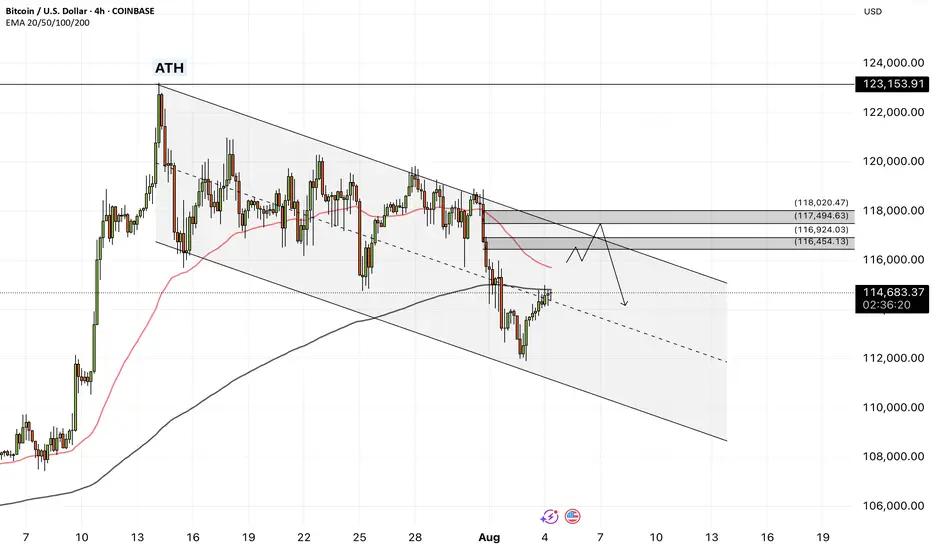
Bitcoin - Will Bitcoin reach its previous ATH?!Bitcoin is below the EMA50 and EMA200 on the four-hour timeframe and is in its short-term descending channel. In case of an upward correction, Bitcoin can be sold from the specified supply zone, which is also at the intersection of the ceiling of the descending channel.
It should be noted that there is a possibility of heavy fluctuations and shadows due to the movement of whales in the market and compliance with capital management in the cryptocurrency market will be more important. If the downward trend continues, we can buy in the demand range.
In recent days, Bitcoin has stabilized below the $120,000 mark, a development that reflects increasing structural maturity in the market and strong institutional capital inflows. Unlike in previous cycles, where price rallies were largely driven by retail hype, the current liquidity flows are channeled through regulated and professional instruments like ETFs. During the month of July alone, Bitcoin ETFs attracted over $6 billion in inflows, marking the third-highest monthly inflow in their history. Leading this trend were BlackRock’s IBIT and Fidelity’s FBTC, which together recorded more than $1.2 billion in net inflows within a single week. This signals a shift in trust from traditional investors toward crypto markets—within transparent, traceable, and regulated frameworks.
On-chain metrics further validate this shift. The MVRV ratio, which compares market value to realized value, is currently fluctuating between 2.2 and 2.34. These levels do not indicate profit-taking extremes nor fear of major corrections, but instead point to a healthy and rationally profitable market. Meanwhile, the supply of Bitcoin held in non-exchange wallets is rising, while exchange-held balances have dropped to their lowest levels in a decade, now accounting for just 1.25% of total supply. This trend implies reduced short-term selling pressure, as coins transition from liquid to long-term holdings.
Trader behavior is also evolving. Unlike previous bull runs, profit-taking remains controlled. The SOPR index, which measures realized profit relative to purchase price, has not yet reached saturation levels. This suggests that current holders are not satisfied with existing gains and are anticipating higher price levels. Furthermore, metrics like daily active addresses remain stable, indicating a lack of speculative retail influx. The network’s current dynamics resemble those of mature traditional markets, where investment decisions are guided by analysis, discipline, and long-term perspective.
Analysts at major financial institutions believe that if this trend continues, Bitcoin could reach targets of $180,000 to $200,000 by year-end. A more conservative scenario places the $95,000 to $100,000 range as a strong support zone—especially if political, regulatory, or macroeconomic pressures intensify. Overall, the convergence of institutional capital, rational trader behavior, stable on-chain conditions, and regulatory clarity has transformed Bitcoin into a more structured and dependable asset than ever before.
Ultimately, Bitcoin is no longer just a speculative tool. It has secured its role as a legitimate asset within the portfolios of global financial institutions. Even if the pace of capital inflow is slower than in previous cycles, the underlying structure is more robust and sustainable—offering a clearer path toward broader global adoption and higher valuation.
Nonetheless, recent data from CryptoQuant suggests that long-term Bitcoin holders (LTHs) have begun net selling near the $120,000 resistance zone—a psychologically significant level in Bitcoin’s price history. Analysts interpret this as a potential sign that veteran investors—those who entered during earlier market cycles—are now realizing profits as prices reach historic highs. If short-term holders follow suit, this shift could amplify selling pressure and trigger heightened price volatility.
It seems like no one likes non-panic morning posts...Futures are like a rented Ferrari, spot is like a purchased Mercedes.
There are hidden reserves under the melting volumes. What do you think about the current denouement?

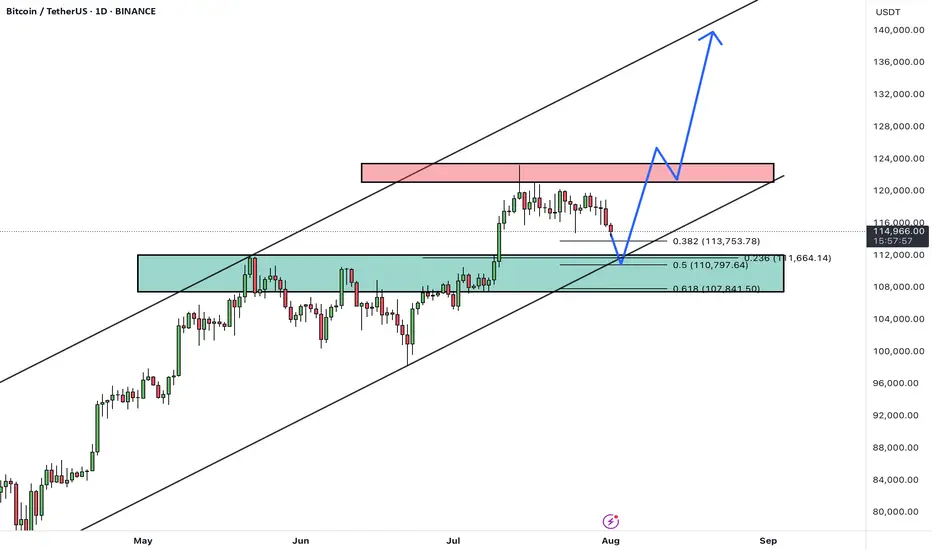
BTCUSDTHello Traders! 👋
What are your thoughts on BITCOIN?
After a strong rally, BTC is currently pulling back from the 124K resistance area, heading toward a major confluence support zone between 108,000– 110,000, which aligns with:
✅ Previous breakout zone
✅ 0.5–0.618 Fibonacci retracement
✅ Lower bound of the ascending channel
This level is expected to attract buyers and act as a base for a new bullish leg.
Scenario Ahead (Main Bias):
1. Price dips into the 108–110K support
2. Bullish reversal from the zone (watch for strong reaction candles or bullish divergence)
3. Target 1: 124K (retest resistance)
4. Target 2: 135K–140K (upper channel boundary upon breakout)
BTC remains in a healthy bullish structure. Current pullback is considered constructive, and the 107–110K zone offers a high-probability long setup. Watch for bullish signals before entering.
A confirmed daily close below 107K would invalidate this bullish structure and expose BTC to deeper correction levels.
What’s your take on this setup? Do you expect a bounce from support or a deeper correction? Share your thoughts below 👇
Don’t forget to like and share your thoughts in the comments! ❤️
Bitcoin: 113K Support Bounce Buy Signal.Bitcoin has retraced thanks mostly to "unexpected" revisions to labor market statistics. While this move has many making outrageous forecasts, price has simply retraced to the 113K support levels and has generated a swing trade long signal (break of 114K). IF the momentum stays intact, it is within reason to anticipate a test of the low 120K's while a more aggressive expectations would be a break out into the 130K's. Keep in mind if 123K is broken, even by a small amount, that would confirm the current movement as the wave 5 of 5 which means it becomes the most vulnerable to a broader correction.
This NFP report and BLS situation is the perfect example of a catalyst that NO ONE in the financial "expert" space saw coming. Even Chairman Powell on Wednesday was pointing out how stable employment growth has been and emphasized the importance of this statistic for their rate decisions. Which means the Federal Reserve is making decisions based on totally inaccurate data. Which also means the entire market has been priced completely wrong for months. My point is, "official" information that you may be basing your investments on can be totally inaccurate and can be revealed out of nowhere. This risk alone puts every investor at the mercy of the market and why it is so important to recognize the limitations of ANY market information through the lens of RISK management.
I have been writing about a potential bullish range breakout beyond 120K for a test of the 130s OR if the range support breaks instead, to watch for a test of the key support at 113K. There is NO way to know which way the market will choose in advance, it all depends on the outcomes of specific events which act as catalysts for one scenario or the other.
This is why being knowledgeable about wave counts and other forecasting techniques can be very helpful in terms of gauging risk and potential. And based on this, AS LONG AS the 108K area is NOT overlapped, the current price structure is still within the boundaries of a bullish sub wave 4. This is why I am still short term bullish on Bitcoin and why I believe the current buy signal has potential to test at least the low 120's in the coming weeks. IF the 108K area is broken instead, that reduce the chances of a short term bullish break out, and may be the proof that the broader Wave 5 structure is complete.
The risk at this point can be measure from the 112K low area and nearest profit objective 118K which offers an attractive reward/risk. Measure everything from RISK first, and always be prepared to be wrong. If the market pays, consider it a gift.
Thank you for considering my analysis and perspective.

BITCOIN LONG FROM SUPPORT|
✅BITCOIN has retested a key support level of 112k
And as the coin is already making a bullish rebound
A move up to retest the supply level above at 115k is likely
LONG🚀
✅Like and subscribe to never miss a new idea!✅
Disclosure: I am part of Trade Nation's Influencer program and receive a monthly fee for using their TradingView charts in my analysis.
