BITCOIN HEADING TO 77600 LEVELIt seems that there's an atmosphere of panic. When traders see significant price drops, it can lead to a cascade of selling, with more people fearing losses. This fear can create a liquidity trap where those entering long positions are quickly taken out as prices continue to decline.
In such scenarios, liquidations occur when leveraged positions are forcibly closed by exchanges to prevent further losses, which adds even more selling pressure. The cycle can become self-reinforcing; as prices dip, more traders panic and sell, leading to further declines.
Based on this scenario, I am confident in entering a short position with a favorable risk-to-reward ratio toward the 77600 level.
Follow me for more analysis
Bitcoin-btcusd
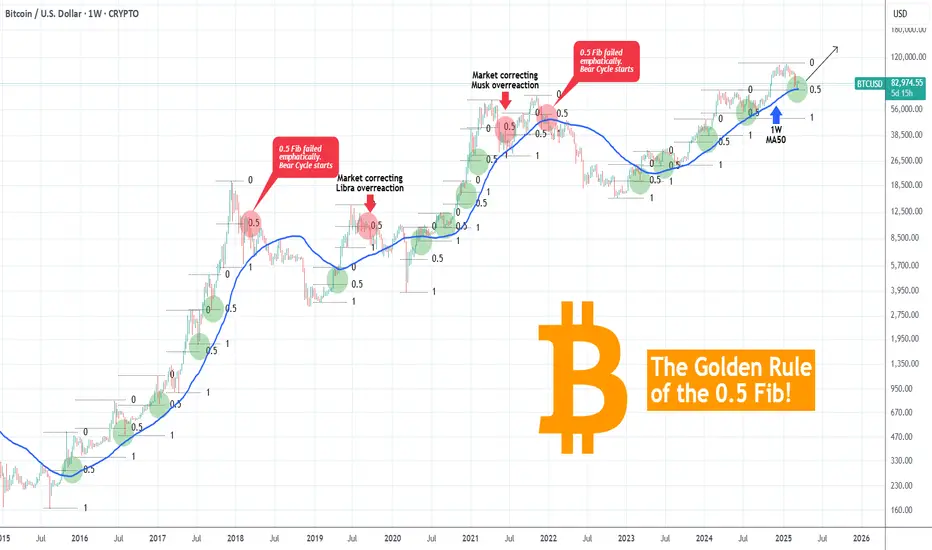
BITCOIN The 0.5 Fib Golden Rule! This is not a Bear Market yet!Bitcoin (BTCUSD) shook the bullish market sentiment last month, as late February saw it drop aggressively not just from the 109k All Time High (ATH) but also below the key psychological Support of $90000. We have discussed already how the 1W MA50 (blue trend-line) coming to its rescue, is the critical Support and rightfully so, but there is also another critical condition that is currently showing incredible strength, keeping BTC into Bull Cycle territory (for now).
That is the 0.5 Fibonacci retracement level Golden Rule. This suggests that BTC's corrections/ pull-backs up to the 0.5 Fib level are technical and perfectly systemic, especially with the 1W MA50 supporting. If anything, such pull-backs during a Bull Cycle are the most optimal buy opportunities. We are currently on an exact such opportunity as the price hit last week both the 1W MA50 and the 0.5 Fib.
In the past 10 years since the August 2015 Bear Cycle bottom, every correction up to the 0.5 Fib was a buy. In the 4 cases it broke, 2 were the signals of the 2018 and 2022 Bear Cycles and the other 2 signals of the market correcting the bullish overreaction to the Libra (2019) and Musk (2021) rallies. The latter though was still contained above the 1W MA50 and so would the 2019 one if it wasn't for the March 2020 COVID crash.
As a result, we still see no cause for concern (yet) and so far this is the best buy opportunity for Bitcoin since last year and the August 05 2024 Low.
But what do you think? Is this 0.5 Fib Golden Rule coming to push Bitcoin higher to its next ATH? Feel free to let us know in the comments section below!
-------------------------------------------------------------------------------
** Please LIKE 👍, FOLLOW ✅, SHARE 🙌 and COMMENT ✍ if you enjoy this idea! Also share your ideas and charts in the comments section below! This is best way to keep it relevant, support us, keep the content here free and allow the idea to reach as many people as possible. **
-------------------------------------------------------------------------------
💸💸💸💸💸💸
👇 👇 👇 👇 👇 👇
The current BTC chart, incorporating my 'flash-crash' thesisThis chart illustrates the current Bitcoin pattern, with my 'April flash crash thesis.'
I believe we will see another thrust lower into the green box ranges before a spring into the fifth wave. However, the fifth wave will be a "false breakout," as a flash crash in mid to late April is likely to occur, intentionally designed to sweep liquidity by liquidating overleveraged positions and triggering stop losses—driving price past the previous low set in the green box, only for the market to recover shortly thereafter and continue its breakout to the upside. This breakout will likely push beyond the pattern, taking out the all-time high, and setting a new high somewhere in the 20K to 25K range.
There could be some opportunities in the next 4 to 6 weeks, but with opportunity comes risk. Always use a proper risk management strategy suited to your skill level and wallet size.
Good luck, and always use a stop loss!

Bitcoin Sell SetupHi everyone.
I think this area has a lot of potential to put a sell order. We can set an order or wait for a CHoCH in lower TF and then find another entry setup.
I'll update TPs later.
Dear traders, please support my ideas with your likes and comments to motivate me to publish more signals and analysis for you.
Best Regards
Navid Nazarian
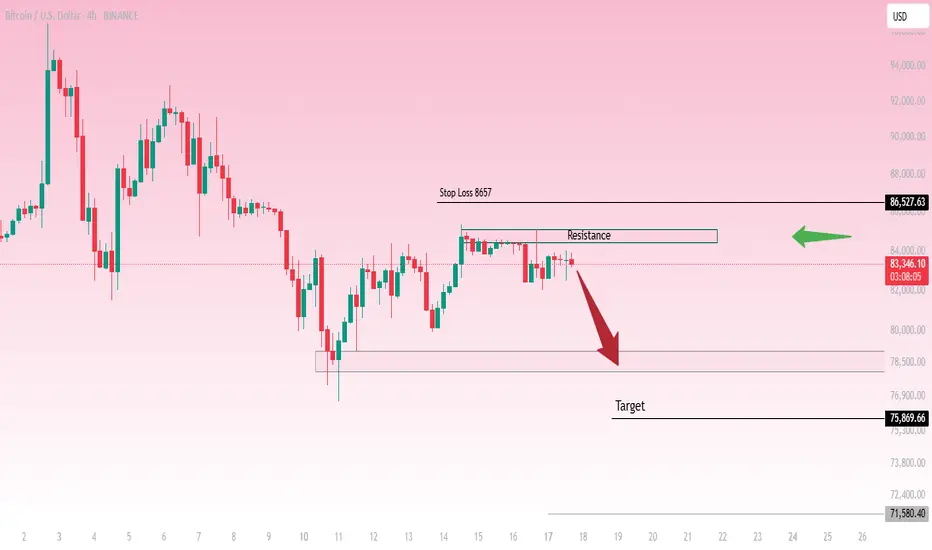
This is a 4-hour chart of Bitcoin (BTC/USD)This is a 4-hour chart of Bitcoin (BTC/USD) showing a key resistance level around $86,527 and a potential bearish move towards lower support zones.
Analysis:
Price is currently trading near the resistance zone, struggling to break above it.
A sell setup is suggested, expecting rejection from resistance.
The first target is around $78,500, with an extended downside target at $75,869 and possibly $71,580 if momentum continues.
A stop-loss level is placed above resistance at $86,527, indicating a risk management strategy.
The overall structure suggests bearish sentiment unless price breaks above resistance.
Potential Trading Plan:
📉 Bearish Scenario:
Short below resistance confirmation.
Targets at $78,500, $75,869, and $71,580.
Stop-loss above $86,527.
📈 Bullish Scenario:
A break and close above $86,527 could invalidate the bearish setup.
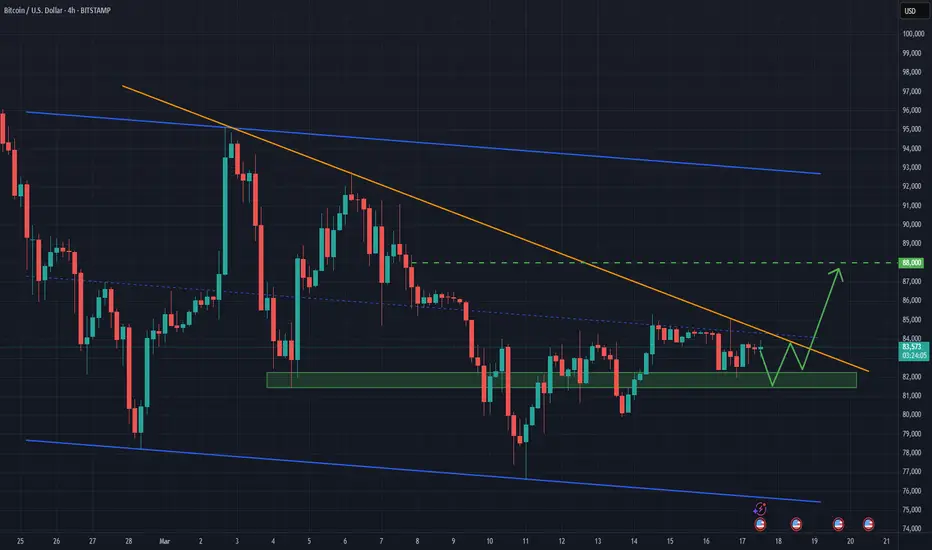
BTCUSDT Upside potentialThe BTC/USDT market is currently consolidating above the 80,000 level after breaking below February's low. Recently, a large weekly doji candle has emerged, signaling ongoing sideways movement. At present, the price remains within this week's trading range.
From a broader perspective, price action appears to be narrowing, forming a falling wedge pattern. With the market consolidating just below the downward trendline, a potential breakout above this level could signal further upside momentum. If the price manages to close above last week's high, it could lead to the formation of a solid inverse head and shoulders pattern, reinforcing the possibility of an upward extension. The next key target lies at the resistance zone around 88,000
BITCOIN Is this the 'most normal' Cycle of them all ??This is not the first time we use a Convergence/ Divergence approach to Bitcoin (BTCUSD) Cycles and certainly not the last one. On the previous one, it helped us to succesffuly predict the end of 2022 bottom but what we couldn't anticipate is how smooth the new/ current Cycle 5 (orange trend-line) would be.
As the title says, this is probably the 'most normal' Cycle of them all, as BTC has been trading within a Channel Up (orange) since the Bear Cycle's bottom more than 2 years ago.
To get a better understanding of this claim, we compare Bitcoin's (BTCUSD) Cycles from their previous top to the next one (with the exception of the first), on this complete mapping analysis, having them all displayed on top of another: Cycle 1 (green trend-line), Cycle 2 (red), Cycle 3 (blue), Cycle 4 (black) and the current one Cycle 5 (orange).
** Diminishing Returns **
As you see, first of all, this showcases the Theory of Diminishing Returns, which suggests that as the market grows and higher adoption is achieved, BTC will show less and less returns in each Cycle. Every Cycle Top has been lower from the previous one.
** Cycle Convergence - Divergence **
Secondly, all Cycles particularly during their Bear Phase and for a short time after, tend to follow a common path. The illustration on this analysis is very clear as it starts with each Cycle's Bear Phase and you can see that when they diverge, they converge again quickly. The most recent Bear Phase was not surprisingly as long as Cycle 4 and almost Cycle 3, which was to be expected as the market has shown an amazing degree of symmetry in the past 10 years. Note that this is also the model that helped as determine very early in 2023 that Cycle 3 would be the best fit for the new Cycle in terms of price action and without a doubt, BTC has been mostly replicating that Cycle.
** What's next for the current Cycle? **
If we compare the current Cycle (5) with Cycle 3 we can see that the Convergence - Divergence Model is holding. So far when Cycle 5 converged, it immediately diverged. And this is exactly what it has been doing since the December High and the marginal January All Time High (ATH). It has started to diverge significantly from Cycle 3 so what the recent pull-back to the 1W MA50 achieved is to normalize it and is about to touch it.
Now that the price hit the bottom of its +2 year Channel Up, we expect to rise, which will achieved convergence and contact with both Cycles 3 and 4, which is what they both did in their last 150 days of their respective Bull Cycles. Technically, this can take Cycle 5 to around $150k.
As we've first mentioned in the crypto space, regarding the last Bear Market being the 'smoothest' in history, we can securely say now that the current Bull Cycle is also the 'most normal' ever.
So what do you think? Does this Cycle regression model offer any useful conclusion as to where Bitcoin might top and if so, is this Cycle indeed the 'most normal' in the history? Feel free to let us know in the comments section below!
-------------------------------------------------------------------------------
** Please LIKE 👍, FOLLOW ✅, SHARE 🙌 and COMMENT ✍ if you enjoy this idea! Also share your ideas and charts in the comments section below! This is best way to keep it relevant, support us, keep the content here free and allow the idea to reach as many people as possible. **
-------------------------------------------------------------------------------
💸💸💸💸💸💸
👇 👇 👇 👇 👇 👇

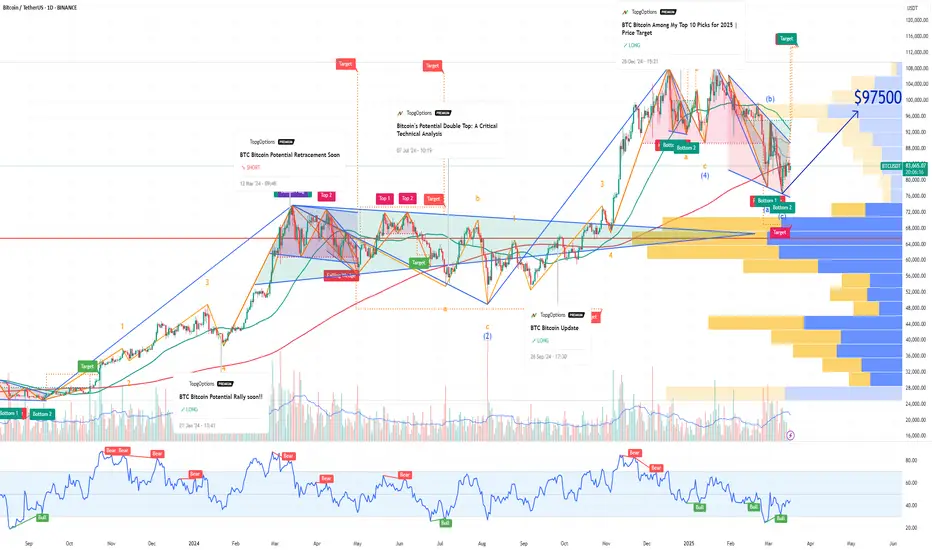
BTC Bitcoin Technical Rebound Despite Whale Short Position !If you haven`t sold this recent top on BTC:
Now Bitcoin (BTC) has recently pulled back, but signs are emerging that a technical rebound could be imminent.
A large crypto investor, or whale, has reportedly opened a 40x leveraged short position for over 4,442 BTC (valued at over $368 million), effectively betting on a near-term price drop. However, this appears to be more of a short-term, low-volume trade rather than a sustained bearish position.
Given the high leverage involved, the whale will likely seek to close the position soon with a modest profit rather than holding it as a long-term directional bet. Weekend trading volumes tend to be lower, which could contribute to short-term price weakness — but once the position is closed, buying pressure could return, fueling a recovery.
From a technical perspective, Bitcoin is currently near key support levels, with momentum indicators like the RSI signaling oversold conditions. Historically, similar setups have led to sharp rebounds as short covering and renewed bullish sentiment drive prices higher.
My price target for Bitcoin is $97,500 by the end of the year, which would represent a recovery of approximately 15-20% from current levels. If the whale closes the short position and broader market sentiment stabilizes, Bitcoin could quickly regain upward momentum toward this target.
Solana ($SOLUSD) - Monthly Demand InboundQuick TA for Solana $SOL. Many cryptos are at inflection points and will likely break higher or roll over from current prices (I think a move down is more likely, per long-term charts, and am hoping this happens for the sake of buying opportunities). Solana, like many other cryptos, has failed to develop meaningful 1D bullish momentum (RSI holding below 50). Should COINBASE:SOLUSD get another leg down, I'll be watching its behavior as it enters lower demand zones. 101.75-78.87 = monthly demand; 74.85-51.37 = weekly demand, but there are also buy areas higher. If Solana trades lower and approaches the aforementioned levels, use LTFs for signs of exhaustion/downtrend reversal. Personally, I wouldn't use "set-and-forget" buy limit orders; higher-beta cryptos may keep selling off until majors bottom/reverse and/or prices might not trade low enough to hit your limit price. I prefer more of a "hands-on" approach to trading, but to each their own.
On the road, so truncated analysis. Will update when I can. Thank you for your interest and let me know what you think!
Jon
@JHartCharts

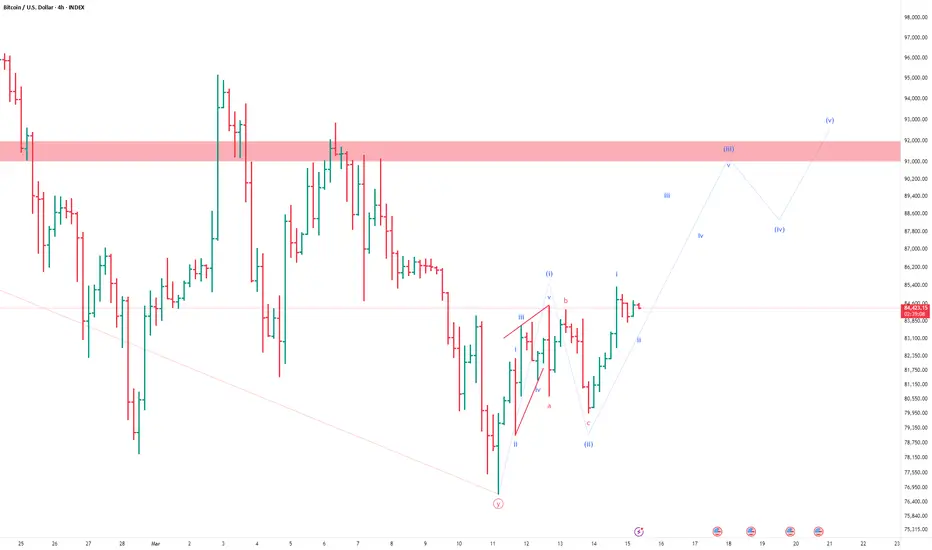
[Potential Bullish Alternative] Bitcoin Elliott Wave CountsLet's face it. None of us want BITSTAMP:BTCUSD to go down. Isn't it?
So whenever I see a potential/local bottom, I start looking for a bullish possibility. Few days back, #BTC dipped below 77K so I started counting waves from that point to see if there could be anything good happening here.
On the 4H chart here, I can see a 5 wave move up (wave (i)) which could be described as a leading diagonal followed by a a-b-c down in wave (ii). The next move up (supposedly wave (iii)) seem to be looking fine so far. I can easily count 5 wave impulse in it by drilling it down to 1H chart. Note that, this would be just i of (iii). SO far so good.
Disclaimer : Note that this is something we all elliott wave chartists do when we see a bottom to assess if a new trend could be starting. This is just one (bullish) alternative that I am exploring. There are bearish alternatives as well.
BTCUSD: Phase 4 of Bull Cycle just started.Bitcoin is about to turn neutral again on its 1D technical outlook (RSI = 44.562, MACD = -3343.000, ADX = 34.423) as it is making a big 1W comeback on this week's candle following a nearly perfect touch of the 1W MA50. Every test of the 1W MA50, as well as every test of the S1 1W RSI level, has been a straight buy opportunity inside the Bull Cycle's Channel Up since the very begining of the November 2022 bottom.
As first the price action was concentrated on the lower half of the Channel Up (green zone) but since February 2024 it has been primarily on the upper half (blue zone) as the rallies got more aggressive, with the only exceptions being the 1W MA50 tests such as the current one (green Arcs). Every bottom rebound has increased by at least +98.76%, so that gives us a peak estimate of TP = 150,000. An temprary high around 120k and pullback to 100-90k is a possible scenario based on all previous rallies/ Phases. Phase 4, which should technicall be the final of the Bull Cycle, has just started.
## If you like our free content follow our profile to get more daily ideas. ##
## Comments and likes are greatly appreciated. ##

Bitcoin is ABSOLUTELY under Pressure - It MUST react before DECI have been looking at this in detail for some time and have decided to change how I calculate things and here is the result.
There are 2 things of Massive importance to see here.
First is that Curve that PA has been under since 2010
The Lower Dashed Line is the Trend line formed in 2011. It is Strong and it is Valid and PA is currently running along it.
Here is a closer image to show you where we are in relation to it right now. Directly below PA currently, we hit that line around 67K
The Apex of this "Triangle" is December THIS YEAR
PA Has to break Above that Arc, the same Arc that has Rejected PA EVERY TIME since 2011
BUT THIS TIME IS DIFFERENT - IT HAS TO BE and here is why
I am not going to explain the % increase each Cycle Low to ATH, it is in the chart but I do want to show you this,
The first real push of Bitcoin was a massive % rise that created the ATH that formed the 1st point of the Lower Trend line of the New channel. This is A on the chart
The Next push was to B. This push was 1.433% of the Original push A - smaller by a long way in % terms.
These 2 moves created the channel that PA has remained in ever since. ( see dashed upper trend line)
From this point on, we can see that each cycle push , while in channel, has been approx 20% of the previous rise. Or around 1/5 of the size in % terms
Or to put is another way, Each Rise has been a diminishing % rise from previous.
Look at that curve. It has pushed PA down each cycle ATH
This cycle, we are currently at 26.7% of the previous push ( to 2021 ATH ) and it has created a cycle ATH currently.
But is the cycle Over ? - Hopefully NOT
Because if it is NOT over, we need to break through that Curve of resistance by December.
The Much expected 200K ATH is way over that curve and would result in a 55% of previous push rise. That would break the "trend"
This is VERY Different. But Absolutely required.
So, the question that should be on Everyone's lips is "Which is stronger ? The line or the Arc ?"
My expectation is that we will break through. That Arc has been a Major part of the formative years of Bitcoin PA but now, it could prove detrimental. Because, if we do not break through it, It will push Peice DOWN, through that line of Long term support.
We do not want that
SO, Maybe THIS is why the Bulls are waiting for the Weekly MACD to reset to Neutral...PA Needs the strength to break through.
So, Go Buy your Local BULL a Beer ( or white wine lol ) and Lets get on.
Watch this Close. It really is more important that Trumps Reserve, Saylors Love nest or Bezos after burners.................

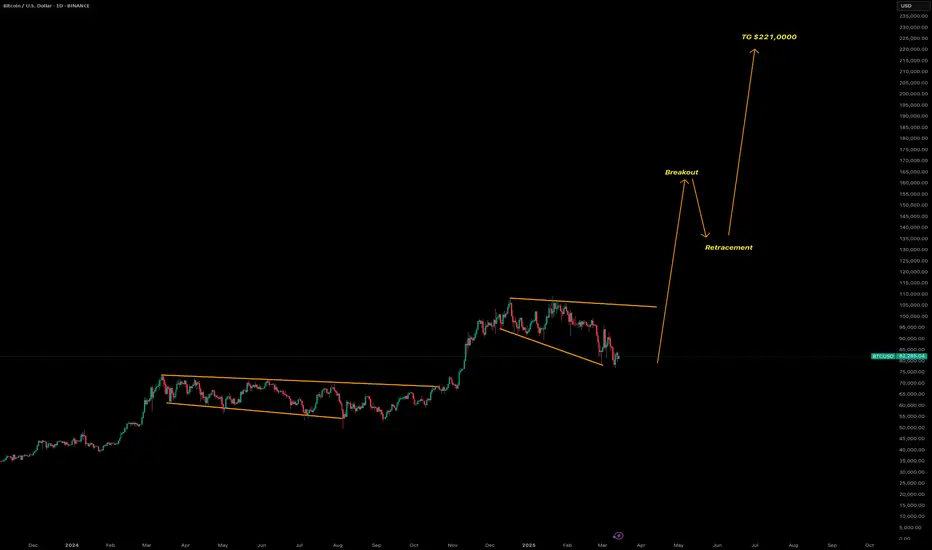
Bitcoin will reach $221,000The chart explicitly labels a "Breakout" point around December 15, 2024, where the price moves above the $80,000 resistance level of the ascending triangle. This breakout is a significant technical event, suggesting strong buying pressure and a continuation of the uptrend. Following the breakout, the chart notes a "Retracement" phase, where the price pulls back to test the breakout level (now acting as support at approximately $80,000). This behavior is common in technical analysis, as prices often retest previous resistance levels after a breakout to confirm support.
As of March 14, 2025, the current price of $80,228.30 is just above the $80,000 level, suggesting the price may be in the early stages of this retracement or has recently stabilized after testing the support. This positioning indicates potential buying opportunities for traders looking for entry points near this level, with expectations of further upward movement.
Projected Price Target: $221,000
One of the most notable annotations on the chart is the "TG $221,000" label, which stands for "Target Price" of $221,000. This target is projected based on the breakout from the ascending triangle, likely calculated by taking the height of the triangle (the difference between the resistance at $80,000 and the lowest support at $55,000, which is $25,000) and adding it to the breakout level ($80,000 + $25,000 = $105,000). However, the chart's projection to $221,000 suggests a more aggressive target, possibly involving a multiple of the height (e.g., 3x the height, $80,000 + $75,000 = $155,000, still not reaching $221,000) or a Fibonacci extension beyond standard calculations.
Given the significant gap between the current price ($80,228.30) and the target ($221,000), this projection is an unexpected detail, implying a potential multi-fold increase in Bitcoin's value. It aligns with the chart's bullish patterns but involves considerable uncertainty, as market conditions, macroeconomic factors, and adoption rates could influence actual price movements.
Additional Technical Observations
Beyond the ascending channel and triangle, the chart includes several other technical elements:
Support and Resistance Levels: The $80,000 level, initially a resistance during the triangle, becomes a key support level post-breakout. The lower trendline of the ascending channel also acts as dynamic support throughout the uptrend, providing a floor for price corrections.
Volume Indicator (Implied): While not explicitly shown, breakouts like the one labeled are often accompanied by increased volume, which would confirm the strength of the move. Without a visible volume histogram, this remains an inference.
Fibonacci Retracement (Potential): The retracement after the breakout could be analyzed using Fibonacci levels (e.g., 38.2%, 50%, 61.8%) to identify key support zones, though these are not drawn on the chart.
Momentum and Moving Averages (Implied): Although not visible, momentum indicators like RSI or MACD could provide additional insights. For instance, a strong breakout might correlate with overbought RSI, while the retracement could indicate a return to neutral levels. Moving averages (e.g., 50-day, 200-day) might have supported the uptrend earlier, with the price potentially approaching these for support during retracements.
Implications for Traders
The analysis suggests Bitcoin is in a robust bullish trend, supported by the ascending channel, triangle breakout, and projected target. Traders may consider the following strategies:
Buy on Pullbacks: Look for buying opportunities near the $80,000 support level, especially if volume and other indicators confirm buying pressure.
Target Setting: Use the projected target of $221,000 as a long-term goal, but be mindful of market volatility and external factors that could affect price.
Risk Management: Given the significant gap to the target, set stop-loss levels below key support (e.g., below $80,000) to manage risk.
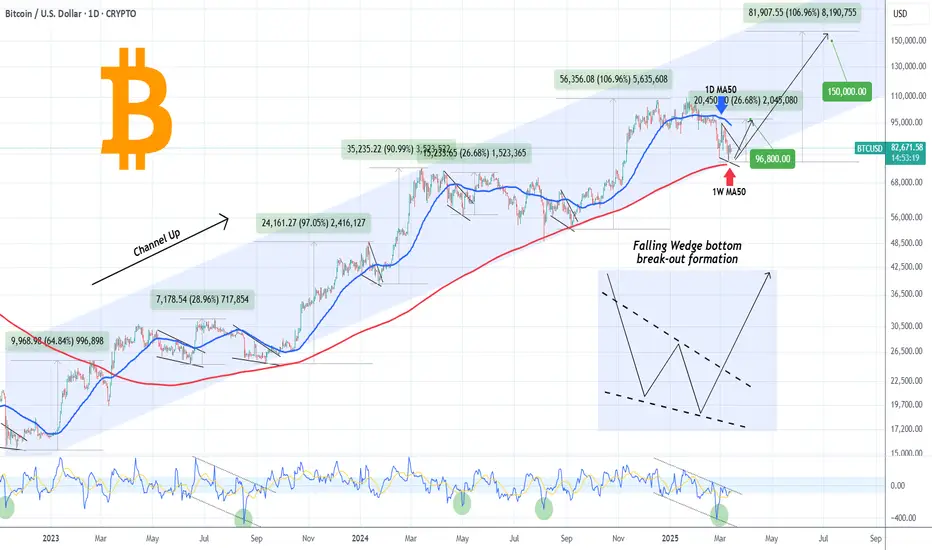
BITCOIN Is this a Falling Wedge bottom formation?Bitcoin (BTCUSD) is trading since the February 28 Low within a Falling Wedge pattern, below the 1D MA50 (blue trend-line) and at the same time supported by the 1W MA50 (red trend-line).
Throughout its dominant Bull Cycle pattern, the +2 year Channel Up, it has formed another 6 such Falling Wedges, all below the 1D MA50 and all turned out to be market bottom formations, which paved the way for an immediate bullish break-out. On all occasions, the 1D CCI has been almost as low as on the February Low.
The shortest rebound it made before another break below the 1D MA50, was +26.68% and the highest was +106.96%. As a result this gives us a minimum immediate potential Target of $96800 and a maximum of a little more than $150000. Given that the price has touched the bottom of the long-term Channel Up, like the bottom formations of September 06 2024 and September 11 2023, it is quite likely to see the stronger rebound probability taking place.
But what do you think would be the case? Is this a classical Falling Wedge bottom break-out formation and if so what may be the Target? Feel free to let us know in the comments section below!
-------------------------------------------------------------------------------
** Please LIKE 👍, FOLLOW ✅, SHARE 🙌 and COMMENT ✍ if you enjoy this idea! Also share your ideas and charts in the comments section below! This is best way to keep it relevant, support us, keep the content here free and allow the idea to reach as many people as possible. **
-------------------------------------------------------------------------------
💸💸💸💸💸💸
👇 👇 👇 👇 👇 👇
BITCOIN BULLISH TO $116?!After a redistribution phase where late buyers got wrecked at the top the market, we've seen price drop back down liquidating multi-billions in buy orders in the past few weeks. I believe this Wave 4 shakeout will now be followed by another bull run.
Bitcoin’s Wild Ride: Up or Down, I’m Watching!Hey there, trading family—just chilling and watching Bitcoin like it’s my buddy on a rollercoaster. It’s hanging out near that FWB:83K spot, and I’m like, “Dude, if you bust through, I can see you tearing up to $120K-$130K—time for a high-five and a snack!” But if you start slipping with those lower lows, no biggie. You might drop to $79,600, then maybe $78,700, $77,000, or even $73,500. I’m just kicking back, enjoying the show—up or down, it’s all good vibes! If you liked this, comment below, boost, or follow—let’s keep the trading love going!
Kris/ Mindbloome Exchange
Trade Smarter Live Better
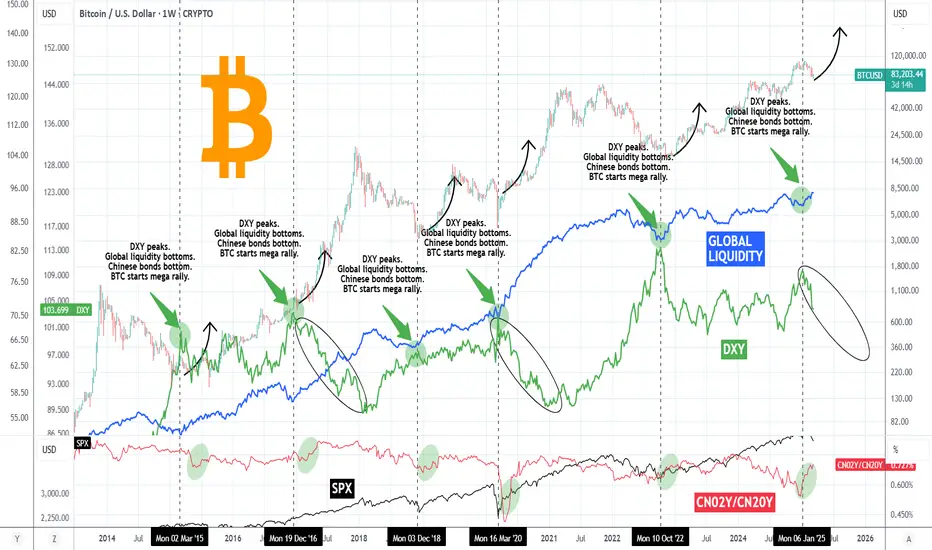
BITCOIN Money Supply, Dollar and Bonds pushing for MEGA RALLY!This is not the first time we publish a Bitcoin (BTCUSD) analysis in relation to the U.S. Dollar Index (green trend-line) or Chinese Bonds (red trend-line) and Global Liquidity (blue trend-line). In fact we have been doing this since the late 2022 bands in China and like the highly bearish sentiment that was in the market then, we decided to dive into this cross-asset analysis yet again in order to put the current sentiment in perspective.
Well it couldn't be more relevant. What we discovered is that all the financial assets mentioned above have yet again aligned to offer the strongest bullish confirmation for BTC since the November 2022 Bear Cycle bottom!
More specifically, we are a little past the point where the DXY peaks and declines aggressively, Global Liquidity bottoms and starts rising, while Chinese bonds (our CN02Y/CN20Y ratio) bottom and rise aggressively. In the past 10 years this combination of events has happened 6 times, 2 times during each Cycle: one at the bottom of the Cycle and the other when the final, most aggressive rally starts.
Notice also that (naturally) this is where the stock market (SPX, black trend-line) also bottoms and starts rising aggressively.
As a result, the above market conditions are an indication that despite the recent monthly correction and turbulence due to a number geopolitical and other trade fundamental reasons, the macro-economic parameters remain intact for the wider picture of this Cycle. Truthfully, this is where an announcement next week of future Fed Rate Cuts would come very handy.
So what do you think of this analysis above? Are you fearful that a new Bear Cycle is starting or more confident that the market will soon recover and price a new High? Feel free to let us know in the comments section below!
-------------------------------------------------------------------------------
** Please LIKE 👍, FOLLOW ✅, SHARE 🙌 and COMMENT ✍ if you enjoy this idea! Also share your ideas and charts in the comments section below! This is best way to keep it relevant, support us, keep the content here free and allow the idea to reach as many people as possible. **
-------------------------------------------------------------------------------
💸💸💸💸💸💸
👇 👇 👇 👇 👇 👇
Bitcoin - The Uptrend Remains 100% Valid!Bitcoin ( CRYPTO:BTCUSD ) can create a textbook break and retest:
Click chart above to see the detailed analysis👆🏻
Over the past couple of weeks we have only been seeing a consolidation on all cryptocurrencies, governed by the slow movement on Bitcoin. With today's drop Bitcoin is now approaching the previous all time highs, which are now acting as a major support, pushing price much higher.
Levels to watch: $70.000, $300.000
Keep your long term vision,
Philip (BasicTrading)

BTCUSD: Last 1W MA50 rebound to the top of the CycleBitcoin remains bearish on its 1D technical outlook (RSI = 40.004, MACD = -3484.800, ADX = 36.461) but today we see the first recovery attempt. The technical reasoning behind it is that the market is testing its 1W MA50 and in due time it will price the new HL of the Bull Cycle and form the bottom that will hold for the rest of the year until the cycle's very top. This is no different than the last two Cycles, the 1W RSI is even rebounding on its S1 level. Based on that pattern we are looking at a potential Cycle peak between 150k - 200k.
## If you like our free content follow our profile to get more daily ideas. ##
## Comments and likes are greatly appreciated. ##
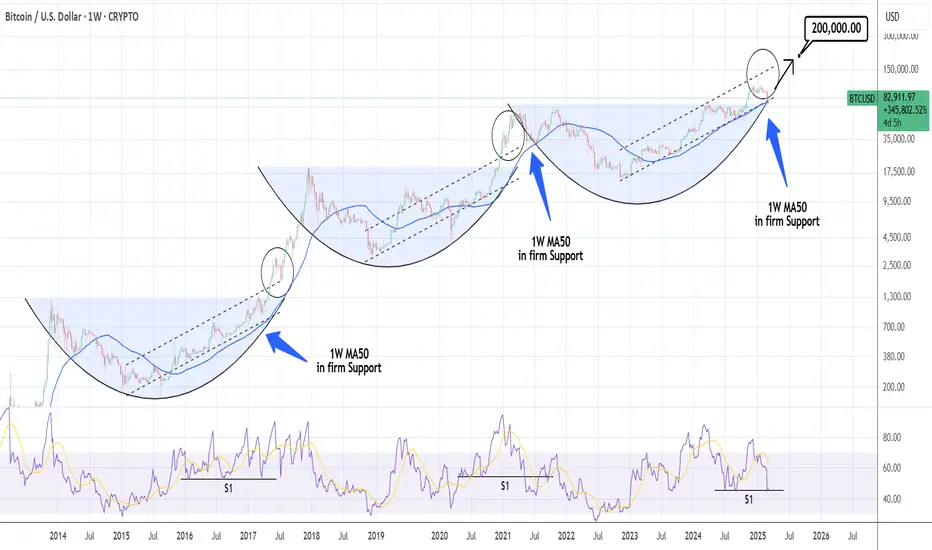
BITCOIN Cycle pattern completed. Year-end Target locked at $150kBitcoin (BTCUSD) is showing the first signs of life after nearly testing the 1W MA50 (blue trend-line) early this week. Whether this leads to a full on recovery or not, can been partially answered by this Cycle's price action so far.
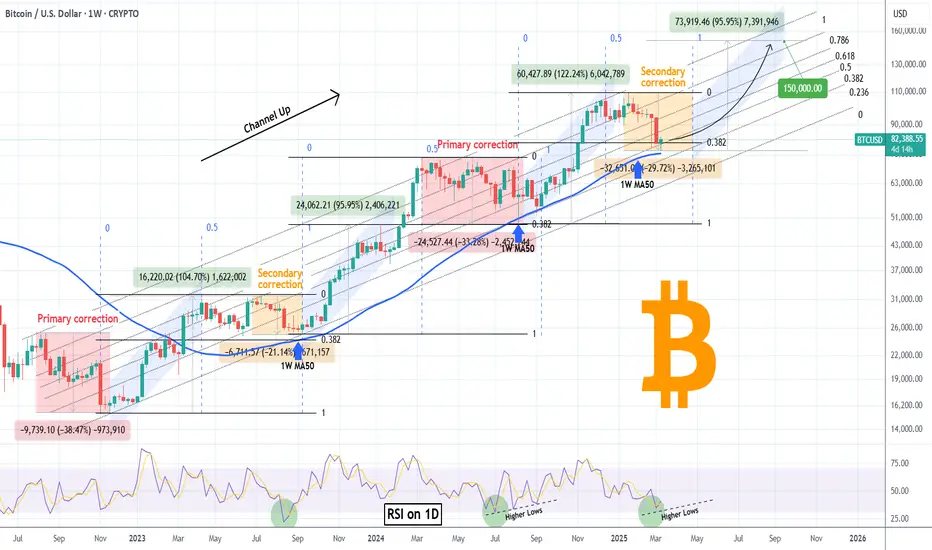
Historically we do know that BTC's Bull Cycles so far tend to peak towards the end of their 3rd year and that's 2025. This Cycle has been predominantly trading within a Fibonacci Channel Up, since its very start, the November 2022 bottom. Its 1W MA50 has been supporting since the March 13 2023 break-out, so it's been exactly 2 years of holding and throughout this time period has provided two excellent buy opportunities.
As you can see, the Channel Up can be classified into two main Phases so far: each has a Primary correction (red) of more than -30% drop, followed by a rally (blue), then a Secondary correction (yellow) of more than -20%, followed by the second and last rally (blue). All rallies have so far been around +100%. Based on this model, we are now on the Secondary correction of Phase 2.
Notice that all corrections (either primary or secondary) hit or approached apart from the 1W MA50, the 0.382 Fibonacci retracement level from their previous Low. This is actually the first time that the price has marginally broken below the 0.382 Fib. At the same time, the 1D RSI almost got oversold last week (34.50) and according to the August 05 2024 (Higher) Low, this is were a series of RSI Higher Lows would be a signal of a new bottom formation.
The bottom and recovery process may take a while though, another 4-6 weeks. According to the Time Fibs (blue dashed vertical lines), each correction (whether primary or secondary) has ended at or a little before the 1.0 Fib with the 0.0 being the bottom of the previous one and 0.5 Fib the Top of the rally. Based on this, we can expect the new rally to start by the week of April 28 the latest.
So now as to how high this can get, if it repeats the 'weakest' rally of the Channel's three so far, it should rise by +95.95%, which gives us a straight price of $150000 as a Target. If the rally symmetry also holds, this should come by late September, perfectly aligning with Bitcoin's historic Cycle expectation for the final year.
Do you think that will be the case? Recovery starting within 4-6 weeks and if so, are you expecting $150k? Feel free to let us know in the comments section below!
-------------------------------------------------------------------------------
** Please LIKE 👍, FOLLOW ✅, SHARE 🙌 and COMMENT ✍ if you enjoy this idea! Also share your ideas and charts in the comments section below! This is best way to keep it relevant, support us, keep the content here free and allow the idea to reach as many people as possible. **
-------------------------------------------------------------------------------
💸💸💸💸💸💸
👇 👇 👇 👇 👇 👇
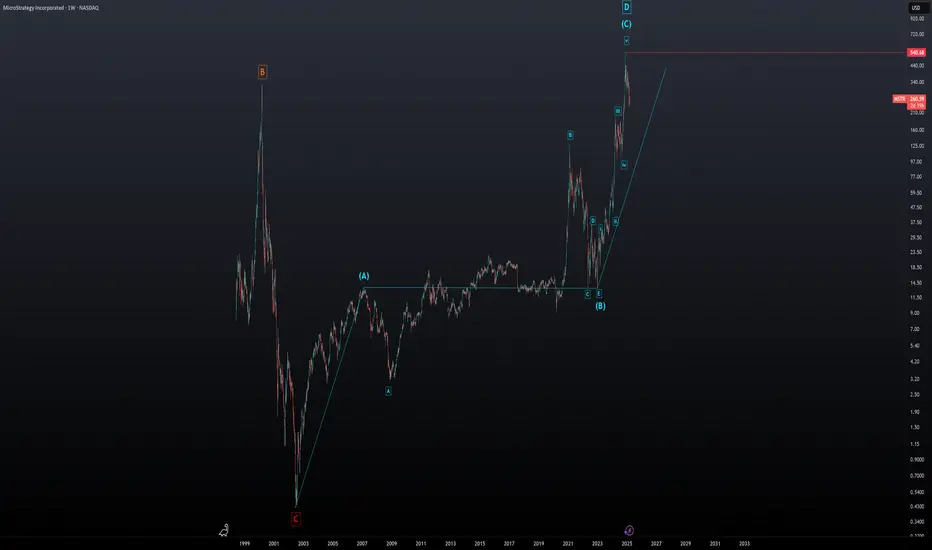
MicroStrategy - Wave D Since 2002 Just Completed...AriasWave analysis indicates that MicroStrategy, now known as Strategy, is poised for a sharp decline reminiscent of the Dot-Com Bust era.
The anticipated drop in Wave E is expected to coincide with a significant downturn in broader indexes and cryptocurrencies.
Additionally, my latest Bitcoin analysis, set to be released later this week, suggests that Bitcoin has finally peaked, and a price collapse is only a matter of time.
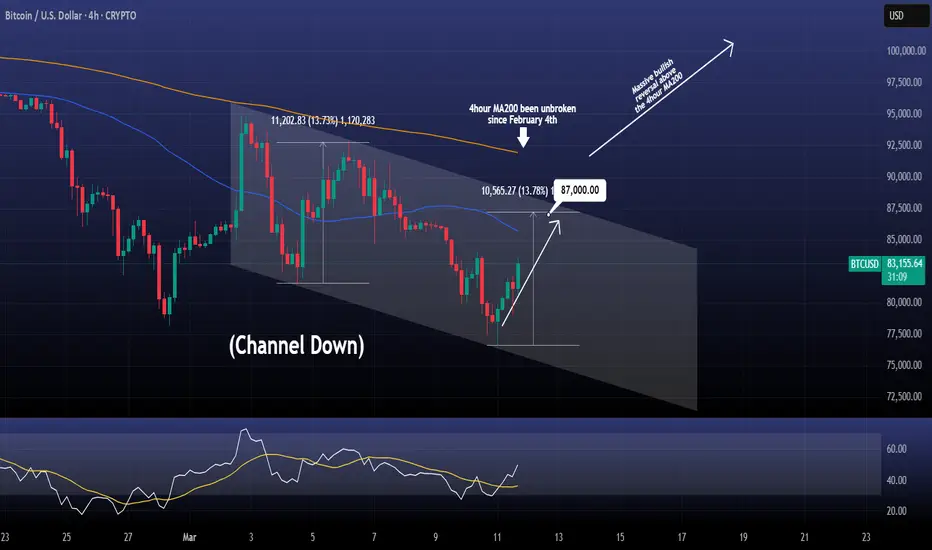
BITCOIN Short term Channel Down rebounding.Bitcoin / BTCUSD is having a rebound after the price hit the bottom of the 10 day Channel Down.
The bullish wave should attempt at least a +13.73% rise (similar to the previous one) and target 87000.
That is the short term bullish plan as the price may be rejected again at the top of the Channel Down.
If however the 4hour MA200 breaks, it will be the first time since February 4th and should be enough to restore the long term bullish bias back to the market.
Follow us, like the idea and leave a comment below!!
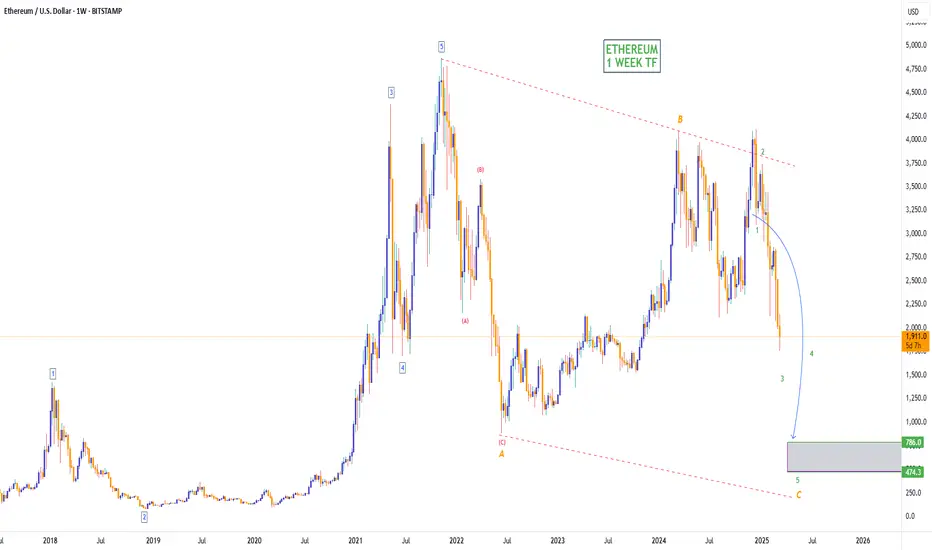
ETHEREUM CRASH TO $786! (UPDATE)Remember my Ethereum sell prediction from September 2024? Despite it pushing a little higher, price has remained within the trendlines & bearish channel, keeping its trend in a 'downtrend'.
We're still within a 3 Sub-Wave (A,B,C) corrective channel, with the current bearish move down being Wave C. Wave C target still remains around $786🩸