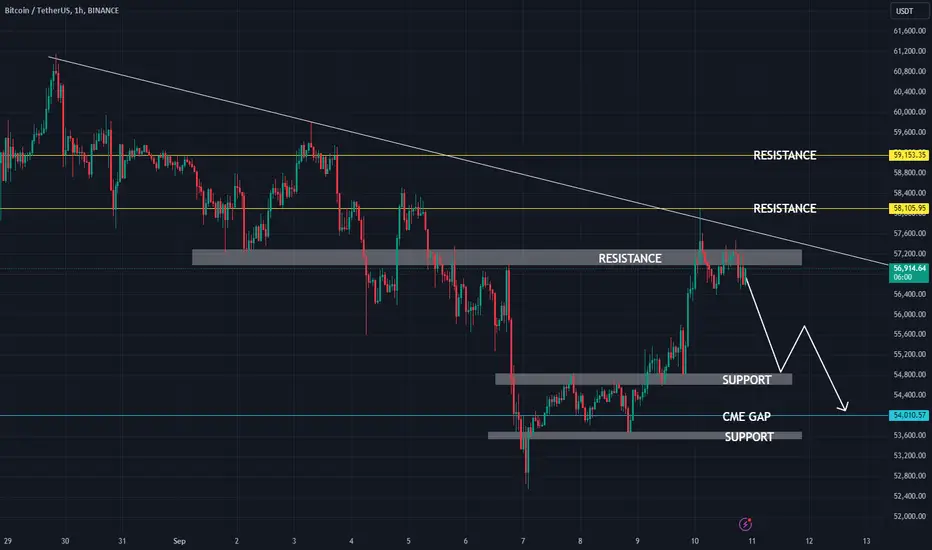
BTC : Bearish For Short TermBitcoin's looking bearish short-term. Key supports to watch: 54,800 and the CME gap at 54,000. I expect a bullish reversal around 53,500-54,000. Resistance is strong at 58,000 and 59,000. My take: we'll see a dip before any upward movement.
Bitcoin-btcusd
Long Position for BitcoinIn the range of 53,600 to 55,400 dollars, you can think about a position to buy bitcoin. Get confirmation of this position in 1H time frame.
INTRY: 53600 to 55400
Stop Loss: 52300
TP1: 58200, TP2: 61100, TP3: 64000, TP4: 66800
Footnote: Position number 1 is related to the previous analysis.

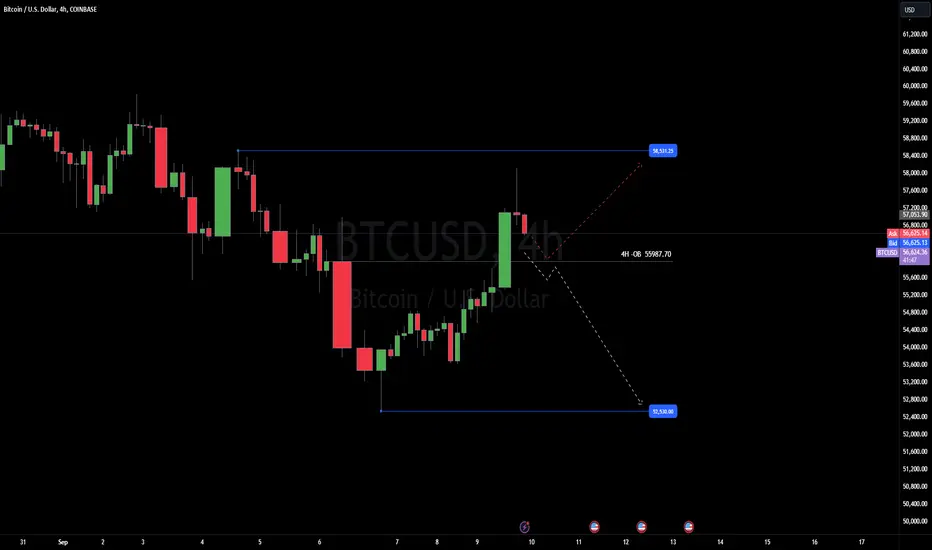
BTC USD UpdateWe got liquidity taken, so I'm scalping short and about to take the first profit. Daily closed bullish, so I'm still not sure about this range. If we see 55987.70, 4h - Neg OB flips bullish, I will be out of my short and looking for a new plan. It could easily go higher or lower. We are in scalping territory, so be careful. Sniper entries for us only on very small timeframes and quick profits. Let's see what London and New York will do to us today. I'll keep ideas flowing here.
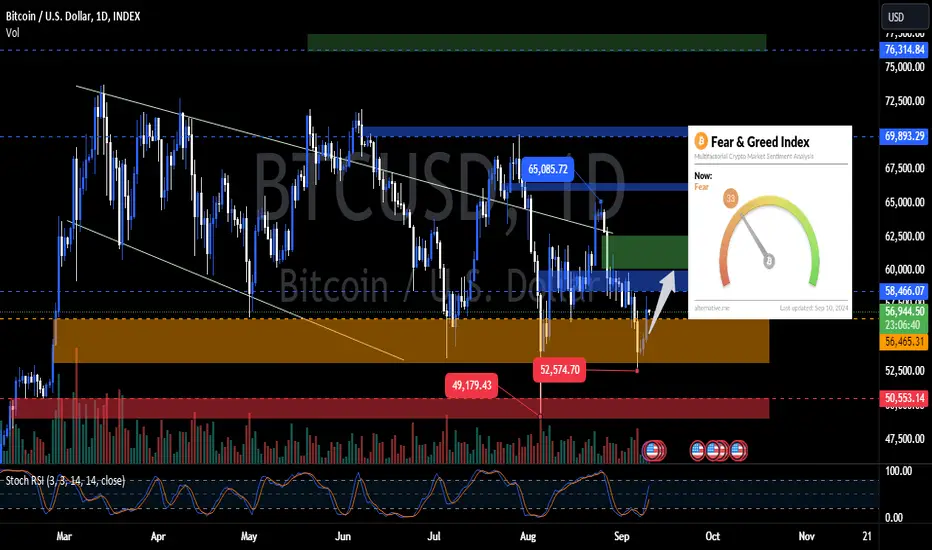
BTC Breaks 55K, What's Next?GM crypto bro's, BTC finally pumps and breaks above 55K! This morning, the Fear and Greed Index is at 33 (Fear), and the Stochastic RSI has managed to exit the oversold area.
Where will BTC go next? Based on today's price action, after this pump, a slight correction might occur around the 55K area. If the pump continues, the next target could be in the 60K - 61K range, or it might just reach 59K.
Stay alert, as sudden dumps can still happen in the crypto market. As always, maintain your risk! That's it for today's crypto update. This is Akki, signing off with one chart. Have a nice day!
BITCOIN Bullish Breakout! Buy!
Hello,Traders!
BITCOIN was trading in a
Falling channel but now we
Are seeing a bullish breakout
And after a potential pullback
We will be expecting a
Further move up
Buy!
Like, comment and subscribe to help us grow!
Check out other forecasts below too!

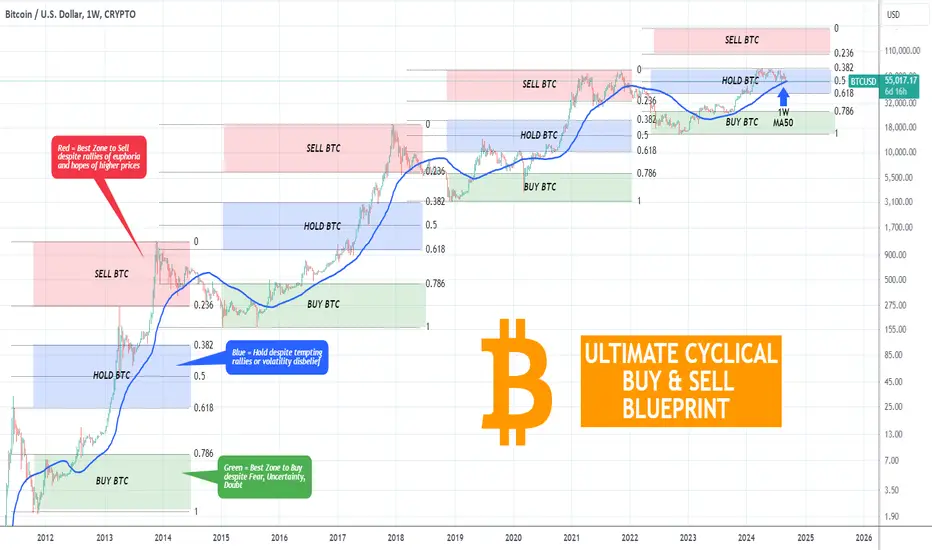
BITCOIN The Ultimate Cyclical Buy & Sell Blueprint! MUST SEE !!!Bitcoin (BTCUSD) has been basically trading sideways for the past 6 months following the massive surge at the start of the year due to the introduction of the BTC ETF. There might be no better way to illustrate this 6-month ranged trend than the current chart on the 1W time-frame.
** Buy-Hold-Sell Zone **
On this chart we depict BTC's Cycles in terms of Zones of BUY-HOLD-SELL. As you can see the first two Cycles placed their previous tops just above the 0.618 Fibonacci level, while the most recent one just below the 0.382 Fib.
** When to Buy **
We've found that the 1.0 - 0.786 (Green) Fib Zone is usually the best Zone to Buy, despite the FUD (Fear, Uncertainty, Doubt) investors may have at the time due to the concluding Bear Cycle. All these emotions are normal to have under those circumstances but it's those that traders need to filter out and make the cold decision to buy.
** When to do nothing **
The 0.618 - 0.382 (Blue) Fib Zone is where investors are encouraged to do nothing and just Hold BTC, despite the temptation to sell and take profits after the first strong rallies of the new Bull Cycle or at times when volatility hits the market and disbelief of Bull Cycle continuation makes its presence.
** When to Sell **
The 0.236 - 0.0 (Red) Fib Zone is the best Zone to Sell, even if successive rallies hit euphoria to very high levels making investors expect/ hope that the Bull Cycle will continue to higher and higher levels.
** So where are we now? **
So assuming that the current Cycle will have the previous top just below its 0.382 Fib (such as the previous Bull Cycle 2019 - 2021), we can clearly see the potential Zones of Action.
The 1.0 - 0.786 Fib Zone (Buy) was from the moment of the 15.5k Bear Cycle bottom until Bitcoin roughly broke above the 1W MA50 (blue trend-line) again. Then it flashed its Buy Signal every time the March - October 2023 consolidation bottomed and pierced through the 0.786 Fib.
It becomes also obvious that the recent 6-month consolidation (March 2024 - now) we talked at the start is nothing but the usual cyclical Hold Action (0.618 - 0.382 Fib) for Bitcoin. In fact, as you can see, this sideways trading has been taking place at the upper level of the Hold Zone within the 0.5 - 0.382 Fib.
** Start selling at 100k? **
With the 1W MA50 tested again last week (2nd time since the first week of August) and so far holding, the market is making a case that we are in cyclical terms on the 'No-Action' region of the Cycle, and most likely shouldn't sell despite the disbelief and fear that the recent 6-month ranged trend may have caused. The time to start selling, if the model is materialized, will be at exactly $100k (0.236 Fib) and potentially lasting up to just below the $200k mark (0.0 Fib).
But what do you think? Do you like this Buy-Hold-Sell Zone classification? Are you expecting this model to repeat the cyclical activity of past Cycles and if so, will you start selling at $100k? Feel free to let us know in the comments section below!
-------------------------------------------------------------------------------
** Please LIKE 👍, FOLLOW ✅, SHARE 🙌 and COMMENT ✍ if you enjoy this idea! Also share your ideas and charts in the comments section below! This is best way to keep it relevant, support us, keep the content here free and allow the idea to reach as many people as possible. **
-------------------------------------------------------------------------------
💸💸💸💸💸💸
👇 👇 👇 👇 👇 👇
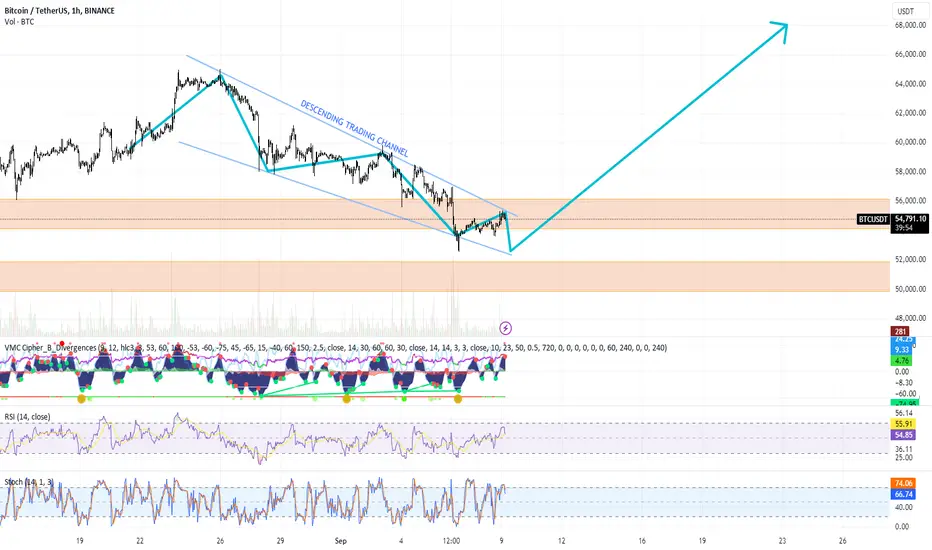
BITCOIN / USDT PAIR ON BINANCE (TECHNICAL ANALYSIS+TRADE PLAN)Technical Analysis of the Chart by Blaž Fabjan:
Descending Trading Channel:
BTC is trading within a descending channel, showing lower highs and lower lows, which typically signals a downtrend. However, it is nearing the bottom of the channel, often a zone for potential reversal.
Support and Resistance Zones:
Support: The two orange zones indicate strong support areas around $51,000 and $50,000. BTC may find buying pressure in these regions, especially as it touches the lower bound of the descending channel.
Resistance: The current resistance area is around $55,000. BTC will need to break through this level to confirm a trend reversal.
Indicators:
RSI (Relative Strength Index): RSI is currently around 55, indicating a neutral trend. However, it is slightly moving upwards, suggesting potential bullish momentum, though not overbought yet.
Stochastic Oscillator: This is showing a crossover at 74, indicating upward momentum, but it’s close to the overbought region. This may signal some resistance to immediate bullish continuation.
VMC Cipher B Divergences: This indicator is showing bullish divergences at several points, signaling potential reversal zones. Divergence with price action suggests a potential trend change in the near term.
Trading Plans:
1. Intraday Trading Plan:
Strategy:
Trade within the current channel. Watch for a breakout from the descending channel, especially on the 1-hour chart.
A breakout above the $55,000 level could confirm a short-term bullish move.
Look for pullbacks towards the $53,500-$54,000 region to enter long positions, targeting $55,500.
Place a stop loss just below $53,000 to protect against fake breakouts.
Indicators to Watch:
RSI trending above 60.
Stochastic Oscillator maintaining bullish momentum.
2. Scalping Strategy:
Strategy:
Focus on small price fluctuations within the support and resistance zones.
Look for quick entries near the support zones (around $53,500) and exits before it hits resistance ($55,000).
Scalping in tight time frames (5 to 15 minutes) around these price levels.
Key Levels:
Enter around $53,500 and exit at $54,500.
Place tight stop-loss orders around $53,000 to manage risk.
3. Swing Trading Strategy:
Strategy:
If BTC continues trading within this descending channel, wait for a breakout confirmation to take a long position.
A breakout above the channel and $55,500 would signal a strong move upwards, potentially to $58,000 or higher.
Enter long positions if BTC breaks and holds above the $55,500 resistance level, targeting $58,000 and beyond.
In case of a further dip, enter long positions around $50,000 support, which appears to be a strong reversal point.
Stop Loss: Below $50,000.
Conclusion and Long Position Advice:
Near-Term (Intraday): BTC could break above the descending channel, leading to a short-term bullish move towards $55,500. Watch closely for a breakout confirmation. You could consider entering long positions on pullbacks or a confirmed breakout.
Medium-Term (Swing Trading): A solid break of the $55,500 resistance could lead to a potential rally towards $58,000. Be cautious of potential false breakouts and place stop-losses below support levels.
Scalping: For those aiming for quicker profits, you can take advantage of price fluctuations within the $53,500-$55,000 range.
Overall, the chart shows signs of a potential bullish reversal, especially if BTC breaks out of the descending channel. For now, conservative traders may wait for a breakout confirmation before entering long positions. However, aggressive traders can consider buying near support levels, keeping in mind the risk of downward movement in case of failure to break resistance.
BTC's Next Move: Pump or Dump?GM crypto bro's, happy working day 🗿! This morning, the Fear and Greed Index remains in the Fear zone at 26. Stochastic RSI is still in the oversold area but shows signs of forming a double bottom.
With today's weekly closing candle, the likelihood of another BTC dump seems smaller compared to a potential pump. The 55K area has been visited; now we wait for the next move from the market makers.
Next pump possibility is around 60K - 61K, with a potential peak near 62K. However, if BTC drops below 52K, the chances for a pump diminish. As always, maintain your risk! That's it for today's crypto update. This is Akki, signing off with one chart. Have a nice day!
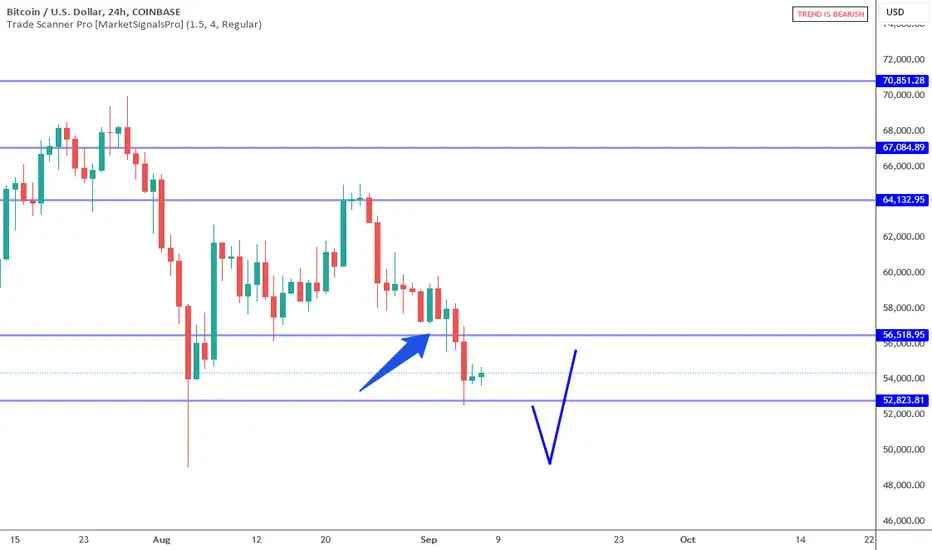
Bitcoin: 2 Lessons About 56K Break.Bitcoin clears 56K support even while attempting to confirm a reversal in the 60k area a week earlier. With price back in the 53K to 50K area support, this is a time to watch for short term reversals as well as an investment opportunity. At the same time, there are two very important lessons to be learned from this recent support break situation.
The arrow on the chart points to the 60K area where a week earlier price attempted to show support. Notice the green candle followed by the break of the high of that candle. That is a form of confirmation SPECIFIC to this time frame. With this clear long setup in place, the outcome was a stop out (break below the low of the green candle). The lesson here is this: Just because the market aligns and confirms, it does not guarantee a positive outcome. All markets are highly random and anything can happen at any time. This is precisely why RISK is ALWAYS the priority, NOT setups, wins, oscillators, news, etc.
The whole point of waiting for a confirmation and setup (aka signal) is to be able to clearly define risk and reward and then decide if the trade is worth taking based on your personal risk tolerance and situation. Taking trades on hunches, stepping in front of levels based on feelings and/or opinions will get you into trouble in times like this while other times these ineffective decisions seem to work. If you accept that fact that markets are random most of the time, you will be better prepared to avoid decisions like these. While it is within reason for supports the hold in this environment, it is better to be prepared for BOTH sides of the situation.
In my previous week's article I illustrated a scenario that the market completely ignored. In other words my anticipated idea was wrong. The second lesson is this: this is a NOT a game of being RIGHT, it is about defining risk and measuring potential. This is why WAITING for confirmation can help dramatically improve performance because the purpose is to prove that the market is aligning or agreeing with your anticipated premise. When there is no confirmation you can easily minimize adverse trades because you can't justify an entry. In the case of Bitcoin, there was a confirmation that failed, (green candle) followed by the test of the 56K area which attempted to reverse but NEVER confirmed on this time frame. Being able to avoid taking the wrong side of these support/resistance breaks improves overall performance significantly over time. This type of mindset is key for day trade and swing strategies.
Bitcoin is now nearing the 53K to 50K support zone. This will present potential reversal opportunities on multiple time frames (Trade Scanner Pro helps with this). At the same time, price is now within a broader support area which is ideal for investment opportunities. The 50K area is a MAJOR support in terms of the bigger picture. At the same time, there are some positive fundamental potential catalysts on the horizon: lower interest rates AND an election outcome that supports a Bitcoin friendly environment. Either way the idea here is to have an "inventory" acquisition plan and to cost average larger amounts that are weighted in terms of price location. Meaning the lower price goes, the larger the amount you can justify buying. I am not going into all the details here, but this assumes Bitcoin is NOT going to 0 in the long run. Also if accumulating in this way it is safer NOT to use leverage. IF Bitcoin breaks 50K, (it CAN happen) the mid to low 40's is the next support area (a place to buy more).
For the following week I anticipate a bullish reversal back into the 60K area and will be looking for setups across multiple time frames (day trades/swing trades). How you use this information will depend on the type of trade you are interested in taking. Either way, you have to begin with a premise, formulate a scenario around that premise, define a signal, then MEASURE the RISK if the signal appears. If RISK is not your focus, you are no better than the drunken poker player who pros warmly welcome to the table.
Thank you for considering my analysis and perspective.
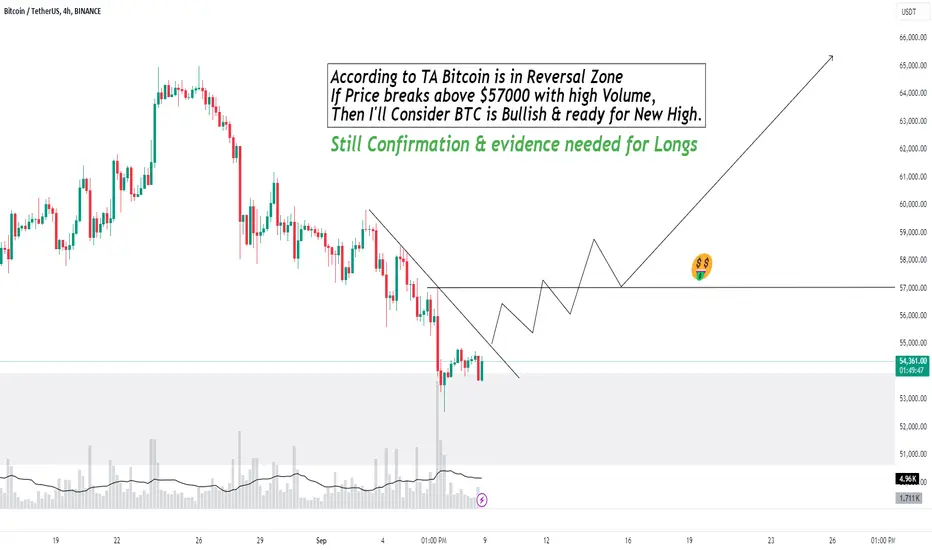
Bitcoin has no volumeAccording to TA Bitcoin is in Reversal Zone. If Price breaks above $57000 with high Volume, Then I'll Consider BTC is Bullish & ready for New High.
Note :
Do your own Research and Trade Wisely Never rely on my opinions.
Good Luck folks
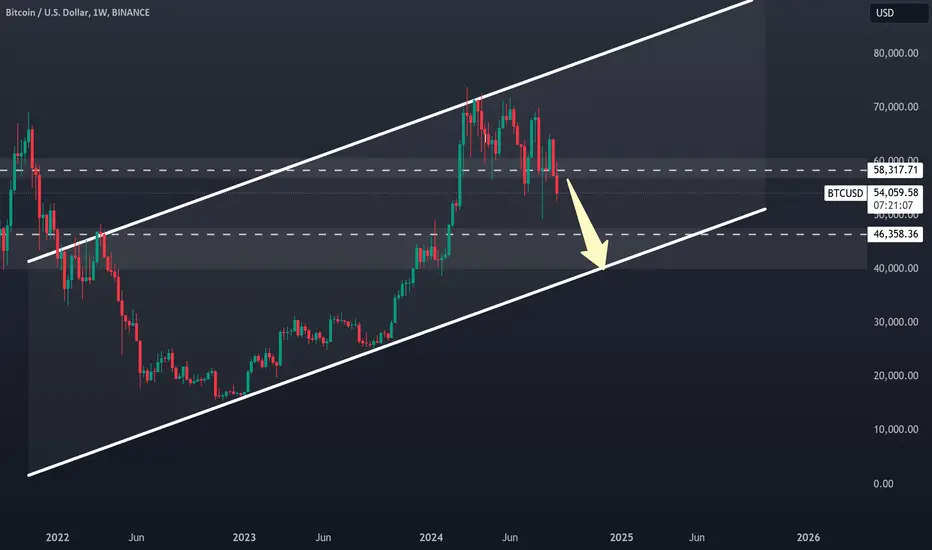
SELL BITCOINBitcoin correction to the downside is still not being done on the daily and weekly timeframes.
Next target is to the lower of the uptrend channel at area 39k - 40k before the next big up movement.
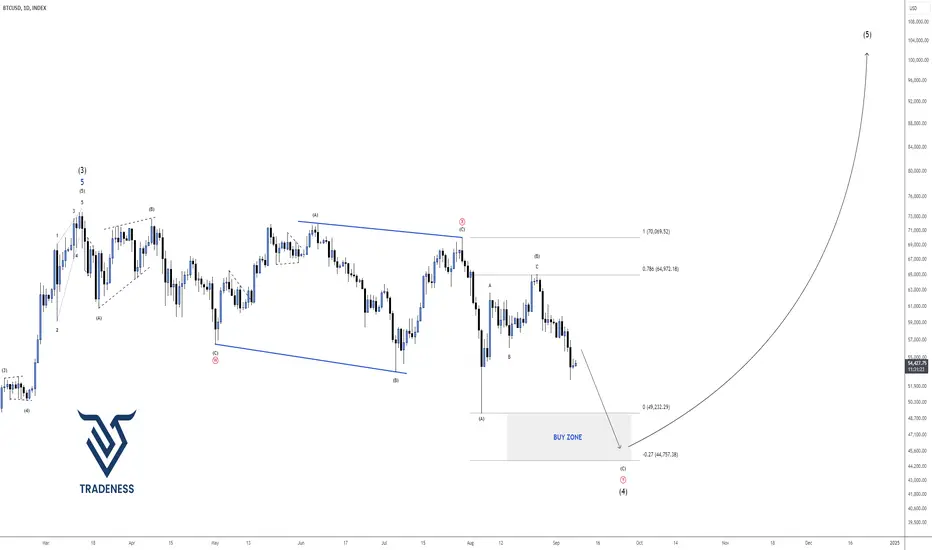
BITCOIN - BULL'S LAST CHANCE Bitcoin has been moving sideways for half a year creating a complex correction WXY( 3-3-3). Complex correction is made up of 3 waves were each wave is also made up of 3 waves ( in the form of ABC's ).
Wave W = Wave X = Wave Y = 3 waves
We are now in the last leg of wave Y. Expecting price to break the lows again and move upwards from our buy zone.
Looking for a strong bullish pressure at our buy zone. Will update the idea once we are there. But for now you can focus on selling targeting 49k level.
WXY Pattern
Goodluck and trade safe!
BTC Drops to 52K - What's Next? GM crypto bro's, happy weekend? 🗿 This morning, BTC has dropped to the 52K area 💀 — a reminder to always stay safe in the crypto market. Here's the update: the Fear and Greed Index is at 23 (Extreme Fear), and the Stochastic RSI has dived back into the oversold zone 🗿.
So, where is BTC headed? The potential pump still remains at the 60K - 61K range. However, given today's deep drop, there’s a probability BTC could break below 50K and, in the worst case, visit the 44K area.
Always hope for the best and prepare for the worst — let's hope BTC doesn’t dump to 44K 🗿. As always, maintain your risk, and that’s it for today's crypto update. This is Akki, signing off with one chart. Have a nice day!

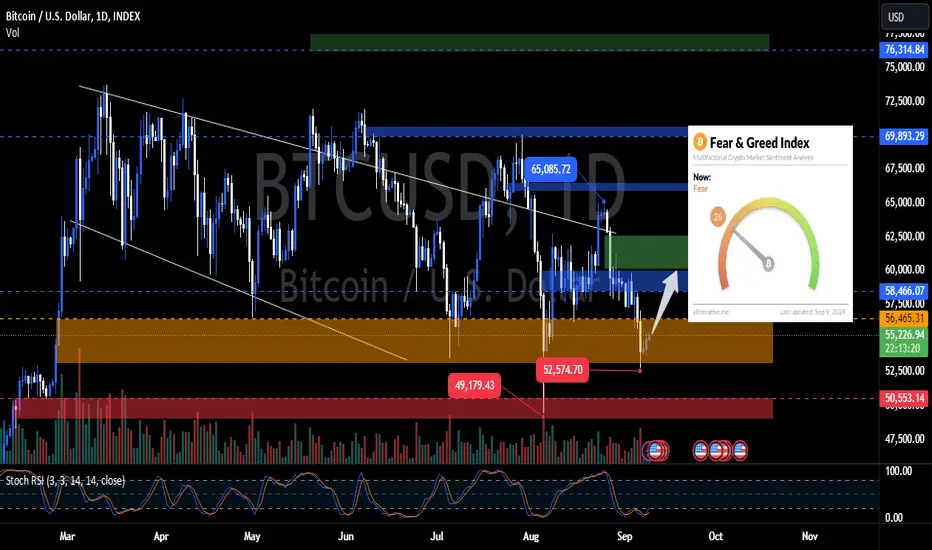
BITCOIN on the Sine Wave Buy Zone but won't last for long!Bitcoin (BTCUSD) may be under a quite strong short-term correction since the August 27 rejection on the 1D MA200 (orange trend-line) but based on this 2-year Cyclical Chart, it has high chances of finding Support again and start a rally similar to the two it had over this time span.
Let's start with the long-term outlook which remained bullish after BTC hit and rebounded (August 06) on the 1W MA50 (red trend-line), its long-term Support since March 13 2023. The formation of the 1D Death Cross may have offset some of this optimism but on this cyclical pattern it is not a bearish sign as last time it emerged (September 11 2023), Bitcoin formed its new bottom at the time.
In fact it was inside a short-term (dotted) Channel Up, the vessel pattern which took the price from the bottom to a new +100% rally. The key parameter was the fact that the 1D MA200 broke and later was retested and held as Support. This is most likely why we are having the recent pull-back, because even though the price broke above the 1D MA200, it failed to hold.
The 1D RSI also prints a similar pattern to the previous two bottom fractals on this chart and it appears that relative to those past sequences, we are currently after the first RSI peak and pull-back. On the price action, we illustrate the relative position of now and then with circles.
The Sine Waves do perhaps the most efficient depiction of the price cyclicality, clearly displaying where Bitcoin should be bought and where sold. At the moment we are just past the most optimal Buy Entry so it the opportunity still exists but may not last for long! Another +100% rise from August's recent bottom, will see Bitcoin test the psychological benchmark of $100k.
So what do you think? Is a new rally this close, potentially timed after the Fed cuts the rates in 2 weeks? Feel free to let us know in the comments section below!
-------------------------------------------------------------------------------
** Please LIKE 👍, FOLLOW ✅, SHARE 🙌 and COMMENT ✍ if you enjoy this idea! Also share your ideas and charts in the comments section below! This is best way to keep it relevant, support us, keep the content here free and allow the idea to reach as many people as possible. **
-------------------------------------------------------------------------------
💸💸💸💸💸💸
👇 👇 👇 👇 👇 👇

Long Setup on Bitcoin / Bulls or Bears, Tell me in CommentsBINANCE:BTCUSDT
COINBASE:BTCUSD
SL1 ---> Low-risk status: 3x-4x Leverage
SL2 ---> Mid-risk status: 5x-8x Leverage
👾The setup is active but expect the uncertain phase as well.
➡️Entry Area:
Yellow zone
⚡️TP:
59600
60330
61150
61800
62600
🔴SL:
55925
🧐The Alternate scenario:
If the price stabilizes below the trigger zone, the setup will be cancelled.

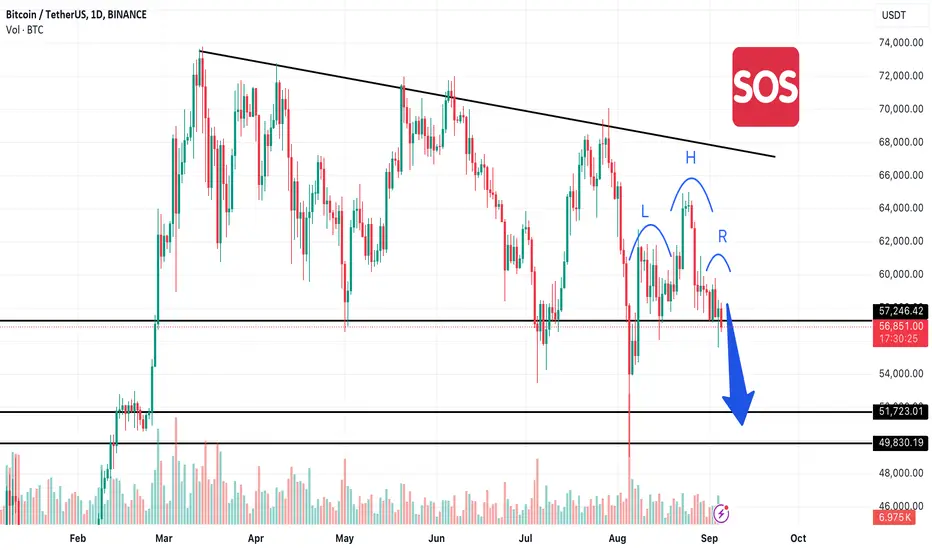
Bitcoin-Whales are Stop Hunting - Next Stop 50kWelcome back future demons
Let's jump right into the TA.
We have a potential short trade here. This might not qualify as the perfect example of a Head and Shoulder formation in Classical Charting, but the over all structure and pattern is bearish.
Also yesterday we saw a significant drop combined with huge volume increase.
Kind Regards
LaPlaces Demon
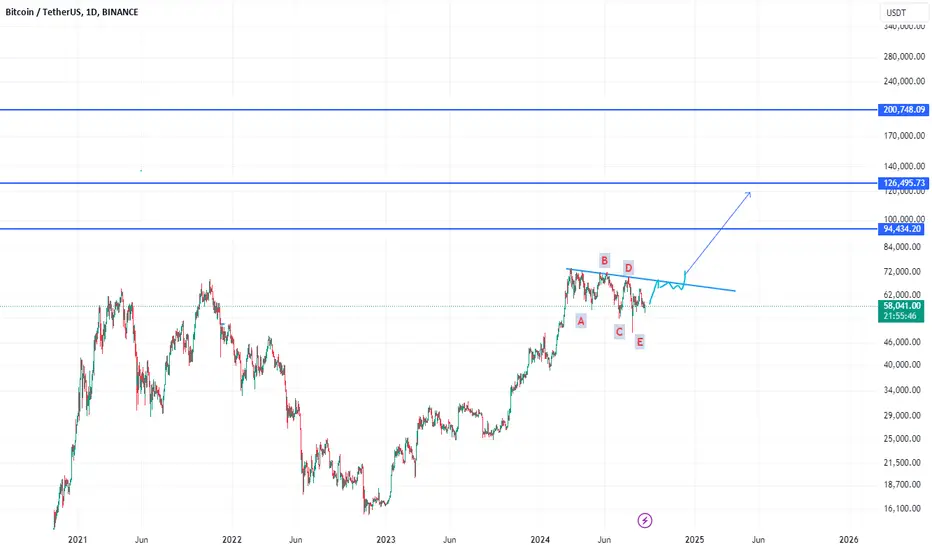
HUGE bullish confermation on BTC nasdaq had the same confermation before break the top of december 2021 , btc on accumulation and it's prepare for a big movement up ,
this boring movment and go up and down , it's just to make ppl disbleaf in this market and to let ppl sell thier coin , not all ppl will get rich .
don't be greedy . don't but your all eggs in one basket
this is my analyse it's not a recomandation to buy or sell !!
#bitcoin (cryptocurrency)
#btc
#bitcoin
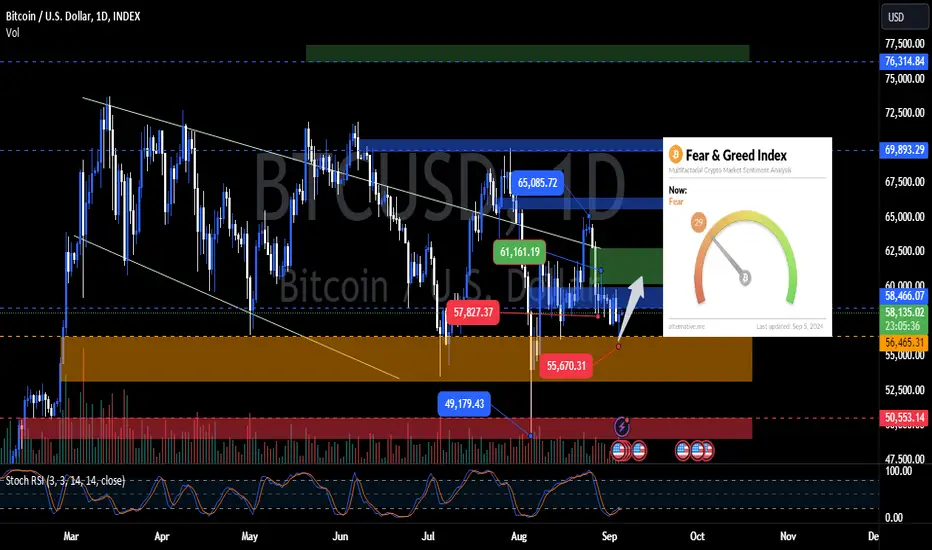
BTC Holding Steady in Fear ZoneGM crypto bro's! This morning, the Fear and Greed Index is at 29, still in the fear zone. The Stochastic RSI remains in the oversold area, same as yesterday.
In terms of price action, BTC's outlook today is similar to yesterday's market update. The closest potential pump target is between 60K - 61K, but be cautious—this doesn’t mean the dump is over.
So always keep in mind the market is dynamic—don’t get FOMO, stay safe, stay calm. Remember, anything can happen in the crypto market. Manage your risks, and that's all for today's crypto update. This is Akki, signing off with one chart. Have a nice day!
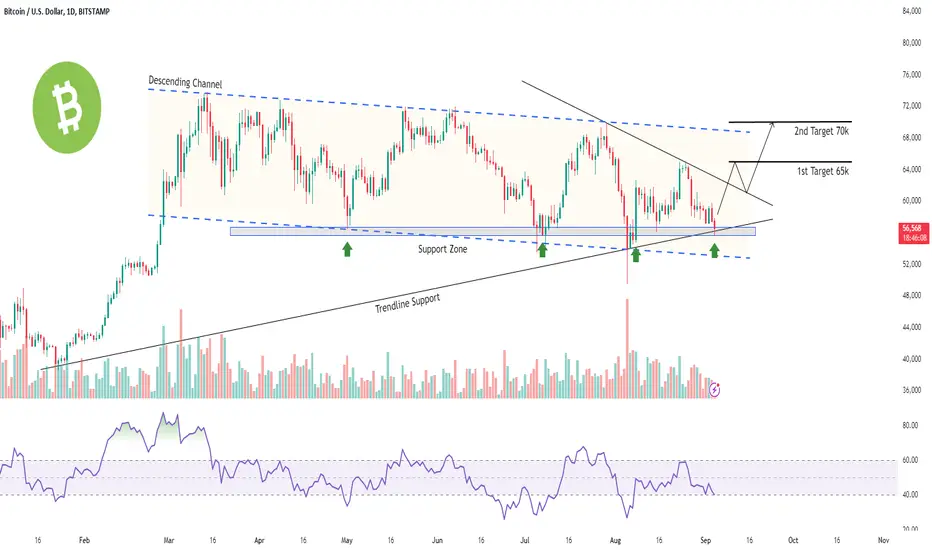
Bitcoin is at support, set for a short-term ascent!As Bitcoin travels through the descending parallel channel, it looks like it has finally secured support near 56k, a level it has relied on multiple times in the past.
We foresee a bullish movement from this point in the short term.
1st target - 65k
2nd target - 70k.
BTC Hits 55K: What's Next?GM crypto bro's! This morning, the Fear and Greed Index remains in the fear zone at 27, while the Stochastic RSI is showing signs of exiting the oversold area.
BTC has dropped to the 55K area, as I mentioned a few days ago. Where is it headed next? The current price action suggests a probability of reclaiming the 60K - 61K range as the nearest target.
Like always, keep in mind that the market is dynamic—don’t get FOMO, stay safe, stay calm. Remember, anything can happen in the crypto market. Manage your risks, and that's all for today's crypto update. This is Akki, signing off with one chart. Have a nice day!

BTC Shows Signs of Recovery!GM crypto bro's! This morning, BTC finally turned green and is back in the 59K area. Fear and Greed Index is at 26 (fear), and the Stochastic RSI is starting to show signs of a potential upward move.
Does this mean the 55K drop is off the table? Unfortunately, no—just that the probability has decreased. For now, the closest potential area for BTC to visit is the 60K - 61K range.
Remember, the market is dynamic; don't get FOMO, stay safe, stay calm—anything can happen in the crypto market. Manage your risks, and that's it for today's crypto update. This is Akki, signing off with one chart. Have a nice day!

BTC USD IdeaI'm unsure which direction BTC/USD will trend, but I've been analyzing order flow software in the live auction. Since last week, the 4-hour candles have shown volume in the millions, and the trend is extremely bullish. However, the market maker has been giving 8-hour rallies and then taking out buyers' stops. This pattern has been consistent since Thursday.
I haven’t opened any swing trades yet; instead, I've been scalping in and out. If the price remains bullish and I consider buying, I need to see a significant move down followed by a strong move up. This would indicate that traders have been trapped, and only then might I consider a swing trade. For now, there's no way I'm entering, as the price hasn't dropped to those discounted daily lows to offer a clean trade—this isn't a business where they just hand you easy trades like it's your birthday. They're in the brutal business of making serious money.
So, I'm waiting to see big moves after the holiday, and then we can make a plan. Enjoy Labor Day, and let’s keep hunting!

Bitcoin - Where It Should Be Is Correct.
Bitcoin - Where It Should Be Is Correct
Bitcoin hovering around this price range in a sideways channel for a long period of time is exactly where it should be in cycle where weak hands get bored and sell to strong hands.
Z-Score showing no signs of anywhere near an overheated market, Spot ETF's are still very underallocated, the RSI Halving 100, Weekly repeating the same sideways "boring" market we have always seen.
When this trend eventually ends the price flips to the upside in a very short period of time catching most of the market off guard. Until the flip happens which looks like it will happen before year end, any Bitcoin price under $100,000 is a gift.
Eyes on Bitcoin. its looking more and more like 2017 as the weeks go on.
