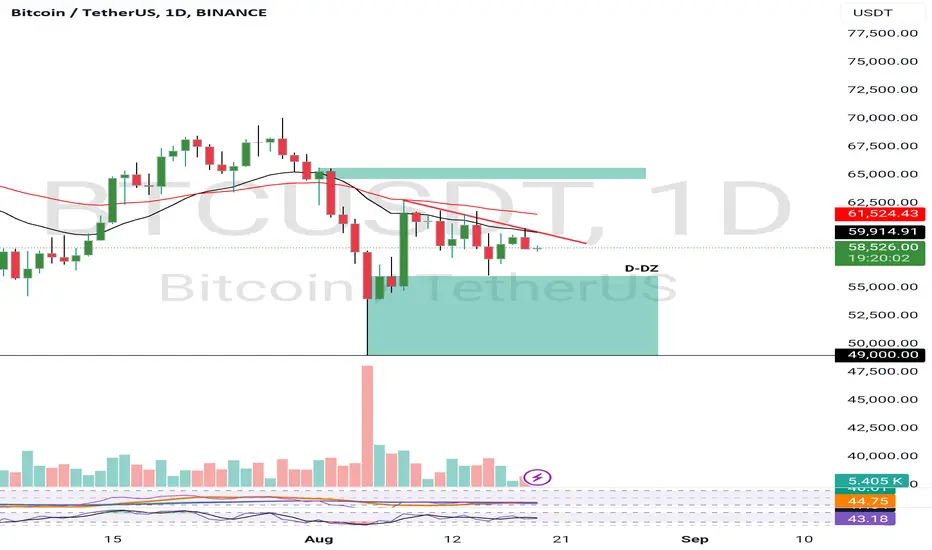
Bitcoin - Are you Bullish or Bearish?Bitcoin is still ranging since early this year, moving sharply in both directions to stop out early buyers & sellers.
What's your bias on BTC? Bullish towards $75,000 or Bearish towards $48,000?
Bitcoin-btcusd

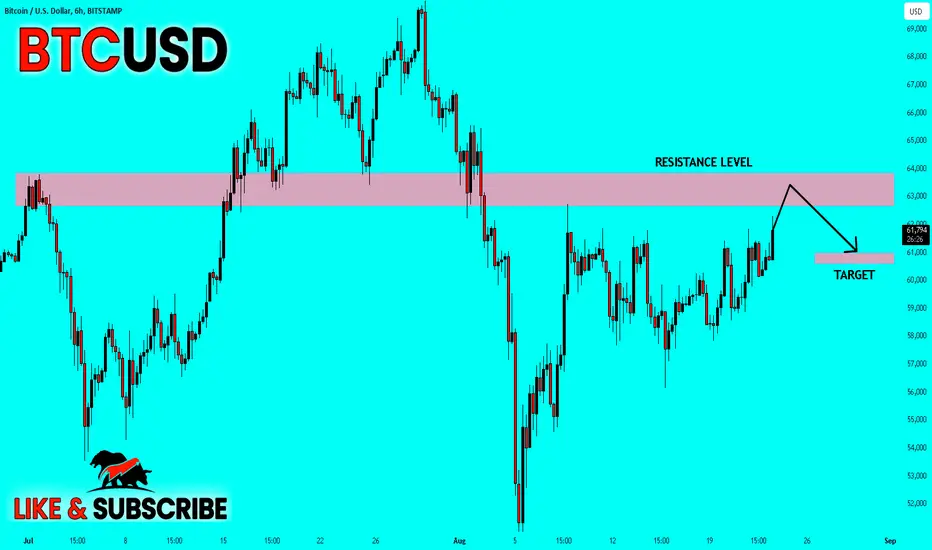
BITCOIN RESISTANCE AHEAD|SHORT|
✅BITCOIN is going up to retest a horizontal resistance of 64,000$
Which makes me locally bearish biased
And I think that we will see a pullback
And a move down from the level
Towards the target below at 61,000$
SHORT🔥
✅Like and subscribe to never miss a new idea!✅
Weak Dollar And Bullish Technicals Signal For Higher BitcoinAfter some initial recession fears spurred by the NFP report showing higher unemployment (4.3%) at the start of Avugust, stocks have bounced back up as last week’s retail sales data indicates the economy isn’t as bad as feared. CPI figures have also helped stabilize the markets, and with the FED potentially closer to cutting rates in September, the stock market may continue higher.
Now that stocks are back to bullish mode, we can see a strong risk-on sentiment that can push stocks even higher, while USDollar will most likely stay under bearish pressure along with US Yields, which can help Crypto market to stay in the bullish trend.
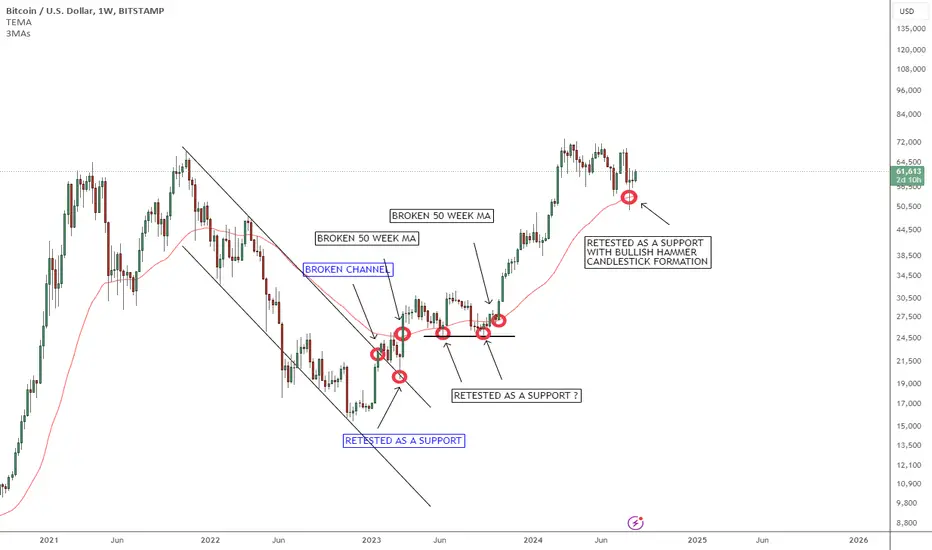
So this time we want to update an interesting weekly BITCOIN technical chart we have been tracking for the last two years. Notice that back in 2023, bitcoin broke out of a downtrend channel and then retested it as a support, followed by a rise above 50-week Moving Average, which interestingly, also held as a support. Since then price turned higher, and start forming some extended structures since the beginning of 2024.
Now in the second part of 2024 we got some slowdown after touching 80k, but it clearly looks like a corrective and sideways price movement within uptrend, that once again retested 50-week MA support, also with nice bullish hammer candlestick formation. That said, be aware of a bullish continuation into the end of 2024.
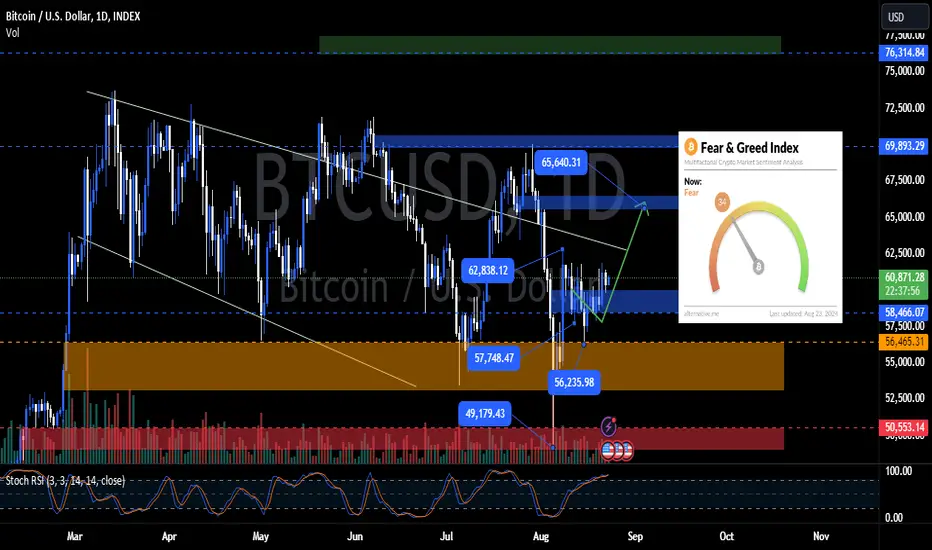
BTC on Track for 64K-65K: Low Volume Weekend Ahead?GM Crypto Bro's, happy Friday! This morning, the fear and greed index is at 34 (fear), and the stoch RSI remains in the overbought area, just like yesterday. Overall, BTC is still on track as per our market update yesterday, with the first target at 64K-65K.
The potential for a drop to 57K is still low for now, but as we approach the weekend, which tends to have low volume and corrections, keep in mind the market is dynamic—don’t get caught up in FOMO, stay safe, keep calm, and always remember that anything can happen in the crypto market.
Always manage your risks, and as always, that’s all for today’s crypto update. I’m Akki, signing off. Have a nice day.
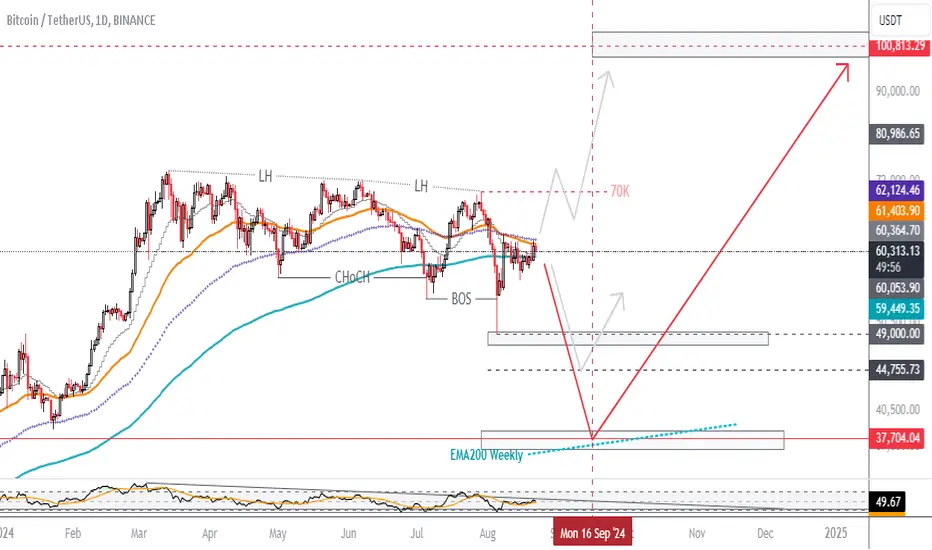
Bitcoin Update: Possible ScenariosBitcoin has been in consolidation mode for about 6 months, and now it's almost time to make a decisive move.
Considering the market structure, including the highs and lows, I expect BTC to make another low before heading towards a new ATH. We have two important main support levels at $44K and $37K, where the price could bounce back in case of a market crash in the upcoming month.
I find the scenario of support at $37K more probable than the other two scenarios:
a bounce back from the $44K level
or in a bullish scenario, breaking the last high at $70K to make new highs towards $100K
DYOR
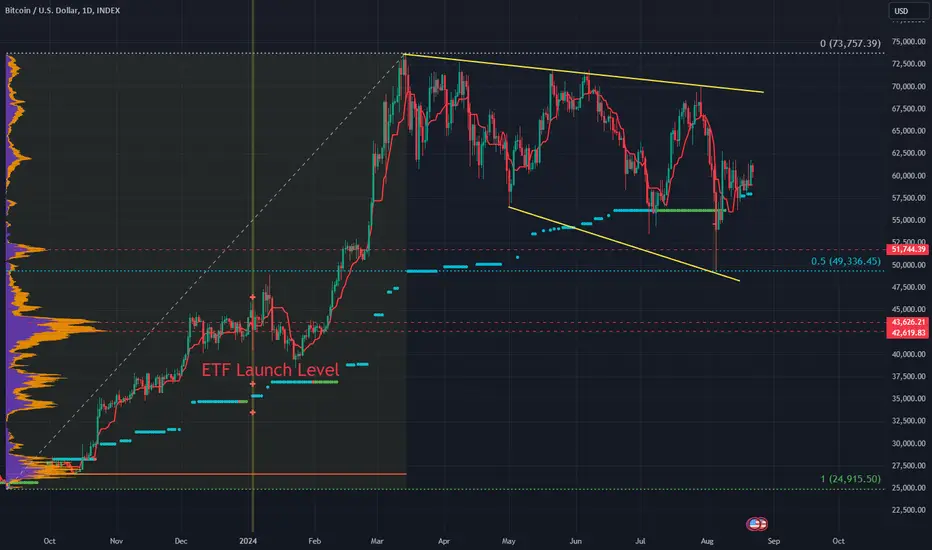
What will move Bitcoin?Let's take an honest look at Bitcoin in terms of price and fundamentals.
Every day I see a new article about "ETF inflows" or "Historical parabolic coming" but yet price stubbornly refuses to break bullish. Often I read the comments on these articles and users ask pertinent questions such as, "if everything in the media is so bullish then why is price stagnant?"
The reality is that the failure to break back in April/May on to the fabled 100k killed the bull trend. Very simple Technical Analysis reveals lower highs and lower lows, and the trend seems to be returning back to the ETF launch level of 40k's.
But there is an upcoming event many are speculating: a Fed Rate Cut.
While people may debate the magnitude of effect that low rates had on Bitcoin in 2020-2021 there is no doubt they were bullish for Bitcoin. So it is a proper assumption that a rate cut should have a bullish effect on Bitcoin (IF it happens). The speculation is that there will be a rate cut next month, September.
This sets up a clear Boolean indicator for Bitcoin. The key is to watch Bitcoin upon a rate cut. If Bitcoin responds BULLISH then that is the correct thing for price action to "make sense." However, if Bitcoin does not respond or even goes down... that means what should have happened did NOT and Bitcoin is definitely in a secular bearish trend.
BTC USD Daily trades// scalp setup long# hello TRADERS , hope you’re doing well
This our scalp setup for today no further analyses of the entry since this position is lower-timeframe Based
######### POSITION SETUP ########
recommended leverage: X5
ENTRY POINT :60374
SL:59666
TP:61870
### Not financial advice disclaimer ###
#You can use leverage at your own responsability and according to your risk management strategy
## remember to stay informed and make decisions based on your own research. always, trade with caution
## Do not forget to put Stop loss for your positions
Don’t forget to boost and support our Ideas to receive more Analysis
#Make sure you follow and activate the notification to catch the move instantly
If you have any questions, or any Coin to analyse you can write them in the comments section below.
#####We are using LEET ALGORITHMIC CONCEPT (LAC)
revolutionary new trading concept developed by LEET TRADERS COMMUNITY and based on the functioning of the most powerful HIGH frequency trading algorithms
very high accuracy, No psychological factor or stress, the only rule is to follow the steps straight to the target
Join US!!
********* WAKE-UP NEO =) follow the white rabbit********

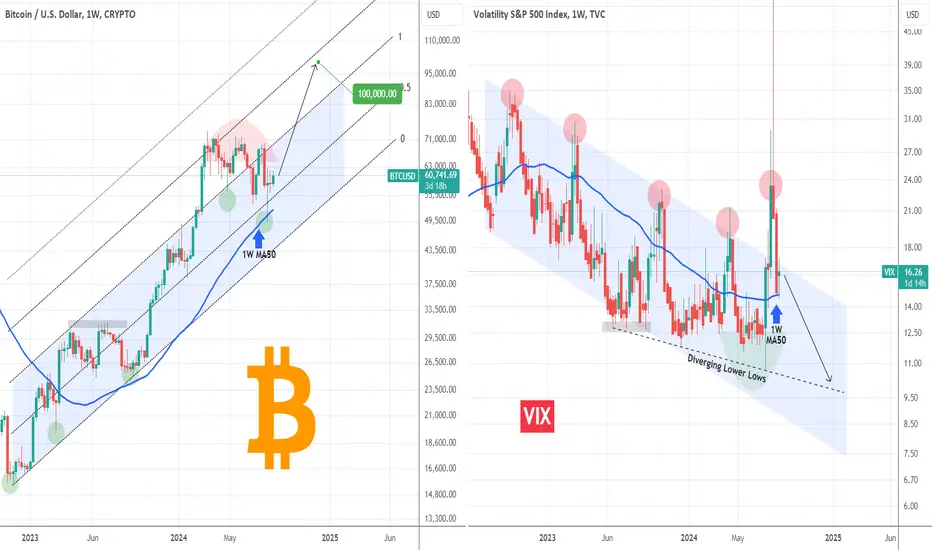
BITCOIN The Volatility Index is showing the way to 100kBitcoin (BTCUSD) undoubtedly shares a relationship with the Volatility Index (VIX), even though not 100% tight, being a speculative financial asset. Naturally the two are on a negative correlation, meaning that when volatility hits the market and VIX rises, BTC rises and vice versa, similar to what happens against stocks.
Following the massive volatility spike on the weeks of July 29 and August 05, VIX quickly corrected back to its 1W MA50 (blue trend-line), which has been its pivot line since the Channel Down started 2 years ago.
Bitcoin on the other hand is already significantly above its 1W MA50, as on the week of VIX's aggressive volatility, it managed to test it and held. Opposite to VIX, Bitcoin has been trading on an upward trend, illustrated on today's analysis by a Fibonacci Channel. Initially the 1.0 Fib has been its top but then when broken, it topped on the 1.5 Fib extension.
As a result, we expect that when VIX finally closes below its 1W MA50, it will seek its 1-year Support, the Diverging Lower Lows trend-line and that will propel Bitcoin to its 1.5 Fib extension again. If that takes place towards the end of the year, we expect $100k to have been reached.
Do you think this correlation model will materialize 100k for Bitcoin? Feel free to let us know in the comments section below!
-------------------------------------------------------------------------------
** Please LIKE 👍, FOLLOW ✅, SHARE 🙌 and COMMENT ✍ if you enjoy this idea! Also share your ideas and charts in the comments section below! This is best way to keep it relevant, support us, keep the content here free and allow the idea to reach as many people as possible. **
-------------------------------------------------------------------------------
💸💸💸💸💸💸
👇 👇 👇 👇 👇 👇
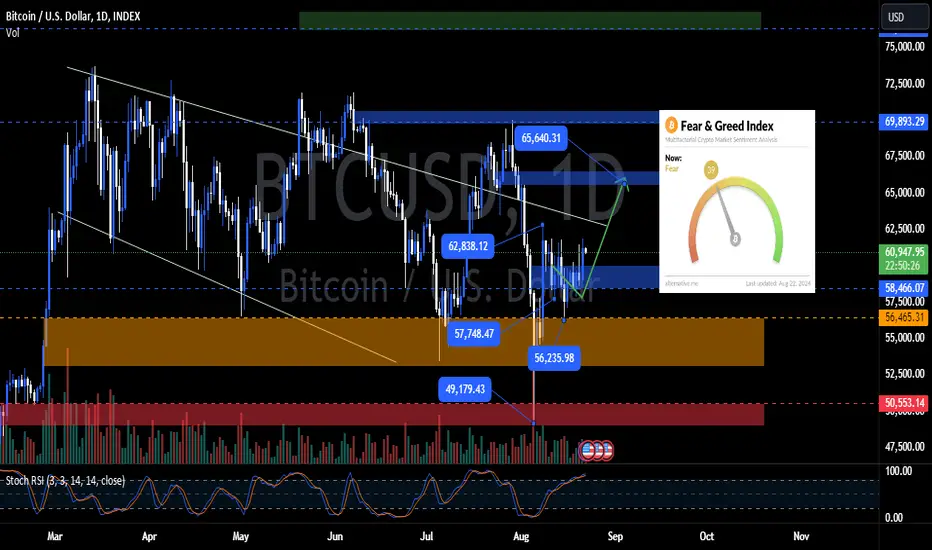
BTC Closes Above 60K: Next Stop 64K-65K?GM Crypto Bro's, this morning, the fear and greed index is at 39 (fear), and the stoch RSI is still in the overbought area. Finally, BTC managed to close a candle above 60K. The next big possibility is a move to the 64K-65K area.
However, this doesn’t mean the possibility of a correction to 57K-56K is gone. The chance is still there, but since BTC has now closed above 60K, the potential for a correction has decreased. But keep in mind, the market is dynamic—don’t get caught up in FOMO, stay safe, keep calm, and always remember that anything can happen in the crypto market.
Always manage your risks, and as always, that’s all for today’s crypto update. I’m Akki, signing off. Have a nice day.
BTC Fails to Close Above 60K: Deeper Correction Ahead?GM Crypto Bro's, this morning, the fear and greed index is at 26 (fear), and the stoch RSI is still in the overbought area. BTC's candle close on the 20th couldn't stay above 60K, so there's a big possibility we might see a deeper correction, maybe down to the 57K - 56K range.
The fear and greed index also dropped from 39 to 26, so overall, we might see BTC revisit our orange zone area.
But keep in mind, the market is dynamic—don’t get caught up in FOMO, stay safe, keep calm, and always remember that anything can happen in the crypto market.
Always manage your risks, and as always, that’s all for today’s crypto update. I’m Akki, signing off. Have a nice day.

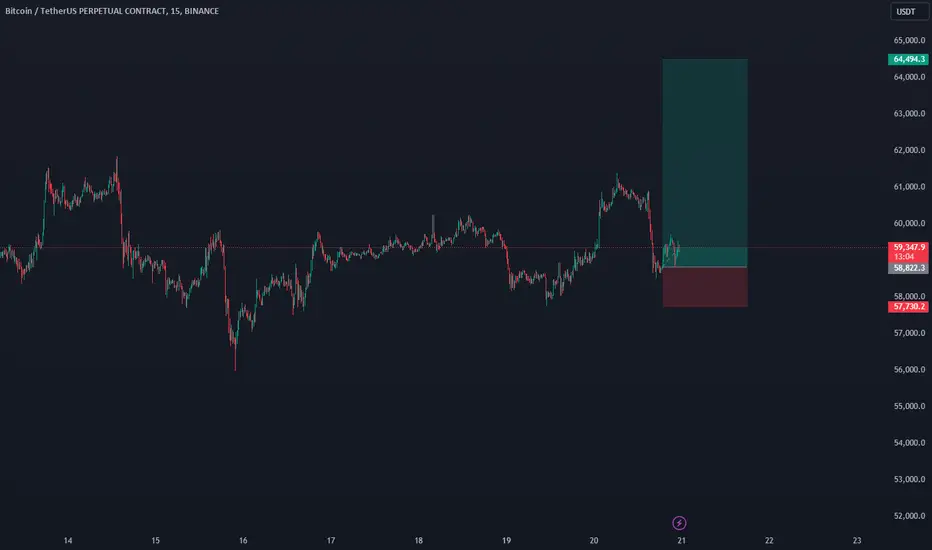
#BTCUSDT.P Daily trades//setup 1/5RR LONG X3 LEVERAGE# hello TRADERS , hope you’re doing well
This our TRADE setup for today no further analyses of the entry since this position is lower-timeframe Based
######### POSITION SETUP ########
recommended leverage: X3
ENTRY POINT :58822
SL: 57730
TP:64500
### Not financial advice disclaimer ###
#You can use leverage at your own responsability and according to your risk management strategy
## remember to stay informed and make decisions based on your own research. always, trade with caution
## Do not forget to put Stop loss for your positions
Don’t forget to boost and support our Ideas to receive more Analysis
#Make sure you follow and activate the notification to catch the move instantly
If you have any questions, or any Coin to analyse you can write them in the comments section below.
#####We are using LEET ALGORITHMIC CONCEPT (LAC)
revolutionary new trading concept developed by LEET TRADERS COMMUNITY and based on the functioning of the most powerful HIGH frequency trading algorithms
very high accuracy, No psychological factor or stress, the only rule is to follow the steps straight to the target
Join US!!
********* WAKE-UP NEO =) follow the white rabbit********
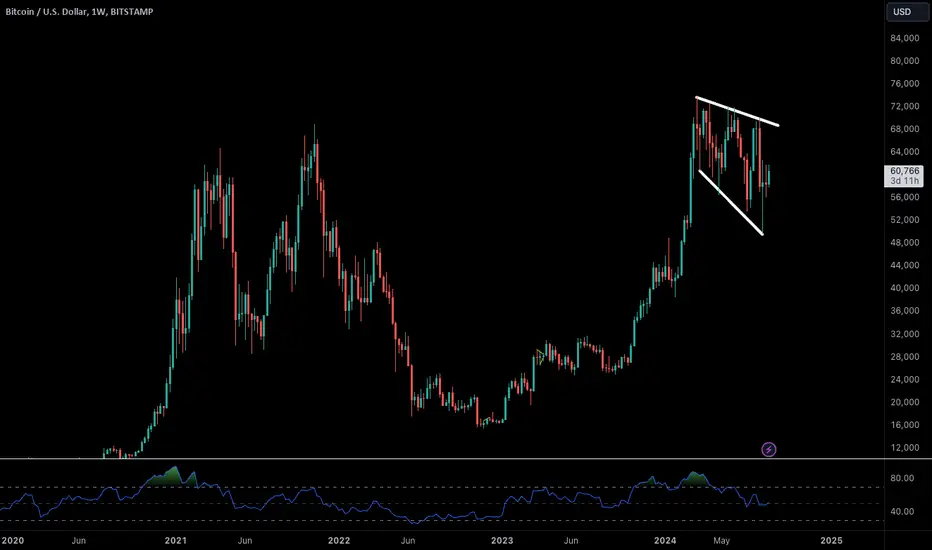
bITCOIN mADE gOOD cONSOLIDATION bEFORE bREAKOUT! watch out..Hi..
Just want to update my view on Bitcoin today..
This morning Bitcoin made 2 important touch on it's consolidation area (the triangle).. First touch this morning was the false breakout to the upside, then right after that false break, price went down and touch the lower base of the triangle.
The triangle itself going narrow and narrow, and it will determine where will the price goes next.
I have two possible scenario for now.. (you can have a look on the chart), one is BTC is consolidate a liitle more on the triangle before take off to the target (see TARGET 1 and TARGET 2 on chart), or it would break the lower trendline and goes to next fibo level 61.8% before it goes up.
I don't think there are any other scenario for now.. good luck everyone!
CHEERS!

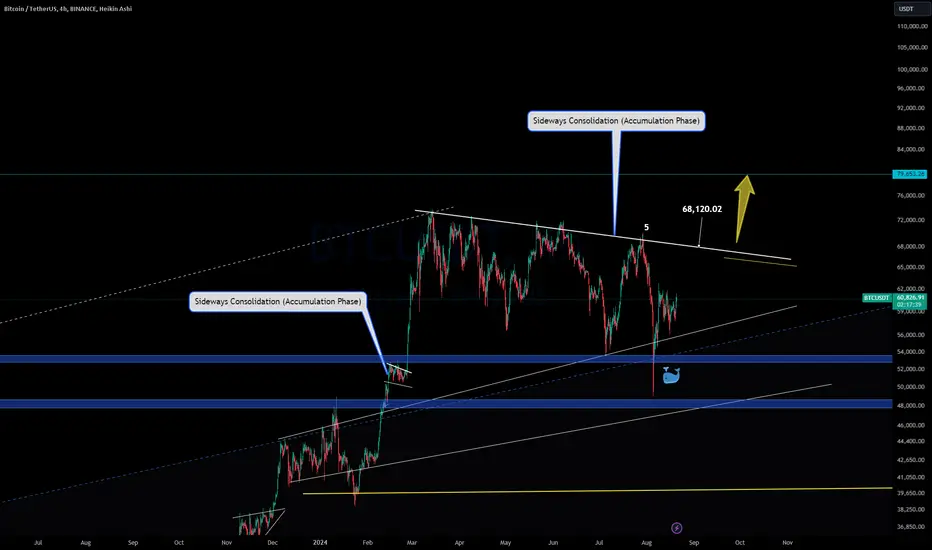
Bitcoin's Accumulation Phase Signals Breakout Potential🤖🚀 Bitcoin's Next Move: Accumulation Phase Signals Breakout Potential! 💡🌐
Hey everyone, it’s been a while since Bitcoin has been moving sideways, consolidating in a classic accumulation phase. We’ve seen buyers and sellers taking their positions, and the anticipation is building for Bitcoin to make a significant move. The big question is: will Bitcoin break higher, or is there still a chance to buy at lower levels?
From mid-March until now, BTC has been consolidating, and according to my book, whales might be looking for another opportunity to buy in the GETTEX:48K to $53K range—a zone that was recently tested earlier this month. Particularly, on Monday, August 5th, we saw a dip where liquidity was quickly absorbed between GETTEX:49K and $53.5K. During that week, the whales took advantage and feasted on over-leveraged traders, reinforcing the importance of staying cautious with leverage.
So, what’s next? Could we see a push towards $68K and then $79K, or will the whales trigger another shakeout below the $56K mark? The market is at a critical point, and the next few weeks could be decisive.
What do you think? Will Bitcoin break out, or is there more accumulation ahead? Let me know your thoughts in the comments below!
One Love,
The FXPROFESSOR 💙
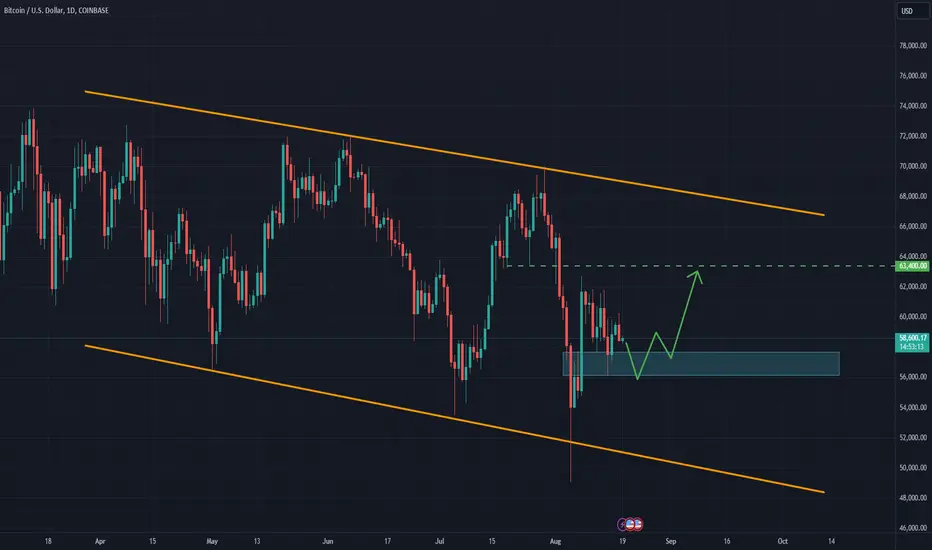
Bitcoin Contracting before ExplodingBTCUSD has seen a solid rebound off a crucial support level, successfully capturing liquidity at the previous month's low. Over the past week, the daily chart displayed choppy price action, leading to a period of consolidation within a tight range. Notably, the weekly timeframe has formed an inside bar pattern, signalling potential indecision among traders. A break and close above 63,000 could provide a strong bullish signal, potentially driving the market toward the next resistance level at 73,000. The upward momentum could persist, especially if the market rejects the prior week's low. On the 1H timeframe, a classic triangle pattern is unfolding, suggesting the price may continue oscillating within this structure before making a decisive move. The target is the resistance zone at 63,400
Bitcoin looking good aug 18 2024Bitcoin is looking very good to breakout. So you can manage your risk and go long. I am going long in this for sure. Dont forget to put stops & manage your quantities.
NOTE: BTC CAN BREAKOUT