BITCOIN Risky Long! Buy!
Hello,Traders!
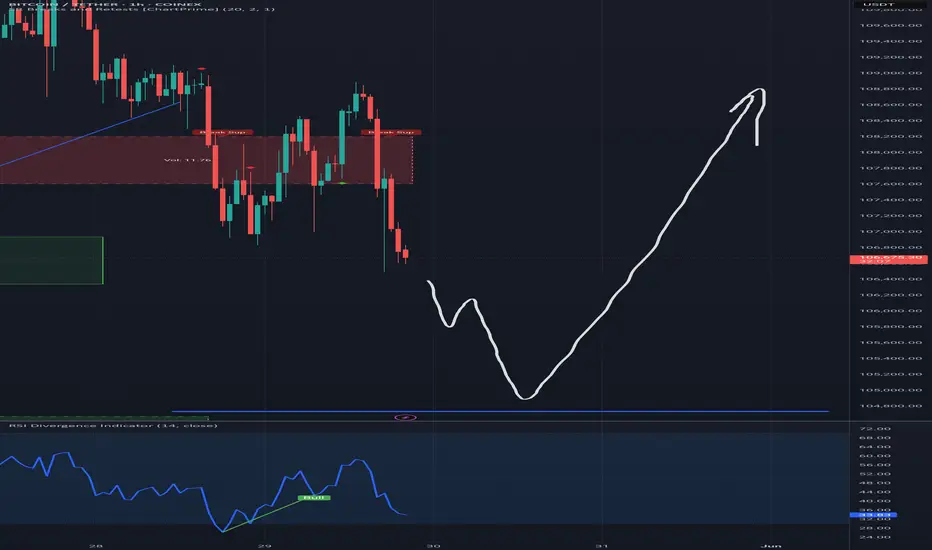
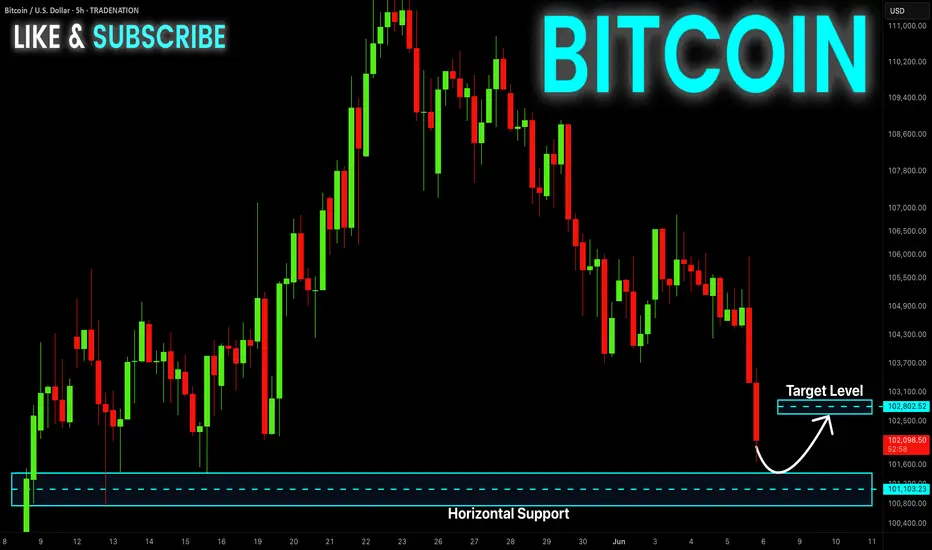
BITCOIN keeps falling down
And the coin is almost 9%
Down from the recent highs
So BTC is oversold and
After it hits a horizontal
Support of 100,800$
We will be expecting a
Local rebound and a move up
Buy!
Comment and subscribe to help us grow!
Check out other forecasts below too!
Disclosure: I am part of Trade Nation's Influencer program and receive a monthly fee for using their TradingView charts in my analysis.
Bitcoin-btcusd
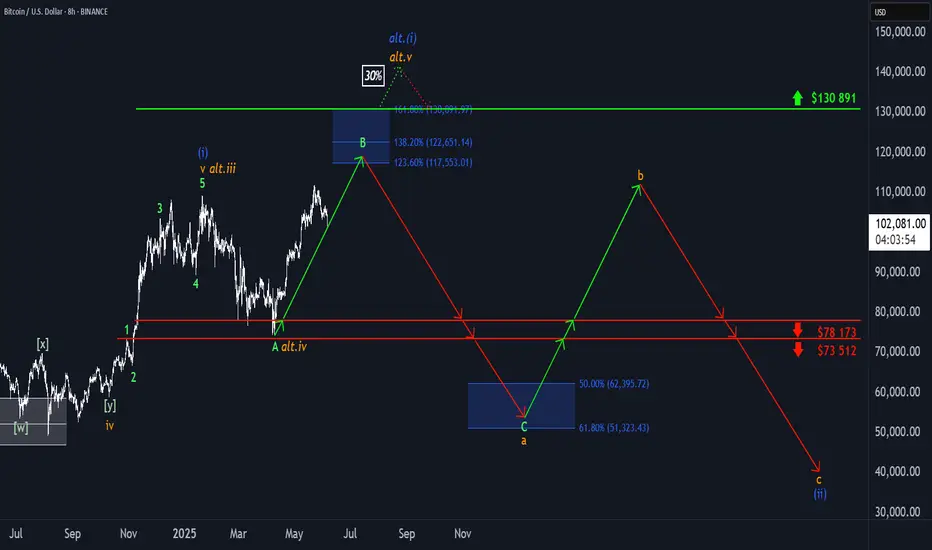
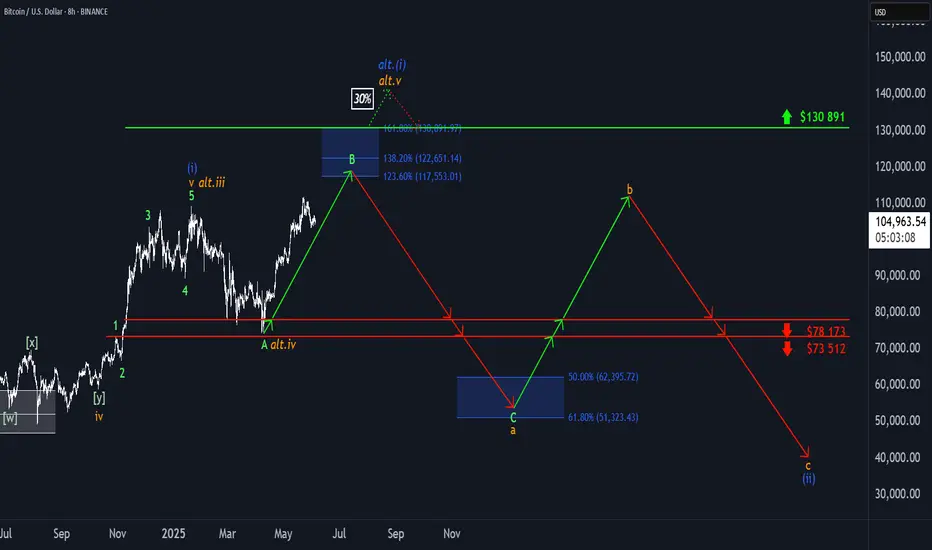
BTC: Facing Resistance?Bitcoin recently encountered renewed selling pressure, stalling the anticipated continuation of green wave B. Under the primary scenario, this corrective upward movement should still extend into the upper blue Target Zone between $117,553 and $130,891, where the price is expected to reverse and initiate green wave C. That move should complete with a low in the lower blue Target Zone between $62,395 and $51,323, thereby finalizing orange wave a. Following a corrective advance in wave b, the larger wave (ii) should reach its conclusion. There remains a 30% probability for the alternative scenario, in which BTC pushes above the upper blue Target Zone, establishing a new high in blue wave alt.(i)— which would delay the expected pullback.
📈 Over 190 precise analyses, clear entry points, and defined Target Zones - that's what we do.
BITCOIN under brutal 4H squeeze. Buyers or sellers will prevail?Bitcoin (BTCUSD) is currently under the strongest squeeze we've seen this year as it's being compressed between the 4H MA50 (blue trend-line) and 4H MA200 (orange trend-line). Such tight price action usual precedes explosive moves.
Technically two patterns prevail: a long-term Channel Up and a short-term Head and Shoulders (H&S). Naturally, as long as the Channel Up holds (and is still valid), the pattern will attempt to push the price to he 2.0 Fibonacci extension at $121500 (and higher). If on the other hand it breaks (4H MA200 would be an early signal), the H&S may push the price to the -1.0 Fibonacci extension at $95000.
So what do you think? Which pattern will prevail? Feel free to let us know in the comments section below!
-------------------------------------------------------------------------------
** Please LIKE 👍, FOLLOW ✅, SHARE 🙌 and COMMENT ✍ if you enjoy this idea! Also share your ideas and charts in the comments section below! This is best way to keep it relevant, support us, keep the content here free and allow the idea to reach as many people as possible. **
-------------------------------------------------------------------------------
💸💸💸💸💸💸
👇 👇 👇 👇 👇 👇

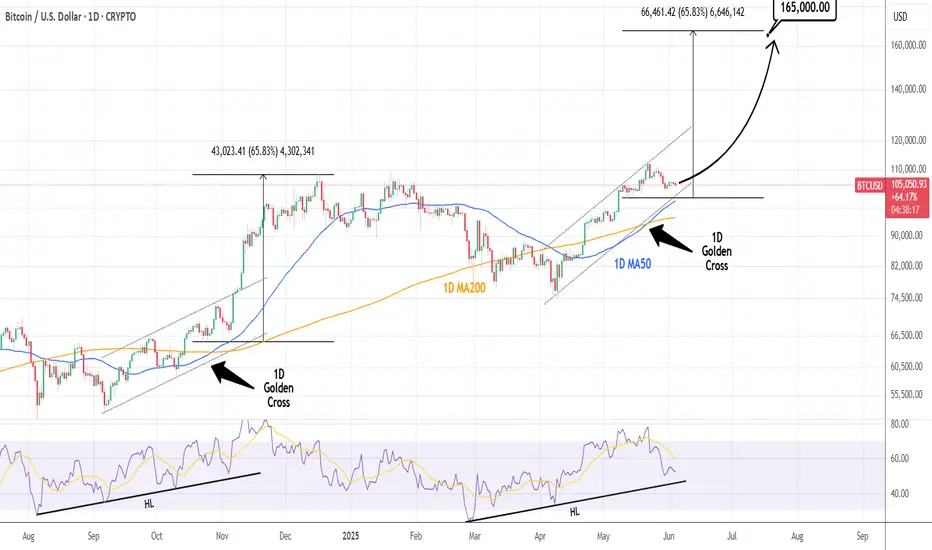
BTCUSD: Consolidation is about to be over.Bitcoin remains neutral on its 1D technical outlook (RSI = 52.429, MACD = 1547.600, ADX = 23.123) as so far it is failing to stage a proper breakout from the consolidation of the last few days. Based on the long term comparison with the previous Channel Up at the time of the 1D Golden Cross, the consolidation could be over soon, resembling November 4th 2024. As long as the 1D MA50 holds, stay bullish, TP = 165,000.
## If you like our free content follow our profile to get more daily ideas. ##
## Comments and likes are greatly appreciated. ##
BTC: Maintaining Strength Bitcoin continues to hover around the $105,000 level. In line with the primary scenario, we expect the advance in green wave B to extend toward the upper blue Target Zone between $117,553 and $130,891. This zone can be used to lock in partial gains or establish hedges via short positions. From there, a corrective wave C is likely to follow, driving prices lower into the blue Target Zone between $62,395 and $51,323 — marking the end of the larger wave a. A corrective bounce should unfold next, ahead of the final selloff completing blue wave (ii). The alternative scenario, with a 30% probability, envisions a breakout above $130,891 and the establishment of a new high as part of blue wave alt.(i).
📈 Over 190 precise analyses, clear entry points, and defined Target Zones - that's what we do.
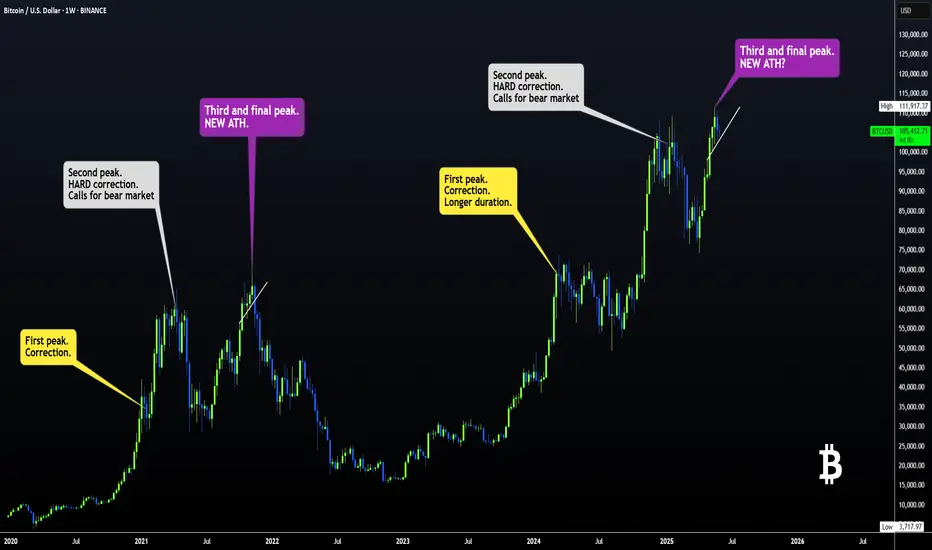
BTC FRACTAL : Has BTC been following THIS EXACT PATTERN?The only difference in terms of the first peak, is the duration. But even the pullback size has been similar:
Interestingly, in terms of the second peak, the increase from the corrective bottom to the new ATH is almost exact at 122%:
Here's why we MAY still have a small push upward:
- The previous time, the peak was at least 6% higher. Currently, that would put us around 116K.
- The current pennant pattern is different from the previous bearish flag.
2%:
Pattern:
Do you think the bearish cycle is starting, or is another push up likely?
___________________
BINANCE:BTCUSD
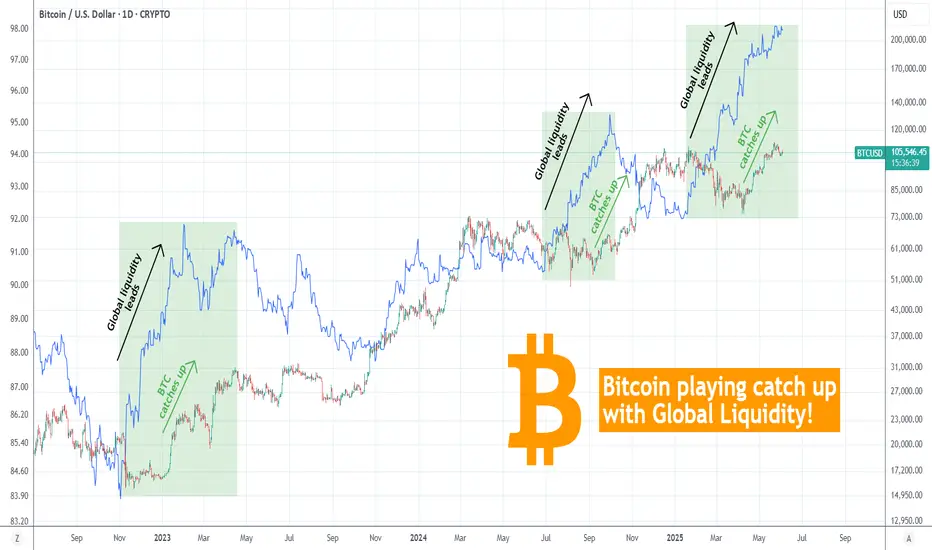
BITCOIN Will it catch up to the rising Global Liquidity again?Bitcoin (BTCUSD) is attempting to stage yet another short-term rally on its Tariff War recovery Bullish Leg but the picture is even more interesting on the long-term.
This is a simple yet very powerful and explanatory chart where it shows that every time the Global Liquidity (blue trend-line) led the uptrend and started rising before BTC on this Bull Cycle (since the November 2022 bottom), BTC eventually caught up to the trend and closed the Gap.
This time Global Liquidity has been rising since the start of the year (early January) while Bitcoin only started to do so since April 07. Even if the Global Liquidity pauses here, Bitcoin still has the potential to continue rising irrespectively.
How high do you think this can go? Feel free to let us know in the comments section below!
-------------------------------------------------------------------------------
** Please LIKE 👍, FOLLOW ✅, SHARE 🙌 and COMMENT ✍ if you enjoy this idea! Also share your ideas and charts in the comments section below! This is best way to keep it relevant, support us, keep the content here free and allow the idea to reach as many people as possible. **
-------------------------------------------------------------------------------
💸💸💸💸💸💸
👇 👇 👇 👇 👇 👇
BITCOIN Is this even a possibility?Bitcoin (BTCUSD) is currently on a short-term pull-back, following the impressive rally to new All Time Highs (ATH) from the April 07 bottom. This first 'serious' short-term relief correction has stopped on the former Lower Highs trend-line, which previous acted as a Resistance and is now holding the price from further downfall, acting potentially as Support.
This is the exact same price action that BTC had during its break-out from the previous Lower Highs trend-line last October. The symmetry between the two fractals is remarkable as not only did they both form their 1D Death Cross patterns on their bottoms and their 1D Golden Cross patterns on the Lower Highs break-out but also their Phase 1 rallies (1st Bullish Leg) have been exactly the same: +49.58%.
As a result, as long as the Pivot holds, there is a good chance we see a strong rebound, which if it holds the same total symmetry of the previous fractal, it should peak at +120%, which gives a $164000 Target.
Do you think that's even a possibility? Feel free to let us know in the comments section below!
-------------------------------------------------------------------------------
** Please LIKE 👍, FOLLOW ✅, SHARE 🙌 and COMMENT ✍ if you enjoy this idea! Also share your ideas and charts in the comments section below! This is best way to keep it relevant, support us, keep the content here free and allow the idea to reach as many people as possible. **
-------------------------------------------------------------------------------
💸💸💸💸💸💸
👇 👇 👇 👇 👇 👇

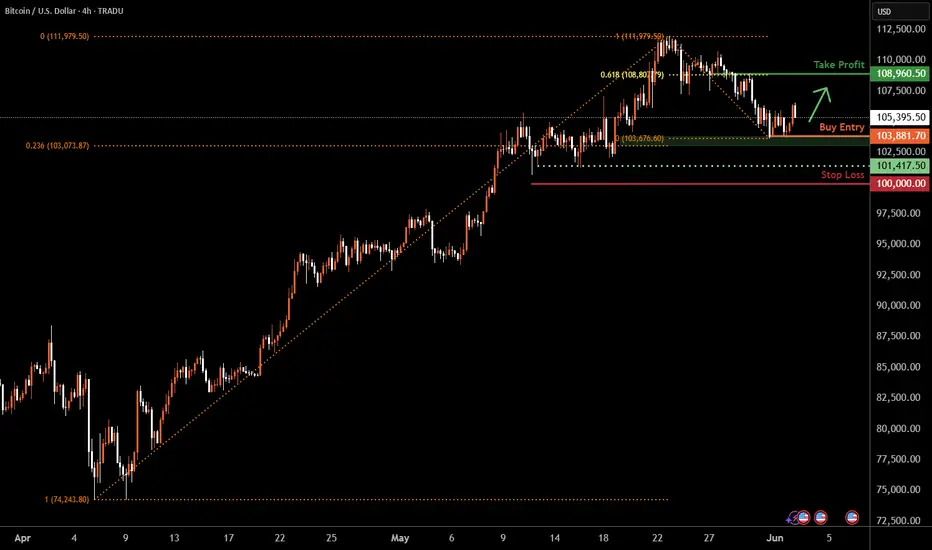
Bitcoin H4 | Potential bullish reversal?Bitcoin (BTC/USD) is falling towards a multi-swing-low support and could potentially bounce off this level to climb higher.
Buy entry is at 103,881.70 which is a multi-swing-low support that aligns close to the 23.6% Fibonacci retracement.
Stop loss is at 100,000.00 which is a level that lies underneath a multi-swing-low support.
Take profit is at 108,960.50 which is an overlap resistance that aligns with the 61.8% Fibonacci retracement.
High Risk Investment Warning
Trading Forex/CFDs on margin carries a high level of risk and may not be suitable for all investors. Leverage can work against you.
Stratos Markets Limited (tradu.com ):
CFDs are complex instruments and come with a high risk of losing money rapidly due to leverage. 63% of retail investor accounts lose money when trading CFDs with this provider. You should consider whether you understand how CFDs work and whether you can afford to take the high risk of losing your money.
Stratos Europe Ltd (tradu.com ):
CFDs are complex instruments and come with a high risk of losing money rapidly due to leverage. 63% of retail investor accounts lose money when trading CFDs with this provider. You should consider whether you understand how CFDs work and whether you can afford to take the high risk of losing your money.
Stratos Global LLC (tradu.com ):
Losses can exceed deposits.
Please be advised that the information presented on TradingView is provided to Tradu (‘Company’, ‘we’) by a third-party provider (‘TFA Global Pte Ltd’). Please be reminded that you are solely responsible for the trading decisions on your account. There is a very high degree of risk involved in trading. Any information and/or content is intended entirely for research, educational and informational purposes only and does not constitute investment or consultation advice or investment strategy. The information is not tailored to the investment needs of any specific person and therefore does not involve a consideration of any of the investment objectives, financial situation or needs of any viewer that may receive it. Kindly also note that past performance is not a reliable indicator of future results. Actual results may differ materially from those anticipated in forward-looking or past performance statements. We assume no liability as to the accuracy or completeness of any of the information and/or content provided herein and the Company cannot be held responsible for any omission, mistake nor for any loss or damage including without limitation to any loss of profit which may arise from reliance on any information supplied by TFA Global Pte Ltd.
The speaker(s) is neither an employee, agent nor representative of Tradu and is therefore acting independently. The opinions given are their own, constitute general market commentary, and do not constitute the opinion or advice of Tradu or any form of personal or investment advice. Tradu neither endorses nor guarantees offerings of third-party speakers, nor is Tradu responsible for the content, veracity or opinions of third-party speakers, presenters or participants.
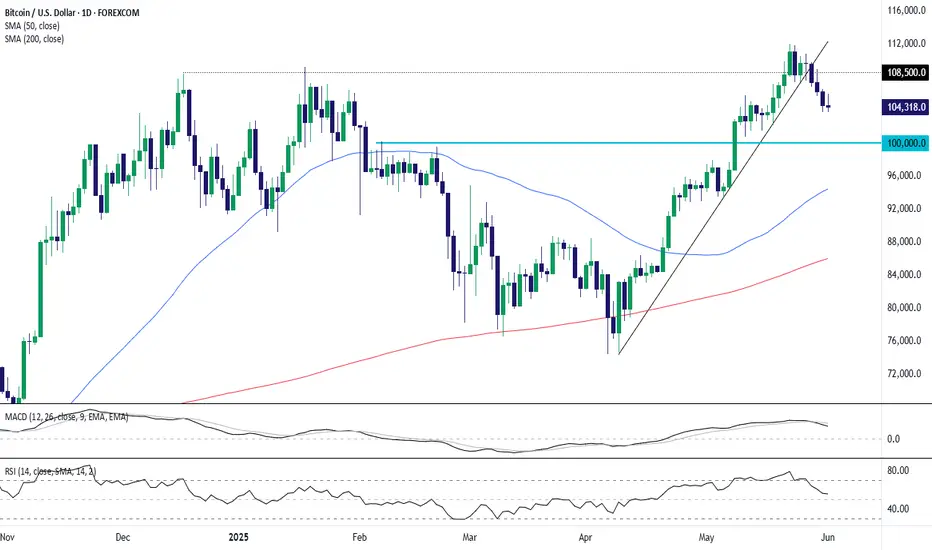
Bitcoin Reverses from Resistance, Eyes $100K SupportBitcoin's rally stalled at the $108,500 resistance level, with prices now pulling back and breaking below the steep uptrend line. The MACD is crossing lower and RSI is falling toward neutral, indicating momentum may be shifting. With the 50-day moving average near $94,400 and horizontal support around $100,000, traders may look for signs of stabilization in that zone before reassessing trend continuation.
-MW
BTC: Slowing DownBitcoin managed to stabilize over the weekend after its recent slide, nudging slightly higher from local lows. We continue to expect the current rebound—interpreted as wave B—to stretch into the blue Target Zone between $117,553 and $130,891. Once that move tops out, the next leg lower should follow, with wave C driving the price into the lower blue zone between $62,395 and $51,323. That would likely complete wave a in orange and pave the way for a temporary recovery before wave b rolls over into the final drop of wave (ii). The alternative scenario, which we’re still assigning a 30% probability, assumes Bitcoin is already in wave alt.(i) in blue—a more bullish path that would extend the rally well beyond $130,891 without another major correction first.
📈 Over 190 precise analyses, clear entry points, and defined Target Zones - that's what we do.

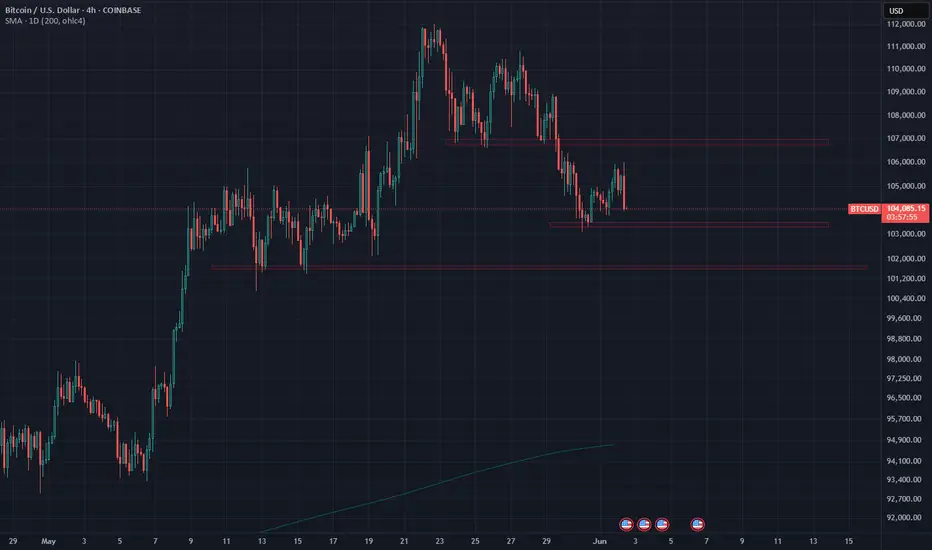
Bitcoin: What's next?BTC has lost local support around $107k and currently testing previous resistance around $104k.
If buyers are able to step in between $100k - $104k and reclaim $107k, it will signal strength.
If BTC experiences continued weakness, losing $100k as support, I would expect price to test the $95k - $97k region or 1D 200MA before signaling a reversal.
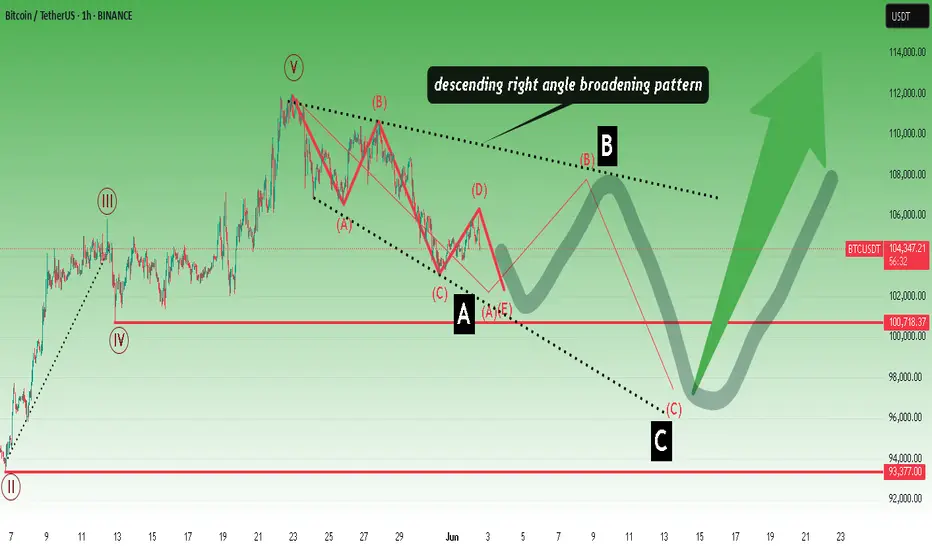
Descending right angle broadening pattern.Descending right angle broadening pattern and ABC correction waves after 5.wave.
* The purpose of my graphic drawings is purely educational.
* What i write here is not an investment advice. Please do your own research before investing in any asset.
* Never take my personal opinions as investment advice, you may lose your money.
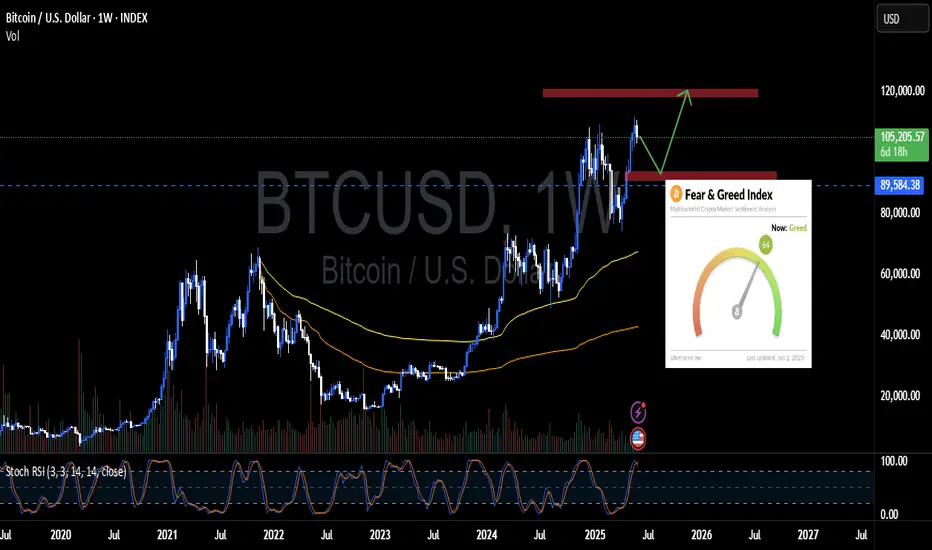
Bitcoin Weekly Outlook – June 2, 2025
Bitcoin ( BINANCE:BTCUSDT ) is holding strong above the psychological $100K mark, maintaining its bullish market structure on the weekly timeframe. However, technical indicators are flashing early signs of a possible short-term correction before another leg up.
🔍 Technical Analysis:
Current price: $105.1K
Key support zone: $89K (strong demand area + weekly structure retest)
Resistance to watch: $120K (major weekly supply zone + psychological level)
Stochastic RSI is currently overbought at 94+, which historically tends to trigger a healthy retracement before further upside continuation.
📊 Market Structure:
BTC remains well above the 200-week EMA, keeping bullish momentum intact
Higher Highs and Higher Lows are still in play
Volume is steady, showing no major distribution at the moment
📈 Sentiment Check:
Fear & Greed Index: 64 (Greed)
→ Suggests bullish sentiment is high
→ Greed often precedes short-term pullbacks or consolidation
🧭 Outlook:
A short-term correction toward the $89K–$92K zone is likely, as part of a healthy market cycle.
If support holds, BTC could rally back up with a mid-term target around $120K.
✅ Summary:
🔵 Bullish structure still intact
⚠️ Overbought signal = possible retracement
🎯 Mid-term target: $120K
🧘♂️ Don’t chase — wait for price to breathe, not break
Let the market come to you. Trade smart, not just hopeful.
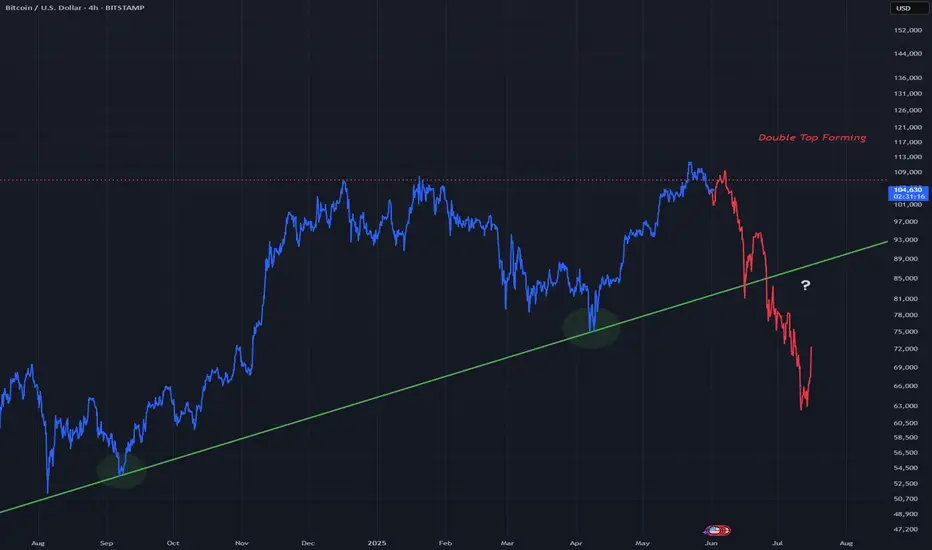
BTCUSD - Bear Double Top ScenarioBitcoin is still above the ascending trend line in green however price is looking to form a next high reaching new ATH's
This could lead to resistance at the next top creating a double top, pushing price back down to the ascending trend line. From there if this strong trend line in green breaks it could turn very bearish below that line.
4Hr chart
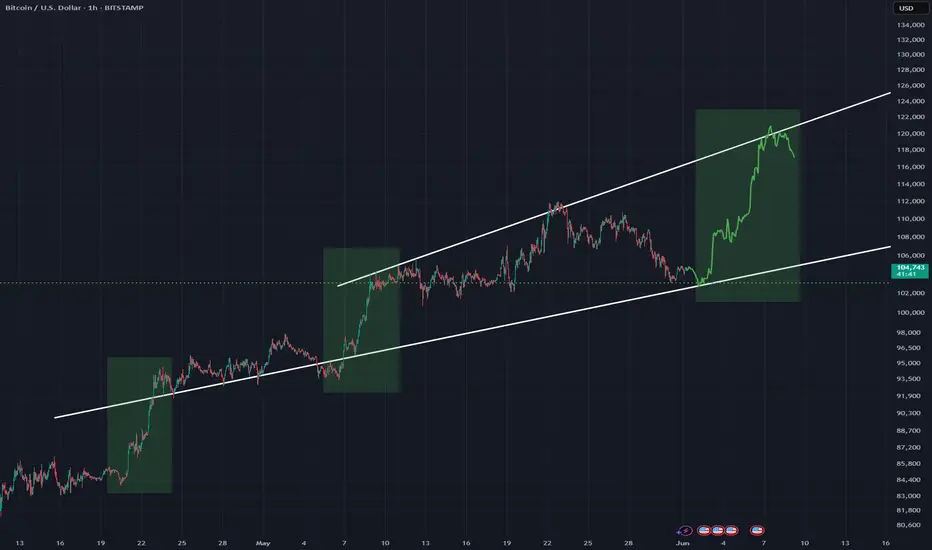
Bullish View #BTC Looking for a third strong wave up within this expanding pattern as price hits support in white
Moves up in green rectangles are similar
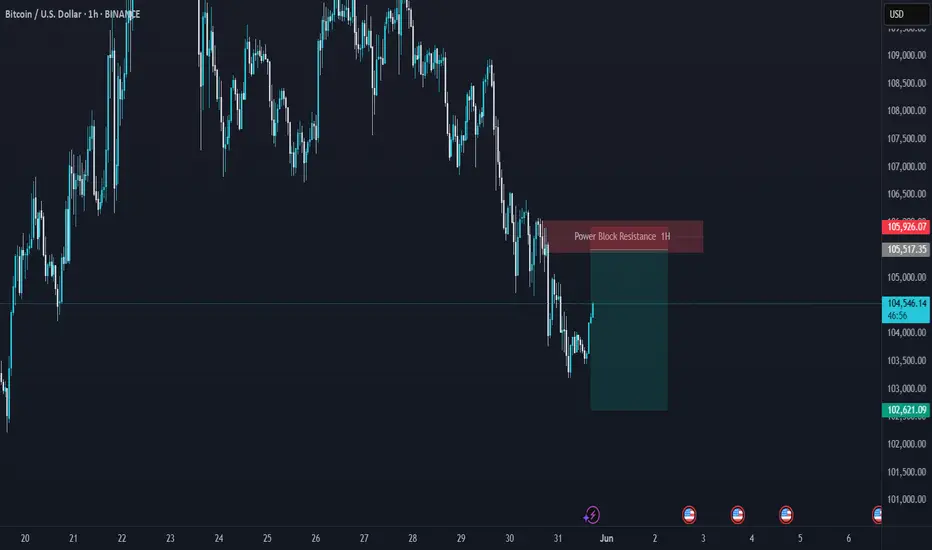
Hourly timeframe with the horizontal dotted line as a strong support line
BTCUSD Bearish Signal | Technical + Custom AlgoSmart Trend Signal | Technical Analysis + Custom Algorithm
This signal is the result of a combination of classic technical trend analysis and a proprietary software I personally developed.
BITCOIN Bearish Signal | Technical + Custom AlgoSmart Trend Signal | Technical Analysis + Custom Algorithm
This signal is the result of a combination of classic technical trend analysis and a proprietary software I personally developed.

Golden Cross? No Thanks!! Here’s How to Get In Early.📉 “Golden Cross? No Thanks. Here’s How to Get In Early.”
By FXProfessor
Everyone’s hyped about the Golden Cross again...
📰 “Bullish Signal!”
📈 “50 SMA crossed the 200!”
🎉 “Party time!”
Let me stop you right there.
If you’re waiting for that cross to go long —
You’re not late.
You’re definitely late.
The Golden Cross is a lagging indication.
It’s the afterparty. The smart money already had the drinks and left.
🔍 Here's the deal:
✅ Golden Cross forms after the move
✅ Price is usually already up double digits
✅ Sometimes it triggers right before a top
✅ Even EMAs (which I prefer) are still confirmation tools
✅ The real edge? Structure. Trendlines. Pressure zones.
📊 What I use instead:
-Custom EMAs that react faster
-My signature parallelogram method for early pressure
-Focus on trendlines and structure
-Above all — logic, not hype
- Fundamentals first!
For example, while the Golden Cross just printed, I was already watching $74,394 and $79,000.
Why? Because pressure builds before indicators react.
That's where the best entries live.
So next time someone posts
“Golden Cross confirmed!” 😏 Just smile and remember:
By the time the cross lights up, I’m already halfway to the next target.
Use EMAs if you like. But structure comes first.
That’s where the party starts.
One Love,
The FXProfessor 🧠📈
Disclosure: I am happy to be part of the Trade Nation's Influencer program and receive a monthly fee for using their TradingView charts in my analysis. Awesome people who care about the TRADER FIRST!

BTCUSD: Neutral on 1D means buy opportunity during rallies.Bitcoin has turned neutral on its 1D technical outlook (RSI = 51.351, MACD = 2908.600, ADX = 27.535) which is far from alarming as during Bull Cycle rallies such pullbacks are buy opportunities. Especially now that the price is even supported by the 1D MA50, which having cross above the 1D MA200 last week, they formed a Golden Cross. The pattern is identical to the last 1D Golden Cross, steady rally phases supported by HL trendlines that rose by roughly the same percentage. Their 1D RSI sequences also display similar formations. For that reason, we remain bullish on Bitcoin despite the current correction, targeting short term 119,000.
## If you like our free content follow our profile to get more daily ideas. ##
## Comments and likes are greatly appreciated. ##

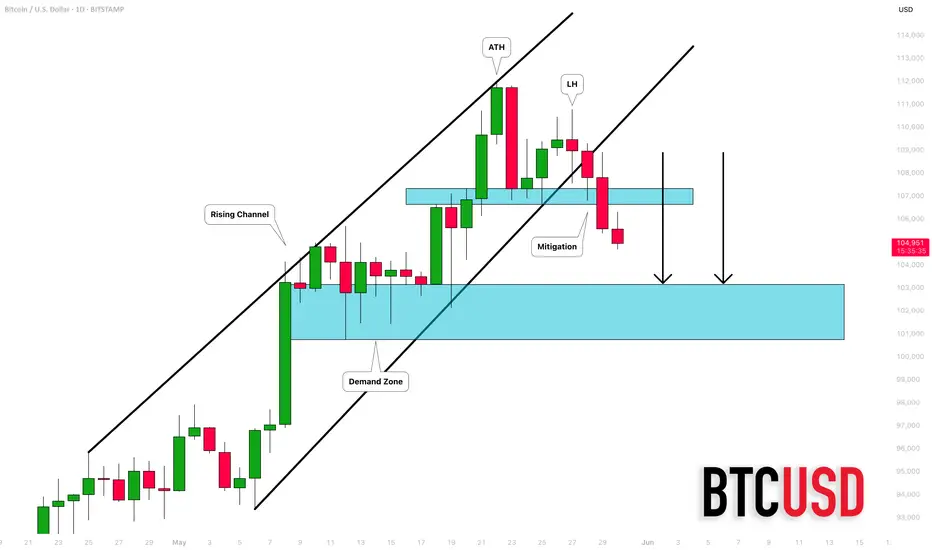
BITCOIN (BTCUSD): A Deeper Correction?!
After Bitcoin updated the All-Time High, the market became
weak and exhausted.
A violation of a support line of a rising channel and a breakout
of a key horizontal support indicate a highly probable continuation
of a correction.
Our closest demand zone is 103200. It can be the goal for the sellers for now.
❤️Please, support my work with like, thank you!❤️
BITCOIN targets 165k based on VIX's 10-year SupportBitcoin (BTCUSD) has started a new (and possibly last for this Cycle) Bullish Leg following April's bottom and has already made a new All Time High (ATH).
The BTC/VIX ratio on that very same day (April 07 2025) hit and rebounded on its 10-year Higher Lows trend-line, a Support level that has been holding since the August 24 2015 market bottom.
Every rebound on this Higher Lows trend-line, has produced a strong medium-term rally, the 'weakest' of which has been the most recent (August - December 2024), which rose by +121.44%. If BTC repeats this 'minimum', we are looking at a $165000 High, which aligns perfectly with the majority of projections for this Cycle's Top.
Do you think we will see that price by October? Feel free to let us know in the comments section below!
-------------------------------------------------------------------------------
** Please LIKE 👍, FOLLOW ✅, SHARE 🙌 and COMMENT ✍ if you enjoy this idea! Also share your ideas and charts in the comments section below! This is best way to keep it relevant, support us, keep the content here free and allow the idea to reach as many people as possible. **
-------------------------------------------------------------------------------
💸💸💸💸💸💸
👇 👇 👇 👇 👇 👇

Bitcoin moving downwardsHello dear friends.
According to the chart and the performance that Bitcoin has shown, it seems that we are in a short-term downtrend.
Bitcoin is expected to move to the resistance of 104,700 and then we will have a rebound.
❗Please note that this is an analysis and the possibility of a reversal is possible.