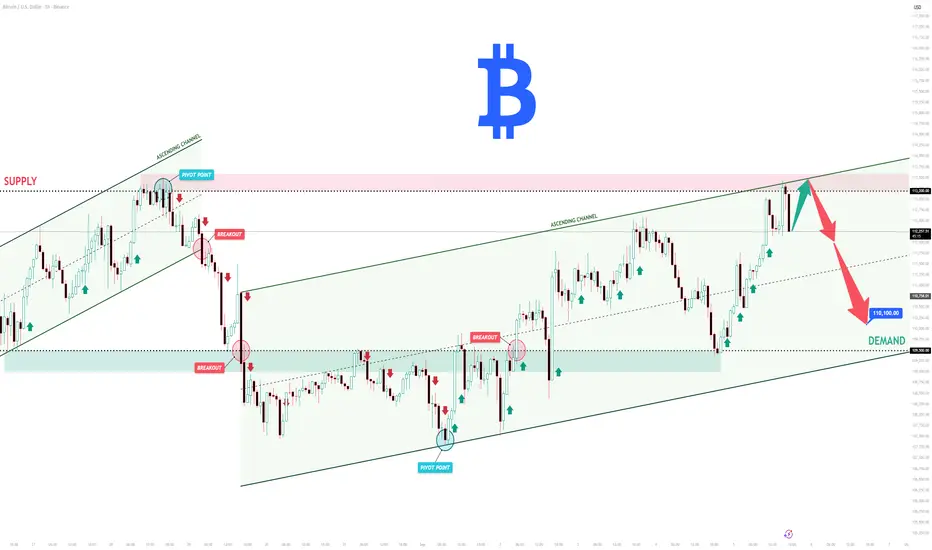
BTCUSD Short: Dump Of Supply ZoneHello, traders! The price auction for BTC has been operating within a large ascending channel, a structure defined by key pivot points that have established the 109500 demand area as support and the 113200 supply area as resistance. This bullish framework has guided the price through a series of higher highs and higher lows, confirming the buyer's initiative and the strength of the current uptrend.
Currently, the auction is at a critical inflection point at the top of this channel. The price has rallied to directly test the channel's ascending supply line, which forms a confluence of resistance with the horizontal 113200 - 113600 supply zone. This is a key area where sellers are expected to become active and challenge the prevailing bullish momentum.
The primary scenario anticipates a corrective move from these highs. The expectation is that sellers will defend the supply zone and reject the price, initiating a downward rotation back towards the channel's support line. A failure to break out higher would confirm a short-term correction is underway. The take-profit for this rotational play is therefore set at 110100 points, targeting a key liquidity area above the primary demand zone. Manage your risk!
Bitcoin-short
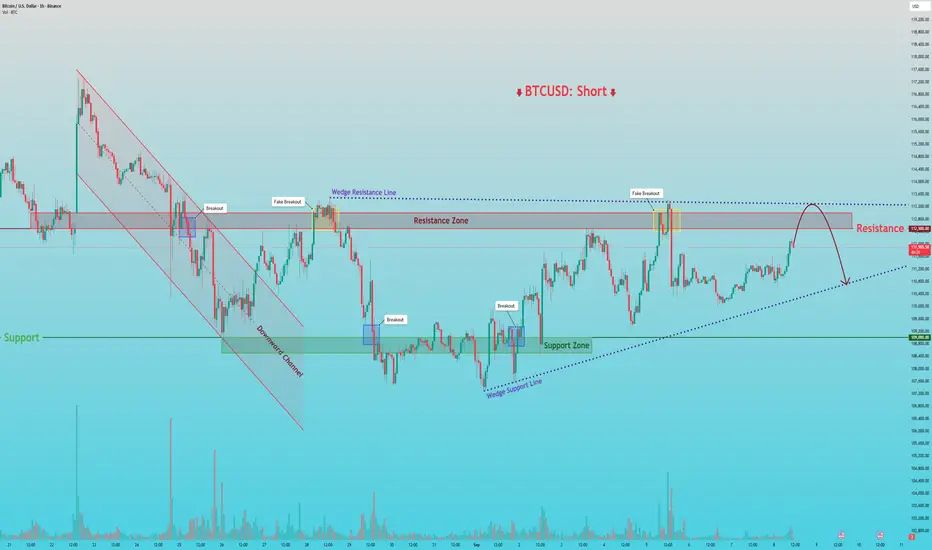
BTCUSD: Fake Breakout and Drop to Support LineHello everyone, here is my breakdown of the current Bitcoin setup.
Market Analysis
From a broader perspective, the price of Bitcoin has transitioned from a downward channel into a large rising wedge pattern. This structure has defined the price action for several weeks, creating a volatile environment with clear boundaries at the support zone near the 109000 level and the resistance zone up to the 113000 area.
Currently, we are at a very interesting and critical point. The price has once again rallied to the top of the Wedge and is testing the major horizontal resistance at the 112500 level. This is the third significant test of this ceiling in recent history.
My Scenario & Strategy
My scenario is built on a repeating pattern of behavior I've observed at this resistance. On the two previous tests of this 112500 area, the price created a 'fake breakout', briefly pushing above the level only to be aggressively sold off. This repeated failure is a strong clue that sellers are dominant here.
My expectation is that history will repeat itself. I'm looking for the price to make one more 'fake breakout' push into the 112500 - 113000 resistance zone. A swift reversal and a fall back below the 112500 level would be the key signal that sellers have once again taken control. The primary target for this move is 110700, which aligns with the ascending wedge support line.
That's the setup I'm tracking. Thank you for your attention, and always manage your risk.
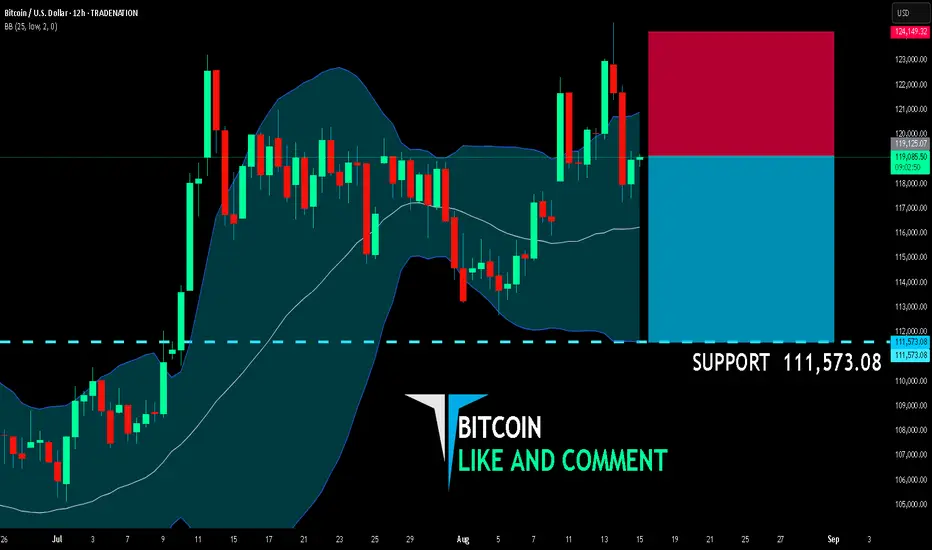
BITCOIN SHORT FROM RESISTANCE
BITCOIN SIGNAL
Trade Direction: short
Entry Level: 119,125.07
Target Level: 111,573.08
Stop Loss: 124,149.32
RISK PROFILE
Risk level: medium
Suggested risk: 1%
Timeframe: 12h
Disclosure: I am part of Trade Nation's Influencer program and receive a monthly fee for using their TradingView charts in my analysis.
✅LIKE AND COMMENT MY IDEAS✅
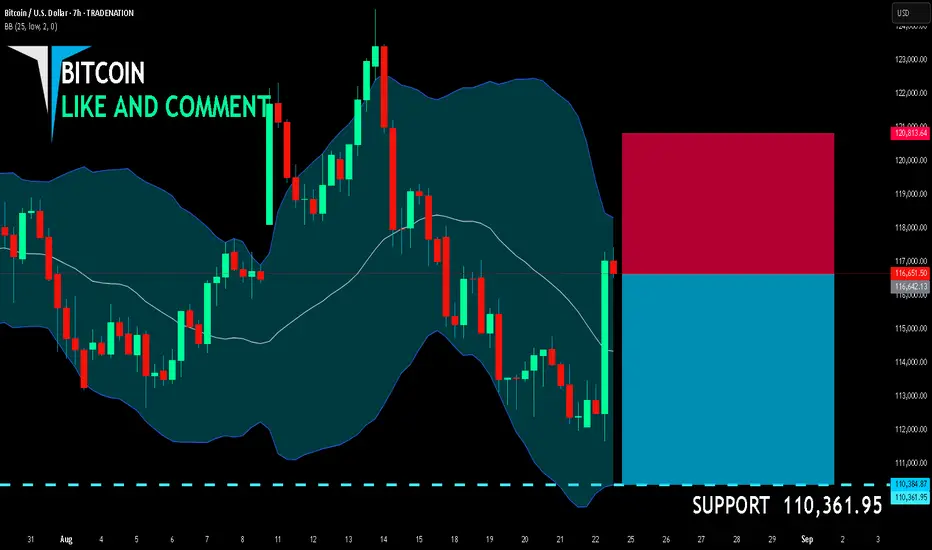
BITCOIN SELLERS WILL DOMINATE THE MARKET|SHORT
BITCOIN SIGNAL
Trade Direction: short
Entry Level: 116,642.13
Target Level: 110,361.95
Stop Loss: 120,813.64
RISK PROFILE
Risk level: medium
Suggested risk: 1%
Timeframe: 7h
Disclosure: I am part of Trade Nation's Influencer program and receive a monthly fee for using their TradingView charts in my analysis.
✅LIKE AND COMMENT MY IDEAS✅
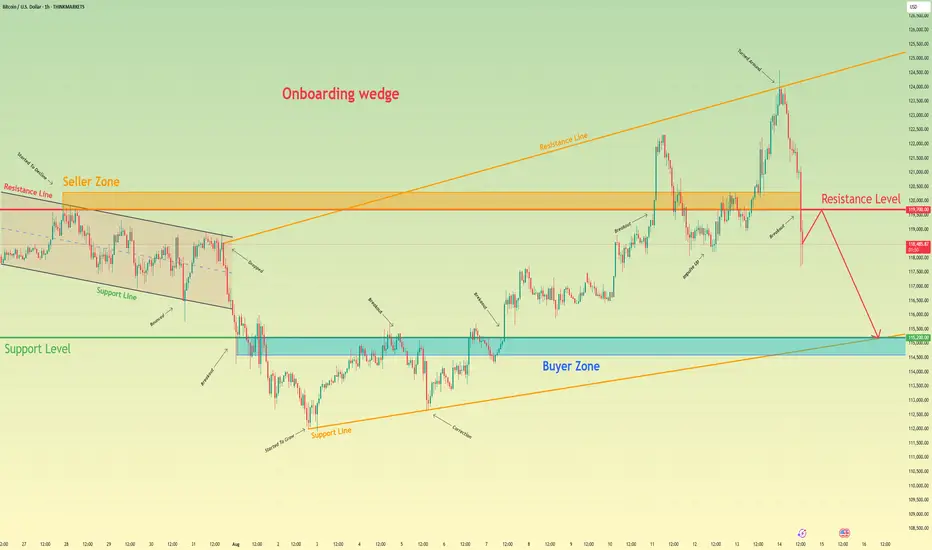
Bitcoin may continue to decline to support level in wedgeHello traders, I want share with you my opinion about Bitcoin. The market structure for Bitcoin has evolved significantly, transitioning from a contained downward channel into a much more volatile and expansive broadening wedge after a major breakout. This new pattern has defined a wide trading range, with price action making higher highs and lower lows, indicating a fierce battle between market participants. The most recent and critical development within this structure has been the price's failure to hold above the key level of 119700, breaking down below this former support and seller zone. Currently, the asset appears to be in a corrective phase, setting up for a potential retest of this broken level from underneath. The primary working hypothesis is a short scenario, which anticipates that the price will rally to test the 119700 resistance level and be rejected. A confirmed failure to reclaim this level would serve as a strong validation of the bearish pressure and suggest that a full rotation towards the bottom of the broadening wedge is now the most probable outcome. Therefore, the tp is logically and strategically placed at the 115200 level. This target is particularly significant as it represents a powerful confluence of the horizontal support level, the main buyer zone, and the ascending support line of the wedge, making it a natural magnet for price on the next major downward impulse. Please share this idea with your friends and click Boost 🚀
Disclaimer: As part of ThinkMarkets’ Influencer Program, I am sponsored to share and publish their charts in my analysis.
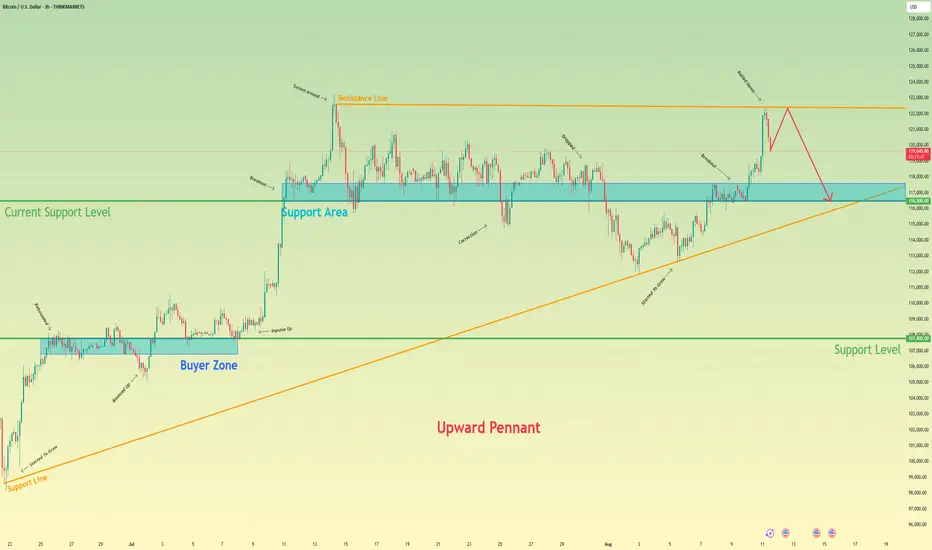
Bitcoin will rebound from resistance line and then continue fallHello traders, I want share with you my opinion about Bitcoin. After looking at the chart, we can see how the price entered an upward pennant and then at once rebounded up from the support line. Then it reached support level, which coincided with the buyer zone, and some time traded near this level, after which it made a small correction. Later it grew higher to 107800 level, breaking it and then made a retest. After this movement, BTC made an impulse up from the support level and rose to the current support level, which coincided with the support area and soon broke it. Later, it BTC rose to the resistance line of the pennant and then made a correction to the support area and started to trades inside. But later it made a fake breakout of the current support level and then tried to back up, but failed and dropped to the support line of support line of upward pennant. Then BTC turned around and started to grow, and soon broke the 116500 level one more time. After this, it reached the resistance line of the pennant, and it turned around and started to decline. In my mind, BTC will grow to the resistance line and then continue to decline 116500 support level. That's why it's my current TP. Please share this idea with your friends and click Boost 🚀
Disclaimer: As part of ThinkMarkets’ Influencer Program, I am sponsored to share and publish their charts in my analysis.
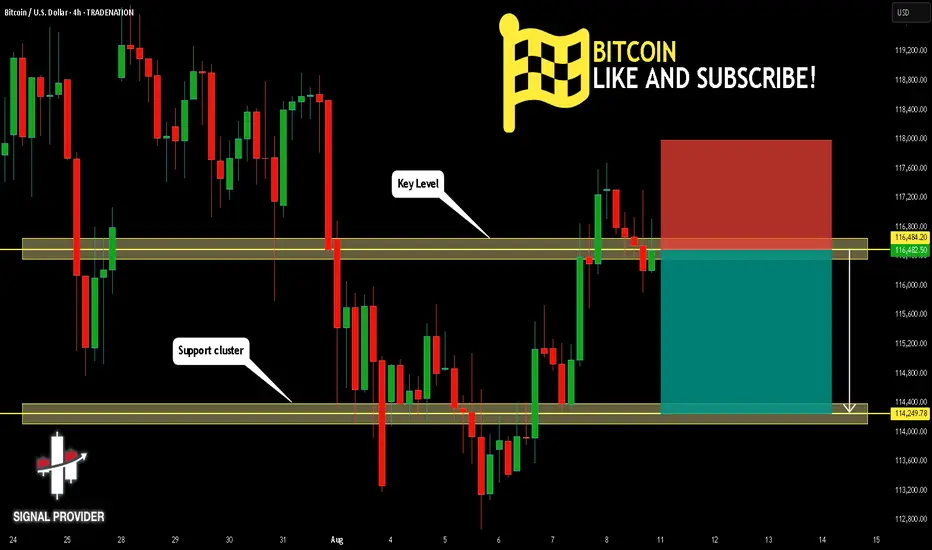
BITCOIN Will Move Lower! Short!
Take a look at our analysis for BITCOIN.
Time Frame: 4h
Current Trend: Bearish
Sentiment: Overbought (based on 7-period RSI)
Forecast: Bearish
The price is testing a key resistance 116,484.20.
Taking into consideration the current market trend & overbought RSI, chances will be high to see a bearish movement to the downside at least to 114,249.78 level.
P.S
The term oversold refers to a condition where an asset has traded lower in price and has the potential for a price bounce.
Overbought refers to market scenarios where the instrument is traded considerably higher than its fair value. Overvaluation is caused by market sentiments when there is positive news.
Disclosure: I am part of Trade Nation's Influencer program and receive a monthly fee for using their TradingView charts in my analysis.
Like and subscribe and comment my ideas if you enjoy them!
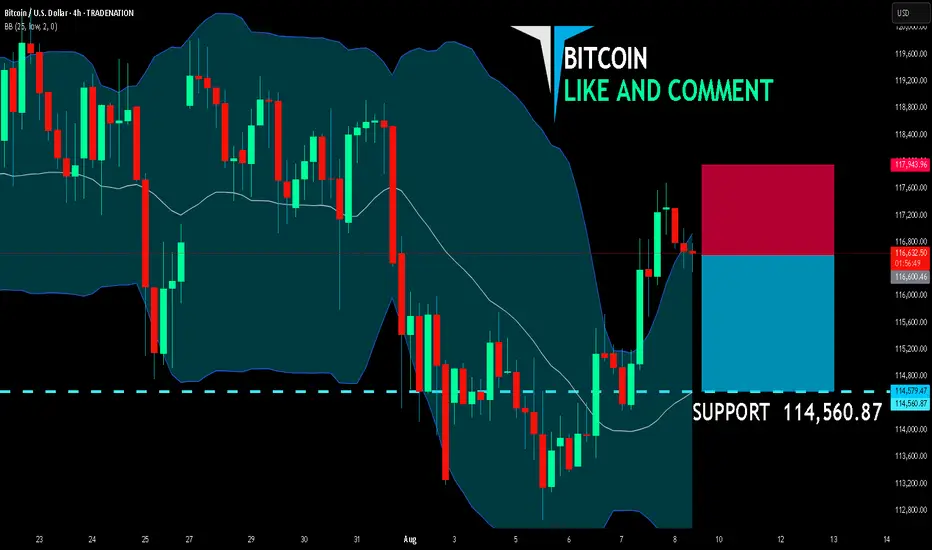
BITCOIN BEARS WILL DOMINATE THE MARKET|SHORT
BITCOIN SIGNAL
Trade Direction: short
Entry Level: 116,600.46
Target Level: 114,560.87
Stop Loss: 117,943.96
RISK PROFILE
Risk level: medium
Suggested risk: 1%
Timeframe: 4h
Disclosure: I am part of Trade Nation's Influencer program and receive a monthly fee for using their TradingView charts in my analysis.
✅LIKE AND COMMENT MY IDEAS✅
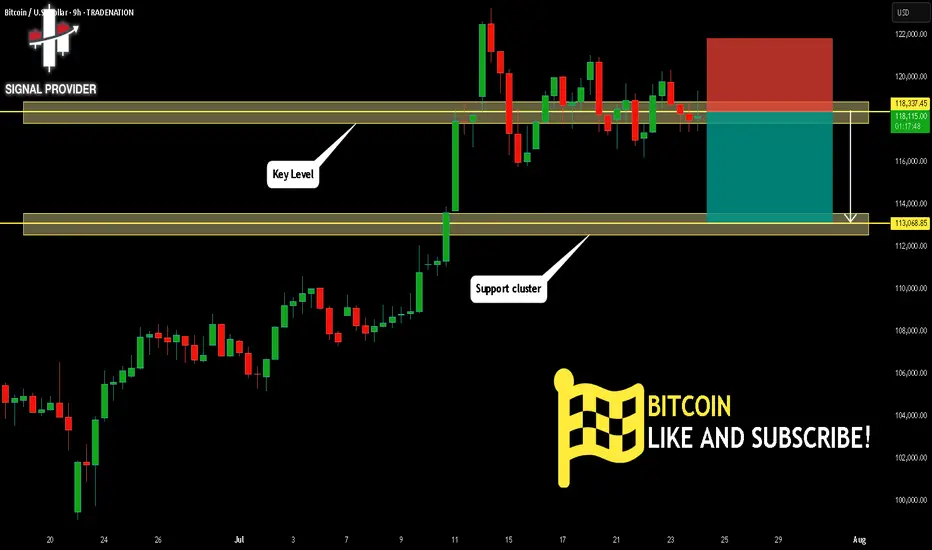
BITCOIN Will Fall! Short!
Take a look at our analysis for BITCOIN.
Time Frame: 9h
Current Trend: Bearish
Sentiment: Overbought (based on 7-period RSI)
Forecast: Bearish
The market is approaching a key horizontal level 118,337.45.
Considering the today's price action, probabilities will be high to see a movement to 113,068.85.
P.S
We determine oversold/overbought condition with RSI indicator.
When it drops below 30 - the market is considered to be oversold.
When it bounces above 70 - the market is considered to be overbought.
Disclosure: I am part of Trade Nation's Influencer program and receive a monthly fee for using their TradingView charts in my analysis.
Like and subscribe and comment my ideas if you enjoy them!
BITCOIN Will Go Lower! Sell!
Please, check our technical outlook for BITCOIN.
Time Frame: 9h
Current Trend: Bearish
Sentiment: Overbought (based on 7-period RSI)
Forecast: Bearish
The market is trading around a solid horizontal structure 113,260.21.
The above observations make me that the market will inevitably achieve 107,826.27 level.
P.S
We determine oversold/overbought condition with RSI indicator.
When it drops below 30 - the market is considered to be oversold.
When it bounces above 70 - the market is considered to be overbought.
Disclosure: I am part of Trade Nation's Influencer program and receive a monthly fee for using their TradingView charts in my analysis.
Like and subscribe and comment my ideas if you enjoy them!

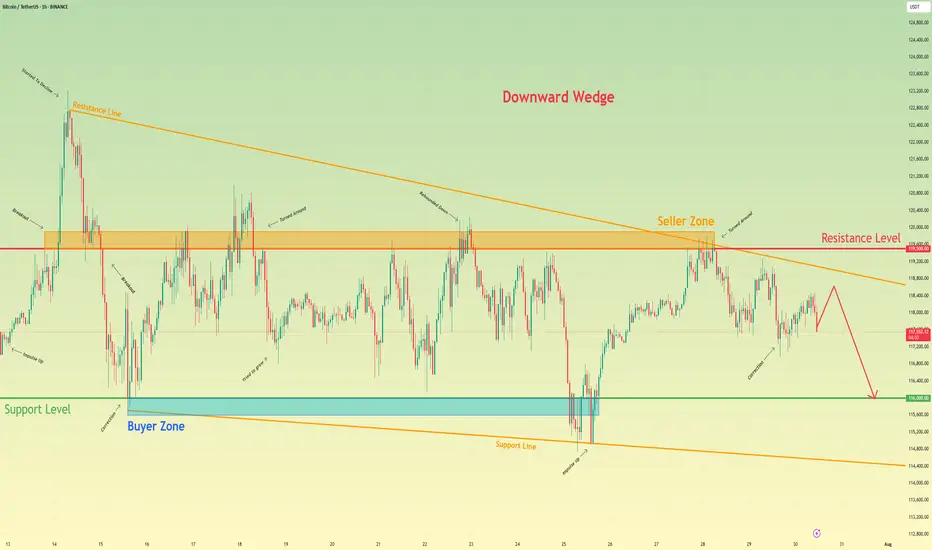
Bitcoin will continue to decline to support levelHello traders, I want share with you my opinion about Bitcoin. Following a period of a broad downward trend, bitcoin's price action has been channeled into a large downward wedge, a pattern that signifies converging volatility and a period of consolidation before an eventual decisive move. This market action is taking place between two critical, well-established zones: a major seller zone capping rallies around the 119500 resistance level and a significant buyer zone providing support near 116000. Recently, an upward rebound attempted to test the upper boundary of this wedge but was met with strong selling pressure from the seller zone, confirming its validity as a formidable barrier. The price is now correcting downwards after this rejection. The primary working hypothesis is a short scenario, anticipating that the bearish momentum from this recent failure will continue to drive the price lower. While a minor bounce or retest of local resistance is possible, the path of least resistance within the pattern's structure is now towards its lower boundary. Therefore, the TP is strategically set at the 116000 level. Please share this idea with your friends and click Boost 🚀
Disclaimer: As part of ThinkMarkets’ Influencer Program, I am sponsored to share and publish their charts in my analysis.
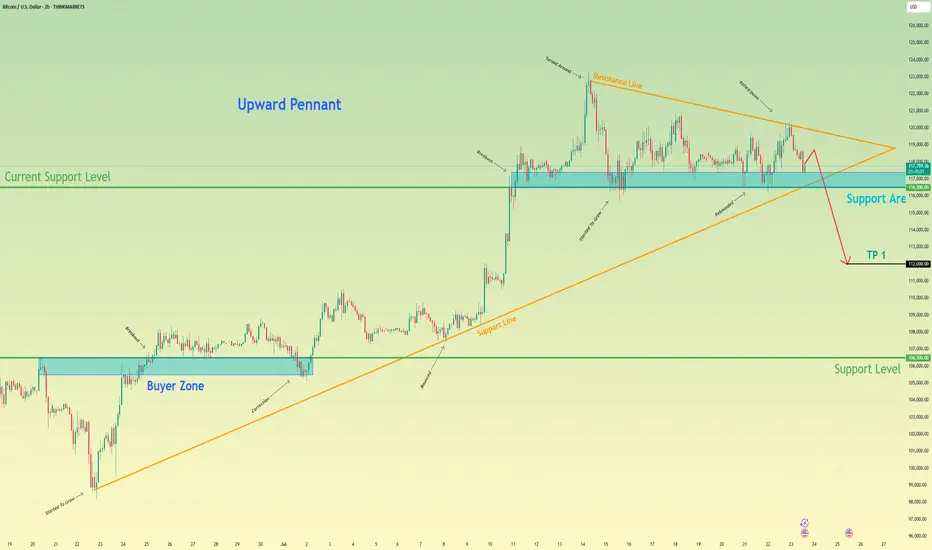
Bitcoin can start to decline and break support levelHello traders, I want share with you my opinion about Bitcoin. After completing a powerful upward impulse that originated from the buyer zone near 106500, the price action for BTC has transitioned into a corrective market phase. This consolidation has taken the form of an upward pennant, characterised by a narrowing trading range that suggests a significant directional move is forthcoming. Currently, the asset is undergoing a sequence of downward corrections within the pennant, exerting repeated pressure on the critical demand zone between 116500 and 117400. The importance of this zone is amplified by its confluence with the lower trend line of the formation itself. The primary working hypothesis is a bearish resolution, anticipating that persistent selling pressure will culminate in a decisive breakdown of this support. This event would act as a bearish breakout from the pennant, providing strong confirmation for the continuation of the downward impulsive momentum and shifting the local market structure. Therefore, the take-profit level is logically positioned at the 112000 mark. Please share this idea with your friends and click Boost 🚀
Disclaimer: As part of ThinkMarkets’ Influencer Program, I am sponsored to share and publish their charts in my analysis.
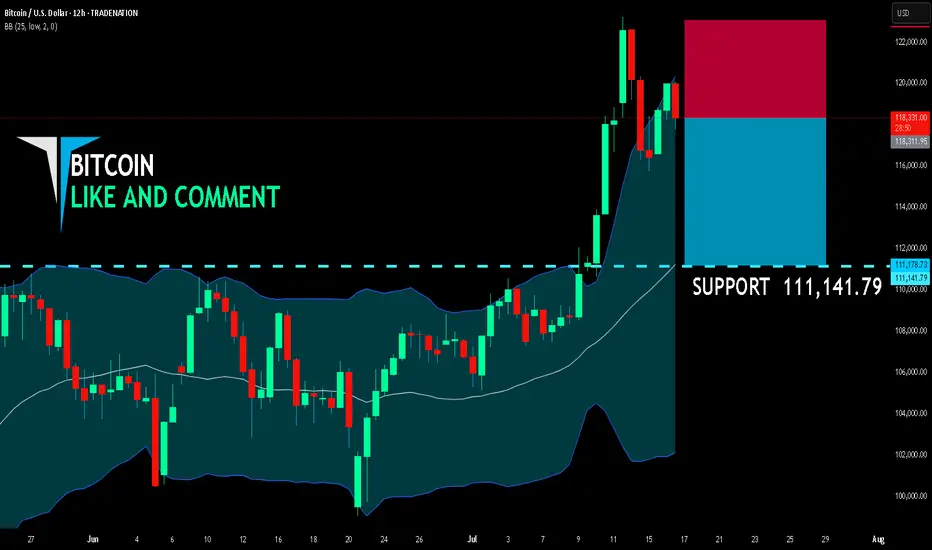
BITCOIN SHORT FROM RESISTANCE
BITCOIN SIGNAL
Trade Direction: short
Entry Level: 118,311.95
Target Level: 111,141.79
Stop Loss: 123,054.98
RISK PROFILE
Risk level: medium
Suggested risk: 1%
Timeframe: 12h
Disclosure: I am part of Trade Nation's Influencer program and receive a monthly fee for using their TradingView charts in my analysis.
✅LIKE AND COMMENT MY IDEAS✅
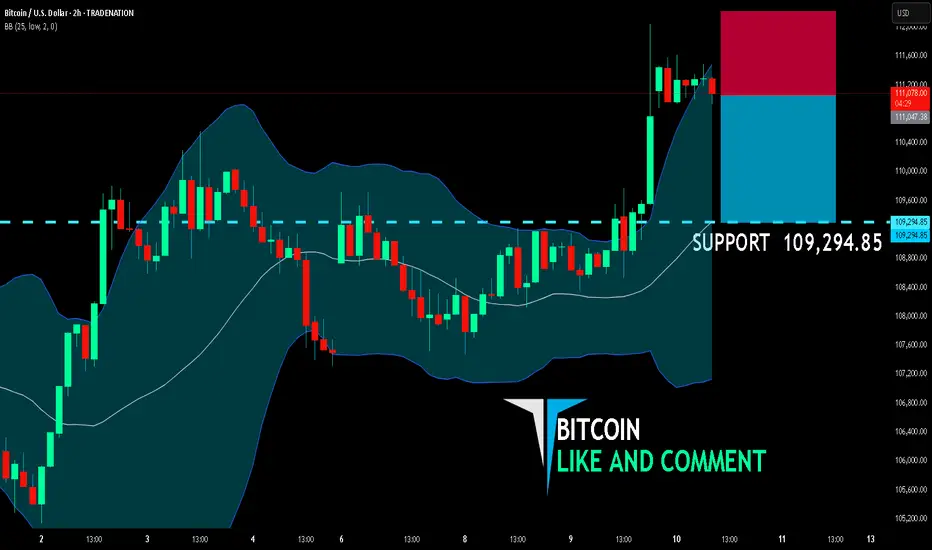
BITCOIN BEARS WILL DOMINATE THE MARKET|SHORT
BITCOIN SIGNAL
Trade Direction: short
Entry Level: 111,047.38
Target Level: 109,294.85
Stop Loss: 112,211.89
RISK PROFILE
Risk level: medium
Suggested risk: 1%
Timeframe: 2h
Disclosure: I am part of Trade Nation's Influencer program and receive a monthly fee for using their TradingView charts in my analysis.
✅LIKE AND COMMENT MY IDEAS✅
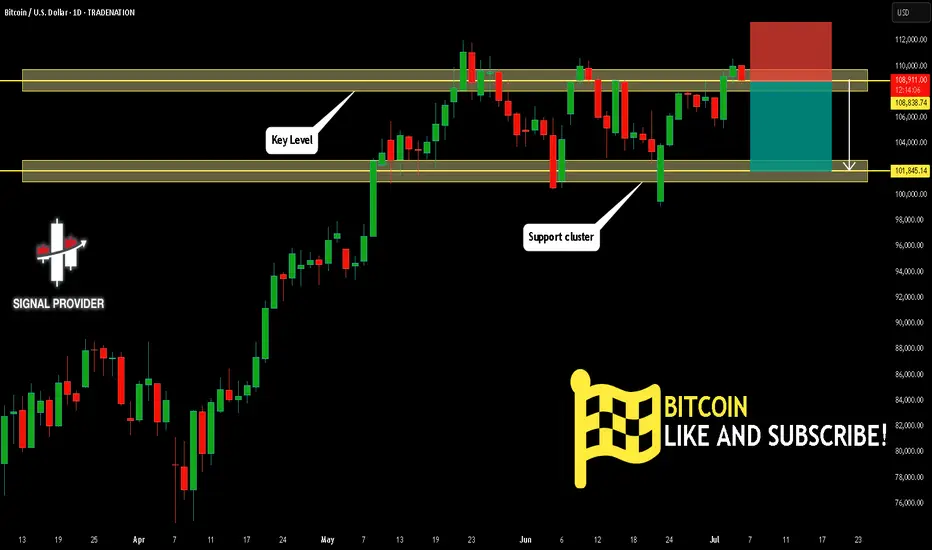
BITCOIN Will Fall! Sell!
Please, check our technical outlook for BITCOIN.
Time Frame: 1D
Current Trend: Bearish
Sentiment: Overbought (based on 7-period RSI)
Forecast: Bearish
The price is testing a key resistance 108,838.74.
Taking into consideration the current market trend & overbought RSI, chances will be high to see a bearish movement to the downside at least to 101,845.14 level.
P.S
The term oversold refers to a condition where an asset has traded lower in price and has the potential for a price bounce.
Overbought refers to market scenarios where the instrument is traded considerably higher than its fair value. Overvaluation is caused by market sentiments when there is positive news.
Disclosure: I am part of Trade Nation's Influencer program and receive a monthly fee for using their TradingView charts in my analysis.
Like and subscribe and comment my ideas if you enjoy them!
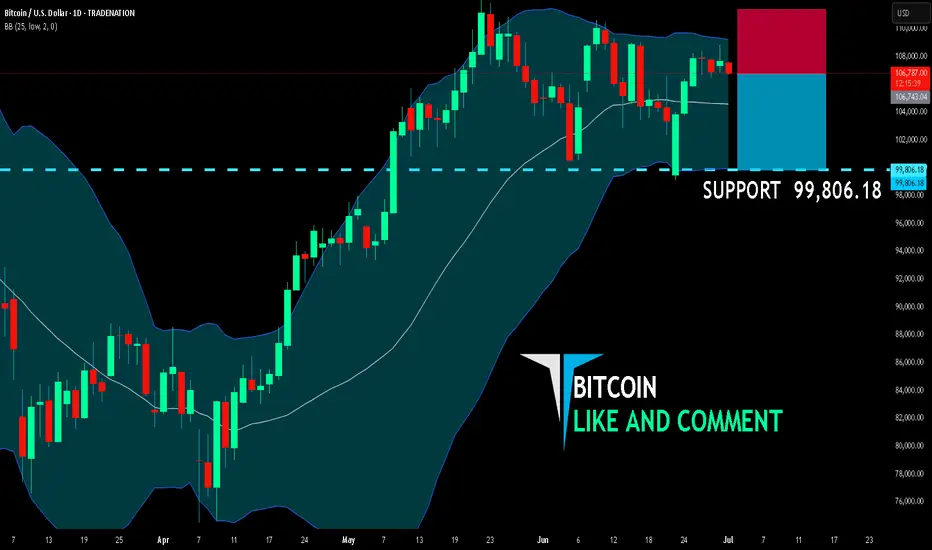
BITCOIN BEARS ARE GAINING STRENGTH|SHORT
BITCOIN SIGNAL
Trade Direction: short
Entry Level: 106,743.04
Target Level: 99,806.18
Stop Loss: 111,349.12
RISK PROFILE
Risk level: medium
Suggested risk: 1%
Timeframe: 1D
Disclosure: I am part of Trade Nation's Influencer program and receive a monthly fee for using their TradingView charts in my analysis.
✅LIKE AND COMMENT MY IDEAS✅
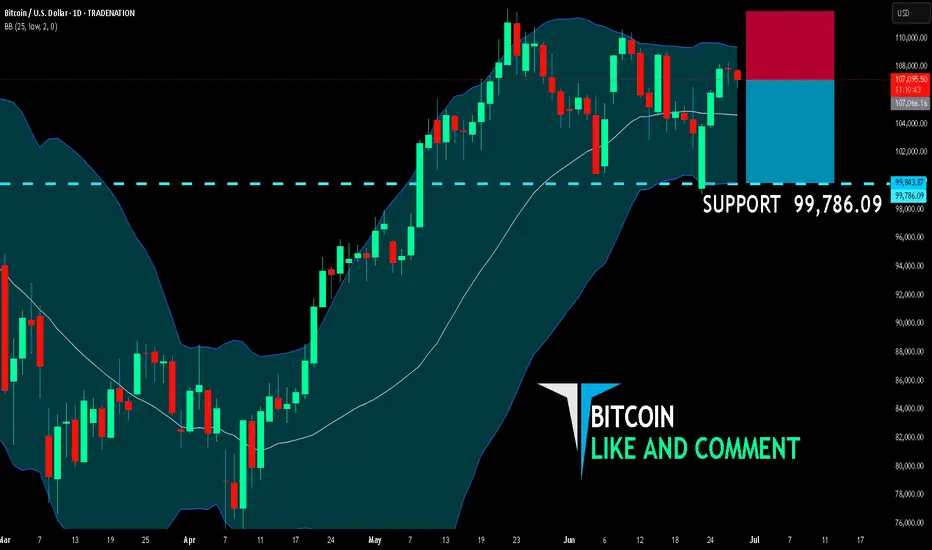
BITCOIN SHORT FROM RESISTANCE
BITCOIN SIGNAL
Trade Direction: short
Entry Level: 107,066.16
Target Level: 99,786.09
Stop Loss: 111,861.76
RISK PROFILE
Risk level: medium
Suggested risk: 1%
Timeframe: 1D
Disclosure: I am part of Trade Nation's Influencer program and receive a monthly fee for using their TradingView charts in my analysis.
LIKE AND COMMENT MY IDEAS
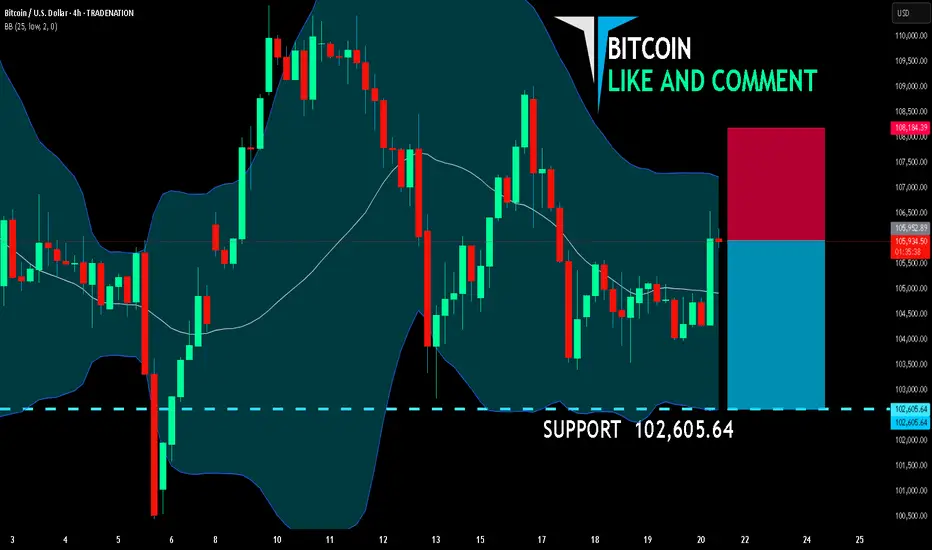
BITCOIN BEARS WILL DOMINATE THE MARKET|SHORT
BITCOIN SIGNAL
Trade Direction: short
Entry Level: 105,952.89
Target Level: 102,605.64
Stop Loss: 108,184.39
RISK PROFILE
Risk level: medium
Suggested risk: 1%
Timeframe: 4h
Disclosure: I am part of Trade Nation's Influencer program and receive a monthly fee for using their TradingView charts in my analysis.
✅LIKE AND COMMENT MY IDEAS✅
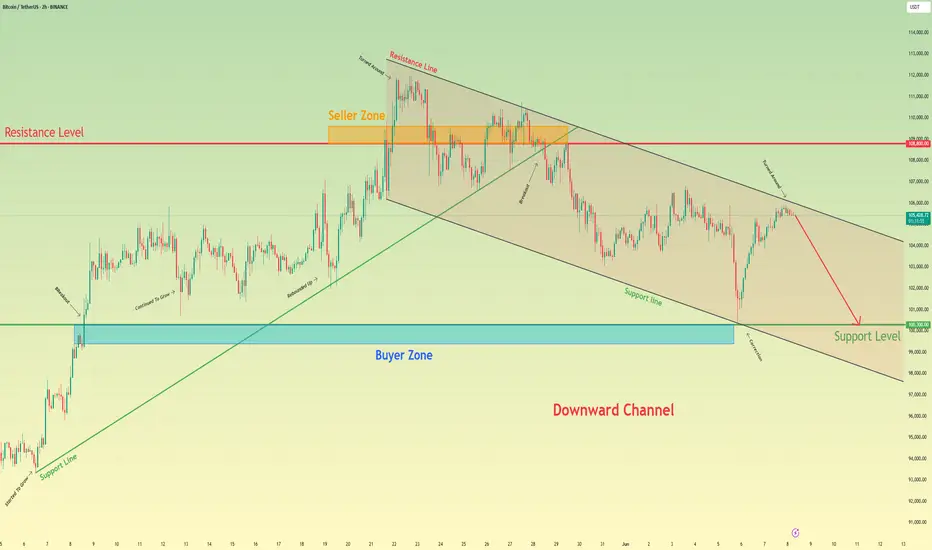
Bitcoin will continue to fall to support level in channelHello traders, I want share with you my opinion about Bitcoin. This chart shows how the price rebounded from the support line and started to grow. In a short time, it rose to the support level, which coincided with the buyer zone, and it even soon broke this level. Next, the price rose a little and then continued to move up, but later corrected the support line. After this, BTC rebounded and rose to the seller zone, breaking the 108800 resistance level. Then it rose a little more and turned around, and started to decline inside the downward channel. In the channel, price soon broke the 108800 level and continued to fall next. Later, Bitcoin broke the support line and fell almost to the support line of the channel, after which it turned around and made an upward movement. After this movement, Bitcoin dropped to the 100300 support level, after which it turned around and, in a short time, rose to almost the resistance line of the channel. Price didn't reach this line, turned around, and continued to fall in the channel. In my mind, Bitcoin can continue to move down top support level inside the downward channel. That's why my TP is 100300 level. Please share this idea with your friends and click Boost 🚀
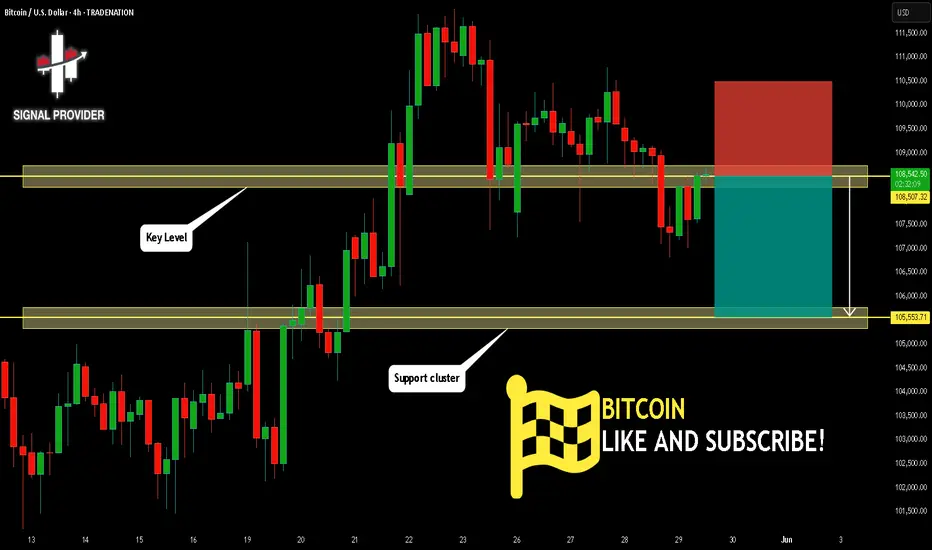
BITCOIN Will Fall! Short!
Here is our detailed technical review for BITCOIN.
Time Frame: 4h
Current Trend: Bearish
Sentiment: Overbought (based on 7-period RSI)
Forecast: Bearish
The market is approaching a significant resistance area 108,507.32.
Due to the fact that we see a positive bearish reaction from the underlined area, I strongly believe that sellers will manage to push the price all the way down to 105,553.71 level.
P.S
Overbought describes a period of time where there has been a significant and consistent upward move in price over a period of time without much pullback.
Disclosure: I am part of Trade Nation's Influencer program and receive a monthly fee for using their TradingView charts in my analysis.
Like and subscribe and comment my ideas if you enjoy them!
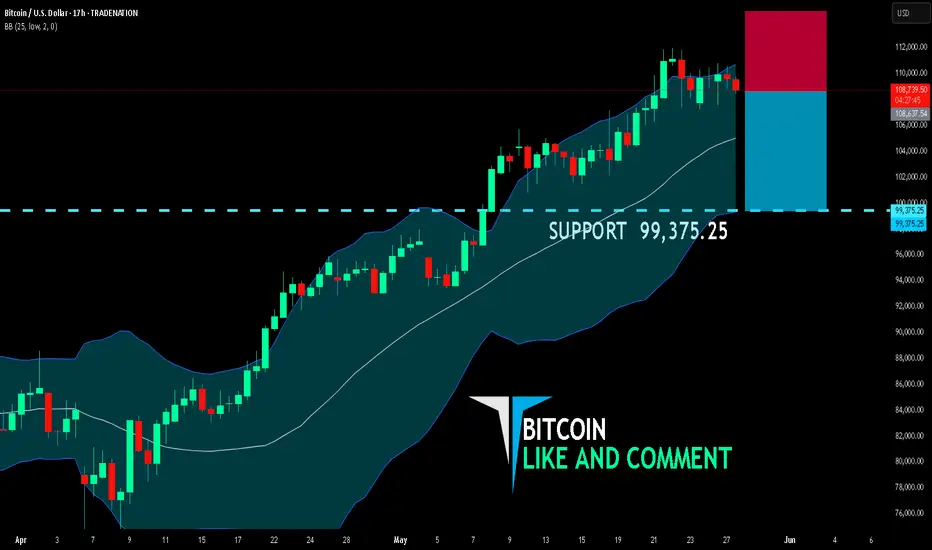
BITCOIN SELLERS WILL DOMINATE THE MARKET|SHORT
BITCOIN SIGNAL
Trade Direction: short
Entry Level: 108,637.54
Target Level: 99,375.25
Stop Loss: 114,788.84
RISK PROFILE
Risk level: medium
Suggested risk: 1%
Timeframe: 17h
Disclosure: I am part of Trade Nation's Influencer program and receive a monthly fee for using their TradingView charts in my analysis.
✅LIKE AND COMMENT MY IDEAS✅
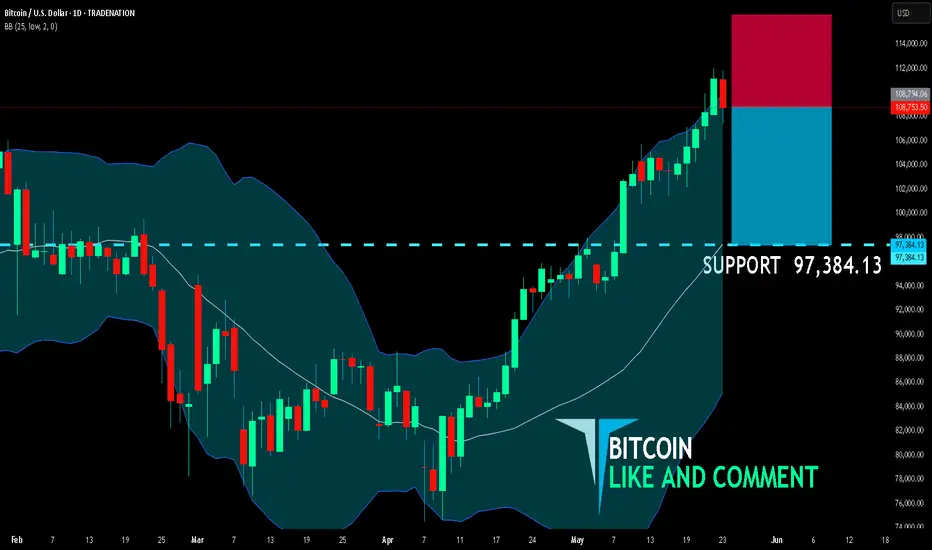
BITCOIN SENDS CLEAR BEARISH SIGNALS|SHORT
BITCOIN SIGNAL
Trade Direction: short
Entry Level: 108,794.06
Target Level: 97,384.13
Stop Loss: 116,400.68
RISK PROFILE
Risk level: medium
Suggested risk: 1%
Timeframe: 1D
Disclosure: I am part of Trade Nation's Influencer program and receive a monthly fee for using their TradingView charts in my analysis.
✅LIKE AND COMMENT MY IDEAS✅
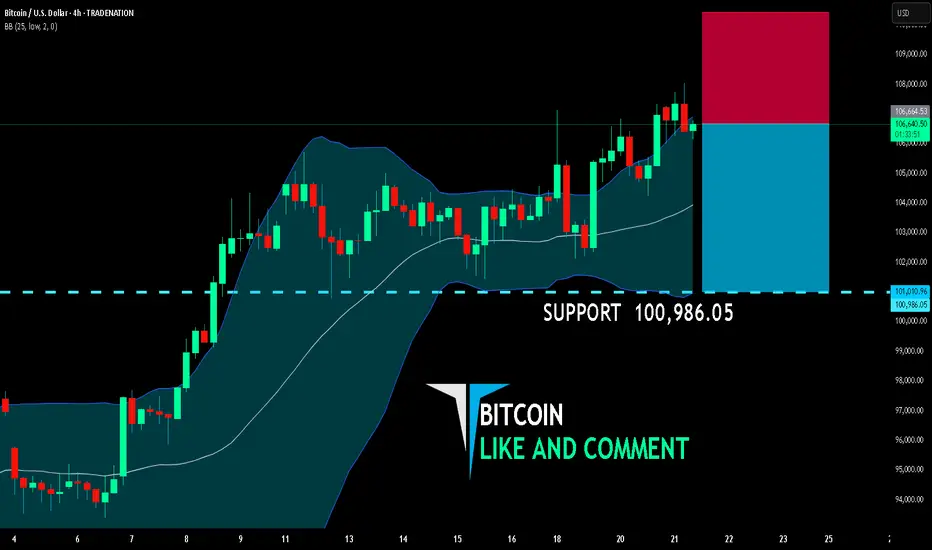
BITCOIN BEARISH BIAS RIGHT NOW| SHORT
BITCOIN SIGNAL
Trade Direction: short
Entry Level: 106,664.53
Target Level: 100,986.05
Stop Loss: 110,439.78
RISK PROFILE
Risk level: medium
Suggested risk: 1%
Timeframe: 4h
Disclosure: I am part of Trade Nation's Influencer program and receive a monthly fee for using their TradingView charts in my analysis.
✅LIKE AND COMMENT MY IDEAS✅