Am I wrong to still be shorting BTC?There has been a pretty sharp and decisive reversal since breaking $6600 last night, but looking at this daily chart or even looking at the four hour chart I don't see much bullish about it.
Bitcoin-short
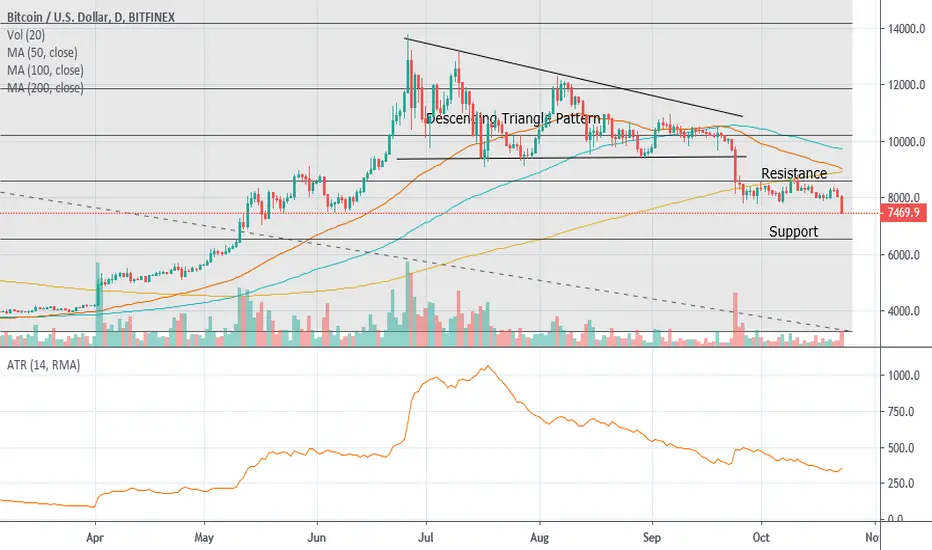
6 Key Levels to Watch Out-Bottom for Bitcoin may not be so CloseFrom top to bottom, strength of each support level gets stronger.
Neutral interval between 5800-6400 may provide a strong support for a big bounce but I don't think that bounce will be high enough to end up bearish tone in the market.
Strong interval between 4100-5000 is being the turn of the bearish market to bullish seems most possible.
Last support interval between 2000-3500 is by intuition my favourite level. I've been thinking of Bitcoin dropping to this level for the last month and somehow it makes quite a lot of sense. It was the most popular idea of the previous bear market. If the rumors about Bitcoin dropping below 3000 start before Bitcoin actually reaches to that point, It may never be reached. If Bitcoin does reach to this level, probably it will catch many traders off guard.

Bitcoin - Short - Further DownsideAs mentioned on our last analysis since Bitcoin has dropped below $8572 we expect the expect the cryptocurrency to drop further towards the next support level a $6536. Additionally, there has been downside pressure due to the People's Bank of China announcing a clampdown on Bitcoin trading in China.
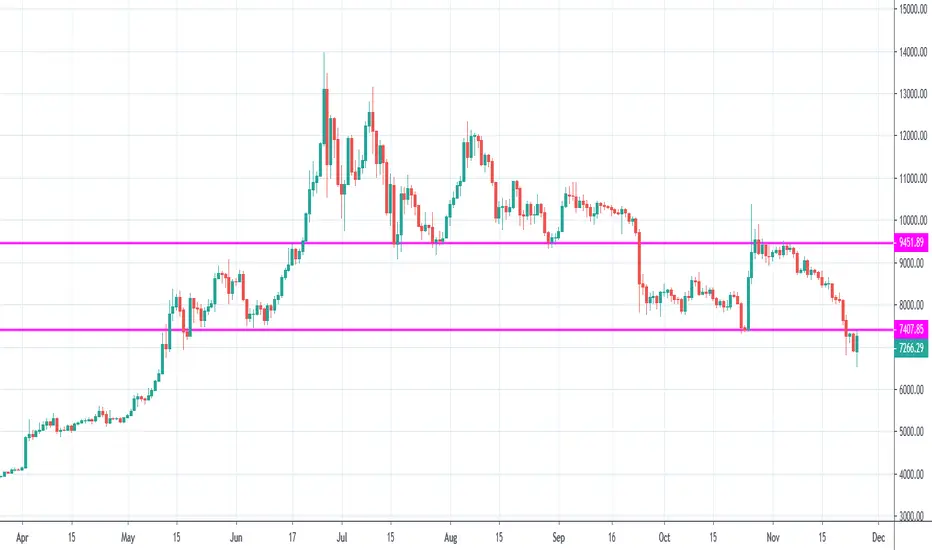
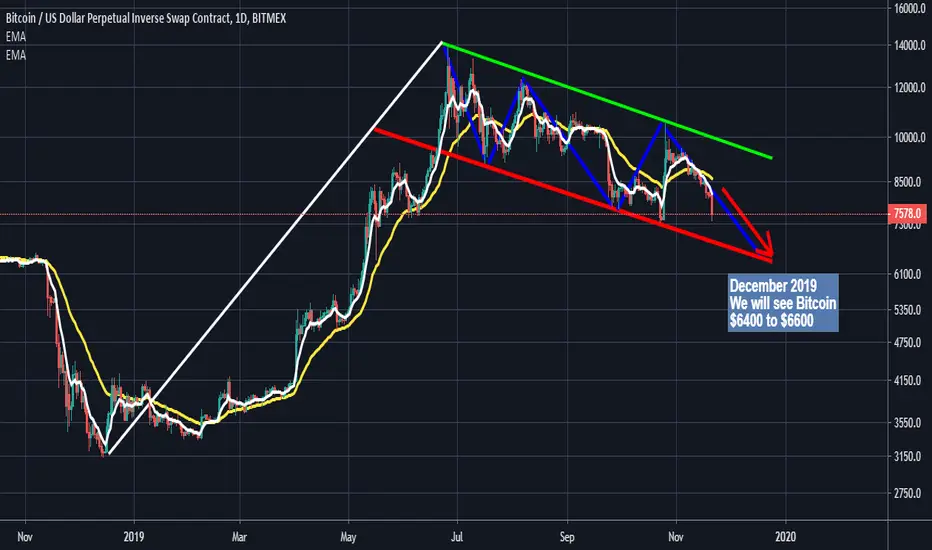
Still bearish Bitcoin MarketIf Bitcoin didn't break green line with good trade volume, the current situation of market is still bearish and we will see Bitcoin price $6400 to 6600 and the end of December 2019 around last two weeks.
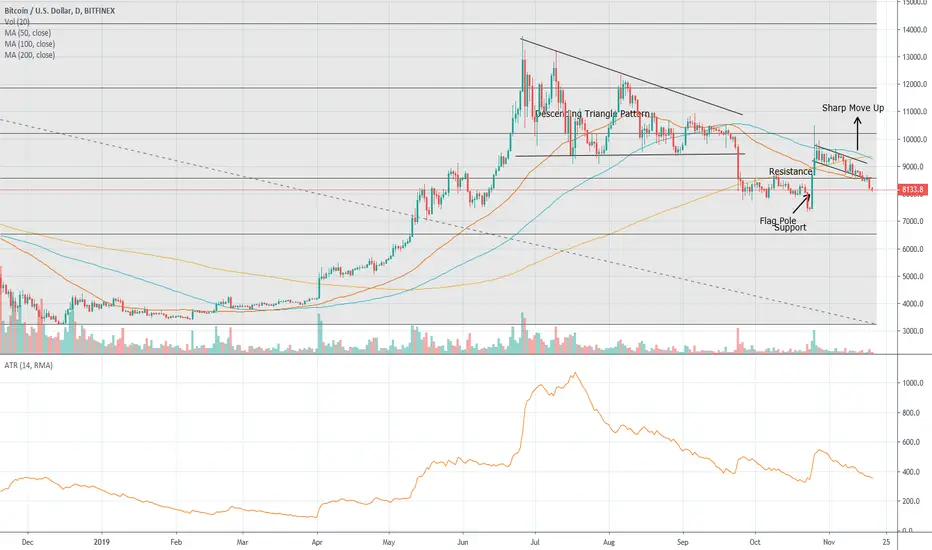
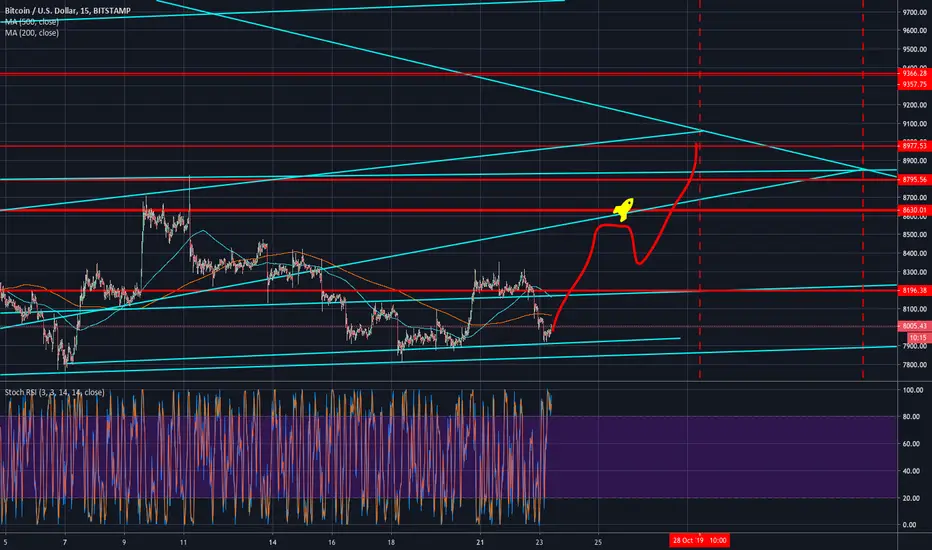
XBTUSD 'Potential' pattern formingAnything could happen for sure but I like to keep my eye out for possible pattern formations.
It keeps me interested and in the game and leaves me open to great snipe opportunities!
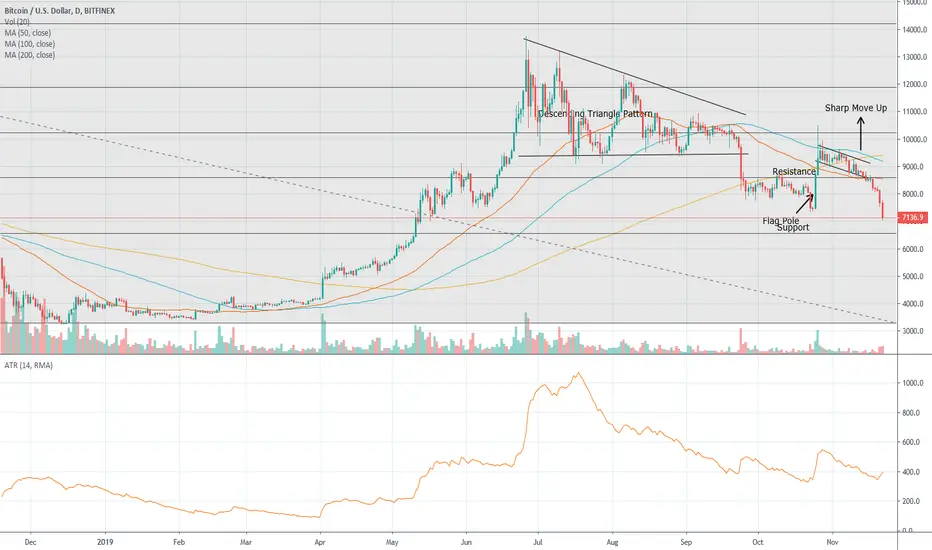
Bitcoin - Short - Key Support Level BrokenBitcoin has broken the key support level at $8572 and we therefore see further downside below $7000 to the next support level at $6536. Having been in a downtrend since the sharp rally in June and failing to gain positive momentum on the upside we would be cautious in taking a long view unless the cryptocurrency consolidates above the $10000 psychological level.

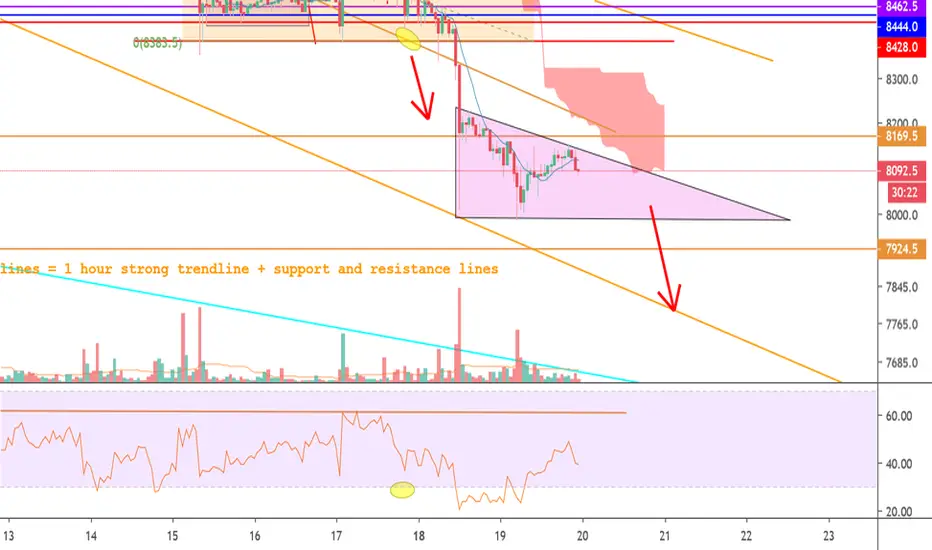
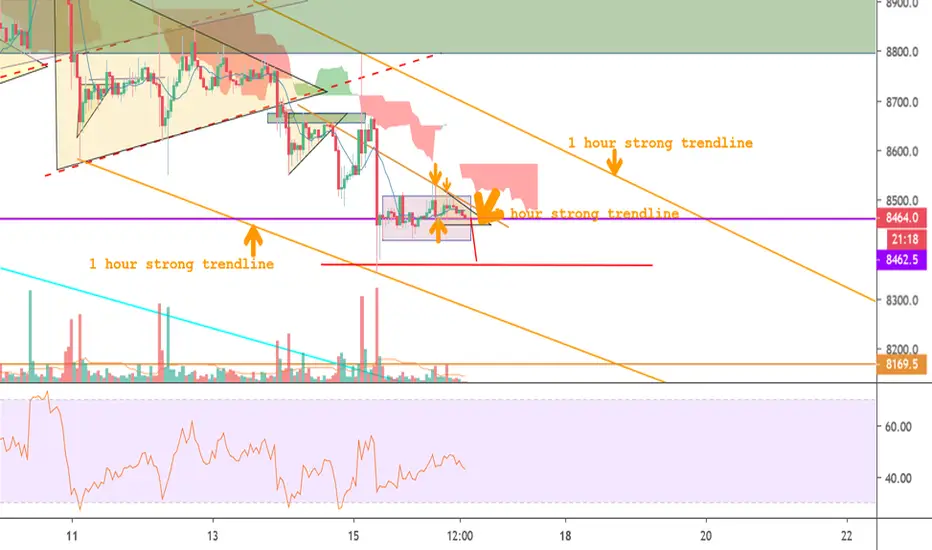
xbtusd 1hr chart followup to my last share. See the Big Picture!A follow up / zoom out/ see the picture view of what I was describing in my last share about IF Bitcoin breaks low to the bottom of a large decending wedge
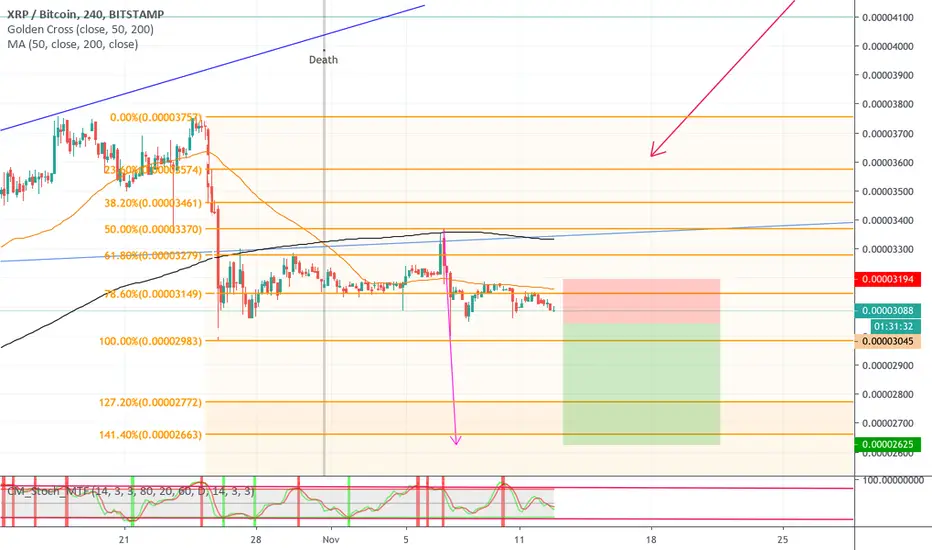
XRP/BTC Opportunity of trade (13,79% - R/R: 2.82) SHORT! Enjoy!Following the downtrend started with the first pulse and after the Fibonacci's retracement the downtrend should continue after the breakdown of the static support. The target is set following the Fibonacci trading rules.
Ride the trend & ENJOY!
Let me know what do you thing about. ;)
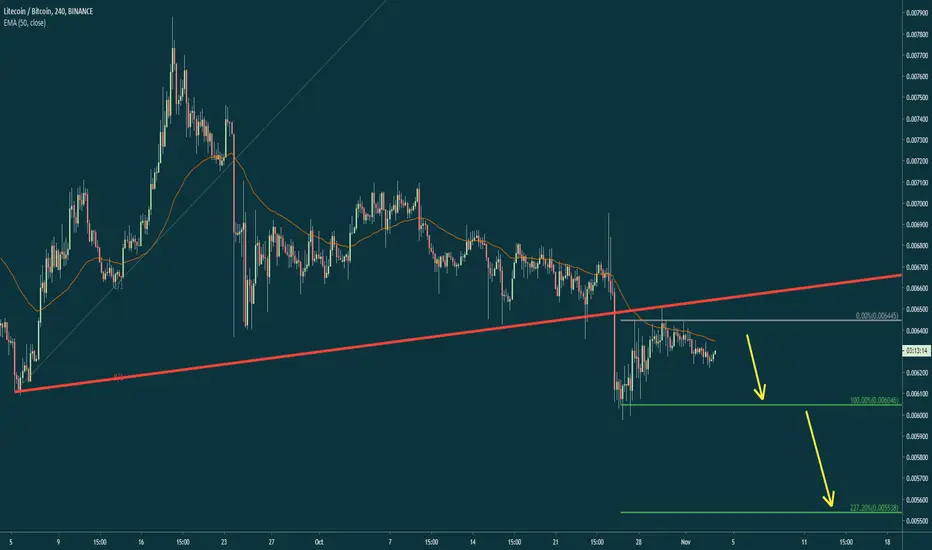
LTC/BTC downside targetsLTC is going down, along with most alts, on this chart there are few key levels to watch for as support.
Bitcoin (BTCUSDT) short.All description on the chart.
Please, don't forget to like and follow.
Thank you.
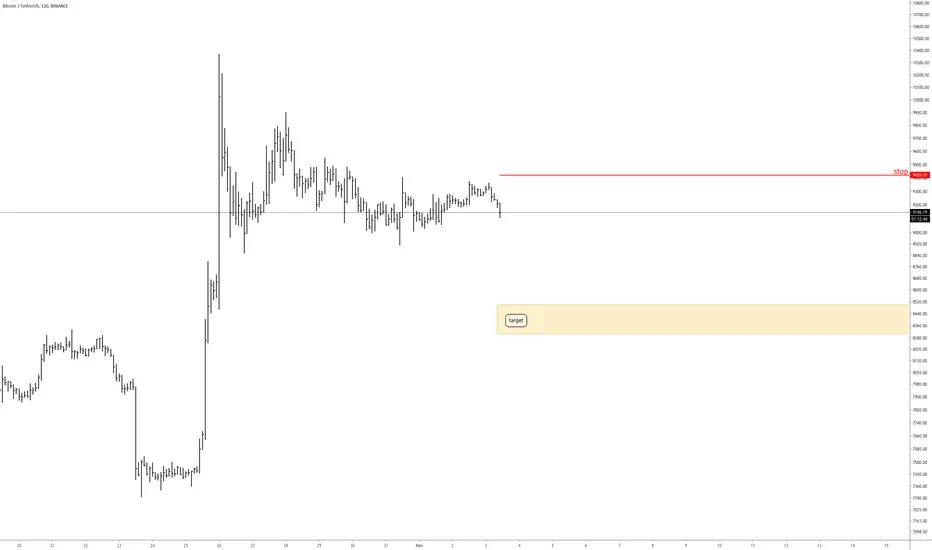
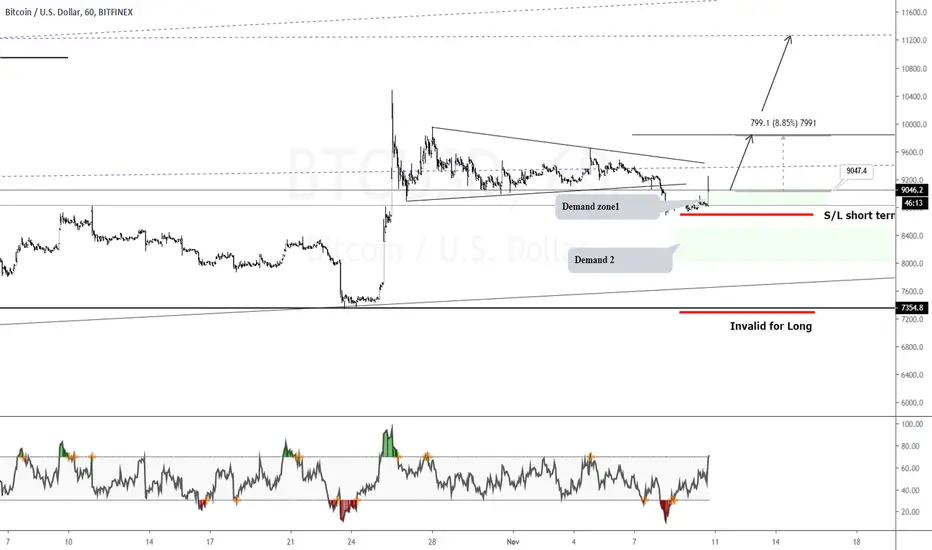
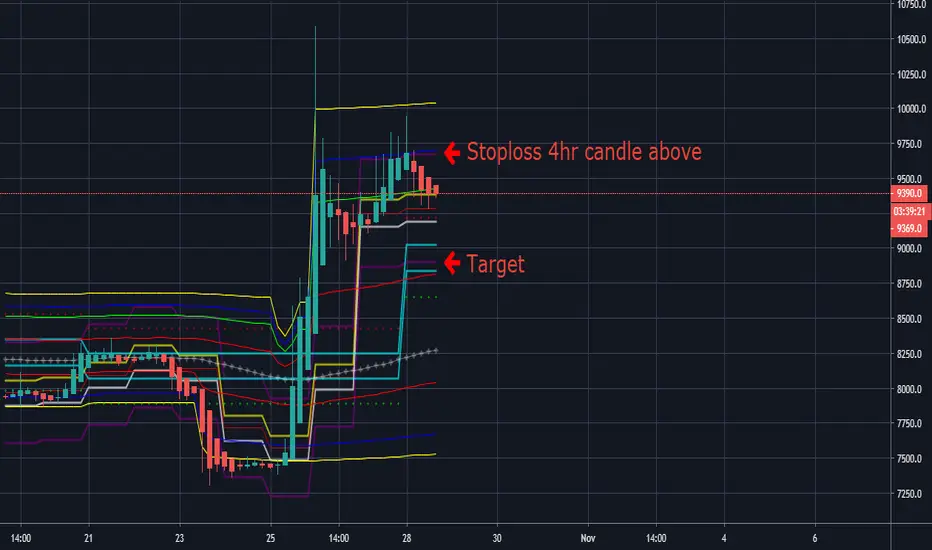
BTC/USD going back towards are between 8.600 to 8.400$!Yesterday price broke out from falling wedge. Big volumes haven't come in since and we are back on the same support. If price goes above 9.300$, this trade will not be active. I also think that if we fall, price should not go below 8K, but 8.5K seems reasonable to me.
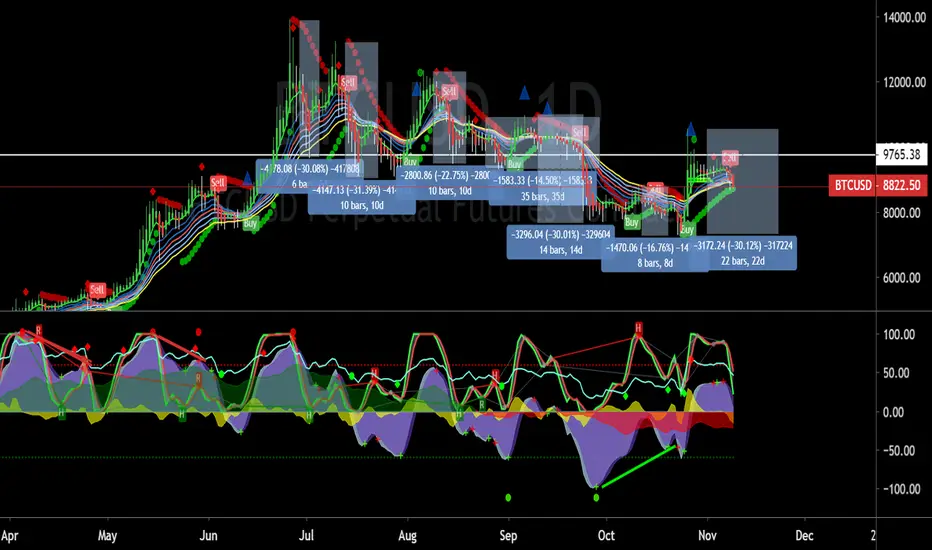
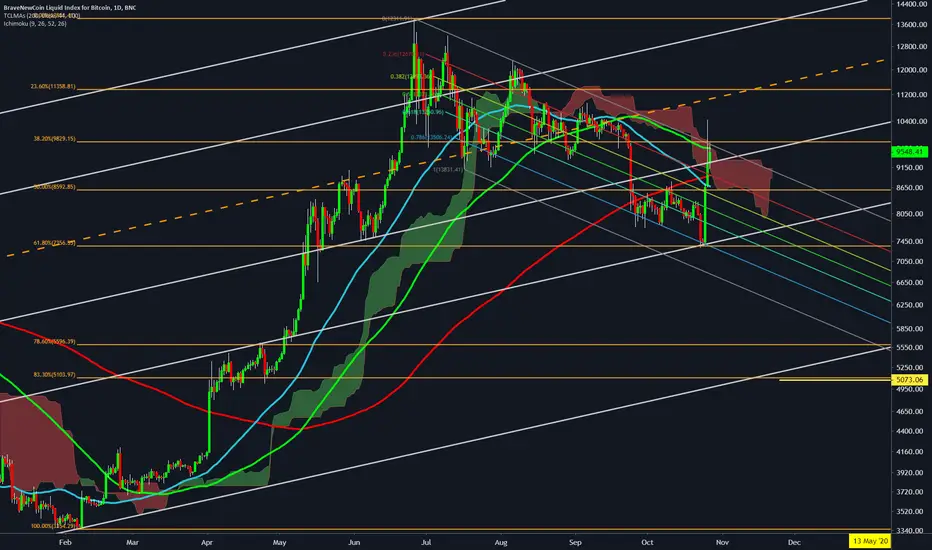
Big picture BTC / USD Bull or Bear ?Hi ,
I try to display a big picture of what is going on with BTC / USD. Looking at this chart you can clearly see that the bounce that we got should have been no surprise ! Cluster support was present and reversal signals were there on the micro trend , hope everyone was able to make some cheese.
Looking at the big picture , I am still seeing a downtrend though. I expect some consolidation and then a nasty rejection that will put as at the mean of the channel again. Keep in mind , traders act upon what the chart is showing us. I dont have a magic ball , if the reversal signs tell me to go long , i will go long , but for now I am still bearish.
/_\
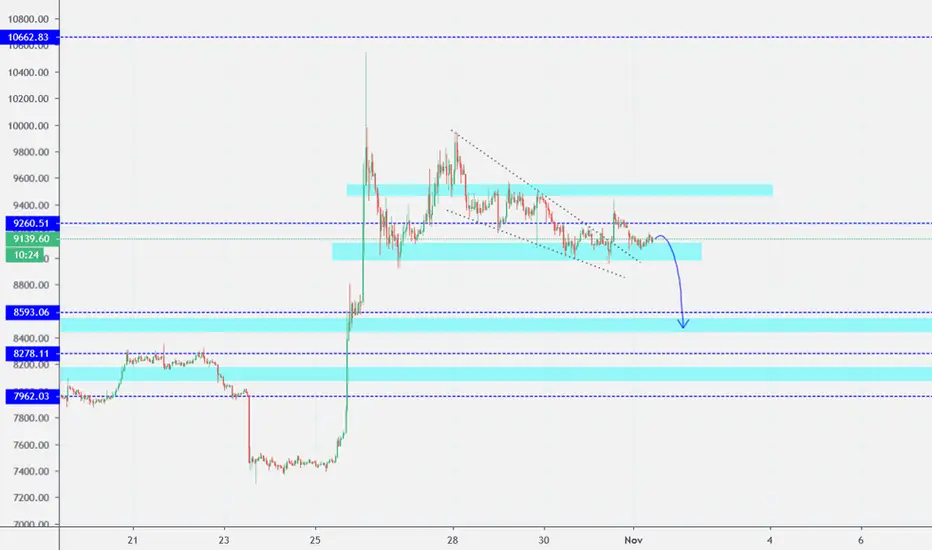
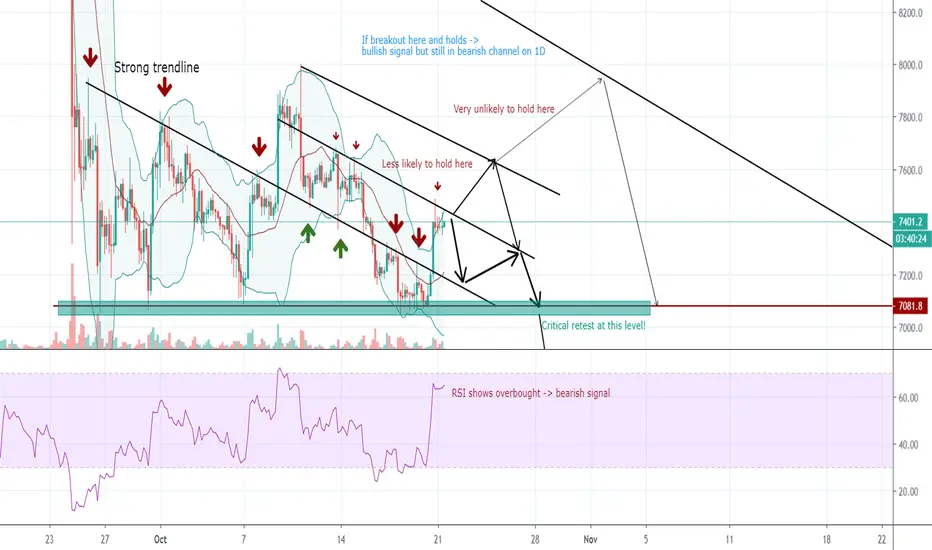
Bitcoin to stay above 7000 EUR till 28-30 octBitcoin is currently hanging around a resistance trendline.
I think it will struggle to hold above it.
If it breaks the resistance it will get stopped at around 7660EUR.
If it breaks the 7660EUR target it is not yet in a new bullish run.
As seen on the 1D chart and 3D chart there's a much stronger resistance trendline waiting to get tested.
There's a nice opportunity to go short at 7960EUR.
If it breaks the 7960EUR and holds it with nice volume it could sign into a new bullrun.
What is more likely is that 7050EUR gets tested and may have one jump from it.
Volume is slowly lowering and the bulls are slowly dissapearing.
probability to 7050EUR around 70%
probability to test 7650EUR around 30%
probability to test 7960EUR around 15%
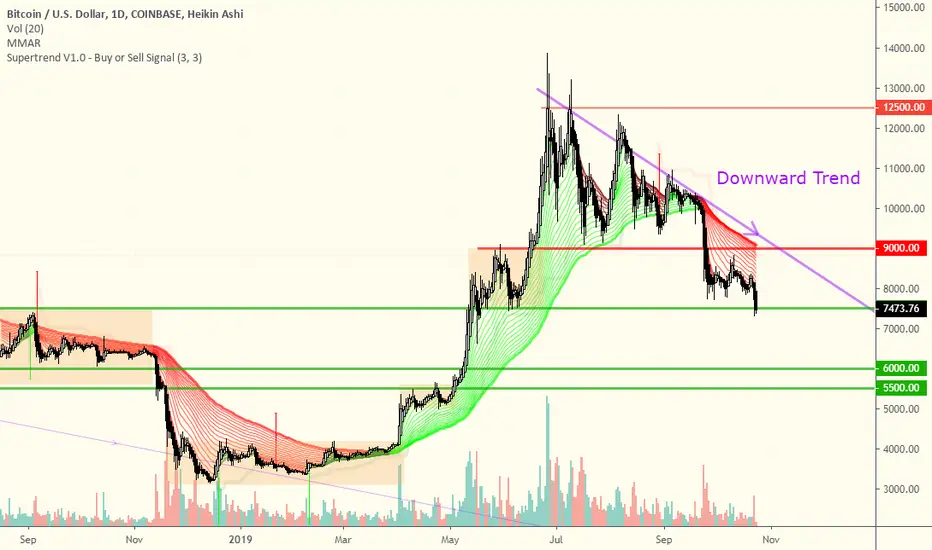
2019-OCT-24 Bitcoin downward trend continuesBitcoin downward trend continues
BTCUSD Broke 7500.00 support
Bitcoin is in BEAR control - Probably see $5500 Low!!Hi Beautiful peopleeee!!
Looking at the Daily Bitcoin chart, you can see a big bear with us here. I would say the army bears!. My reasons are:
1. BTC did break out from descending triangle and now become a big descending channel. Someone may think BTC is building a Falling wadge, but I do not think so because both MACD and RSI is building descending channel as well which has no positive divergence with it yet.
2. BTC has stayed below 21 weekly EMA, 21 Daily EMA and 200 Daily EMA for almost 3 weeks and it did test and got rejection from those 3 EMA. This shows BTC is in the bear control zone.
3. After BTC came down from $10000, it is building a possible bear flag.
From my reasons, I think it is a opportunity for all of beautiful people here to go Short. This action need to be confirmed by breaking previous low $7711 and then my idea will fit in. The first target would be at Fibonacci retracement 0.618 around $7200 and my second target would be at $5500 because it is Fibonacci retracement 0.786 and it also related to support line of descending channel, support uptrend line from low $3000 as well as the target of bear flag.
However, we cannot control the market so we should let the market come to us. Therefore, if Bitcoin goes up and stay above 200 daily EMA, I will change my mind and cancel my idea of bearish view.
***** THIS INFORMATION IS MY IDEA AND IS NOT RECOMMENDATION TO BUY OR SELL. IT IS TO BE USED FOR EDUCATIONAL PURPOSES ONLY. ******

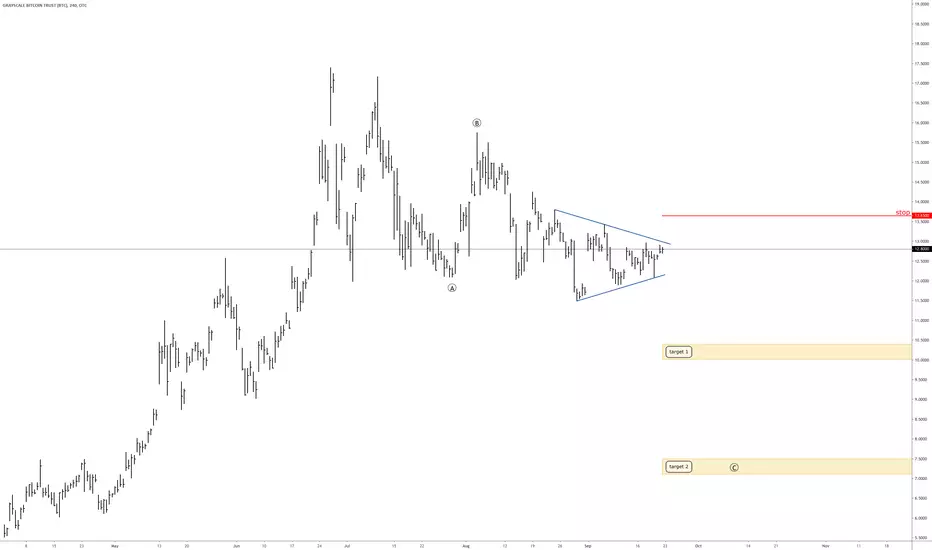
Bitcoin (GBTC) short. (Instead of flying to the moon).All description on the chart.
Please, don't forget to like and follow.
Thank you.
Bitcoin - Short - Range Broken - Downward MomentumBitcoin had been range bound since it broke $8000 on the 25.09 but having failed to break the resistance level at $8571 it has now gained downward momentum breaking $7500. We now have greater conviction that the prices will head towards $6000 in particular as Facebook is facing regulatory scrutiny regarding it's Libra cryptocurrency project.