BITCOIN BEARS ARE GAINING STRENGTH|SHORT
Hello, Friends!
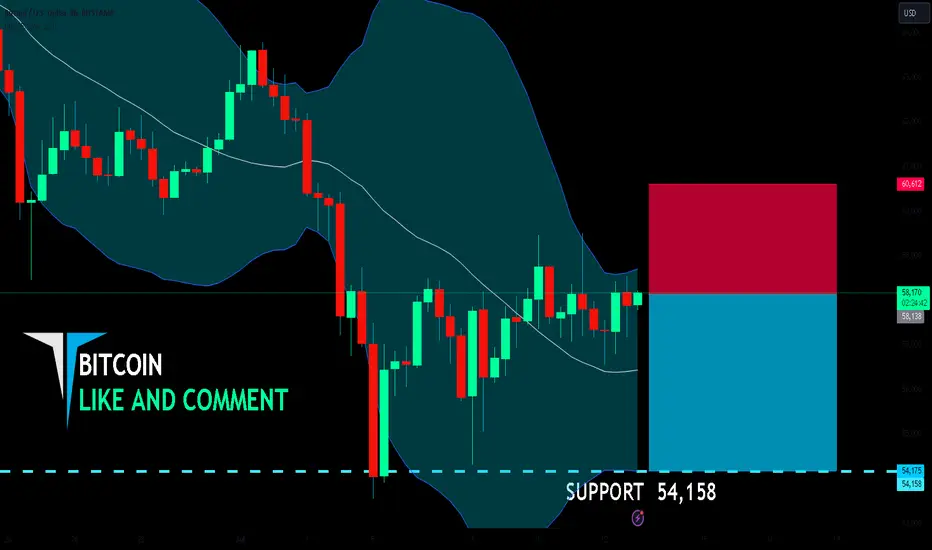
BITCOIN pair is in the downtrend because previous week’s candle is red, while the price is evidently rising on the 9H timeframe. And after the retest of the resistance line above I believe we will see a move down towards the target below at 54,158 because the pair is overbought due to its proximity to the upper BB band and a bearish correction is likely.
✅LIKE AND COMMENT MY IDEAS✅
Bitcoin-short
BITCOIN Will Fall! Short!
Take a look at our analysis for BITCOIN.
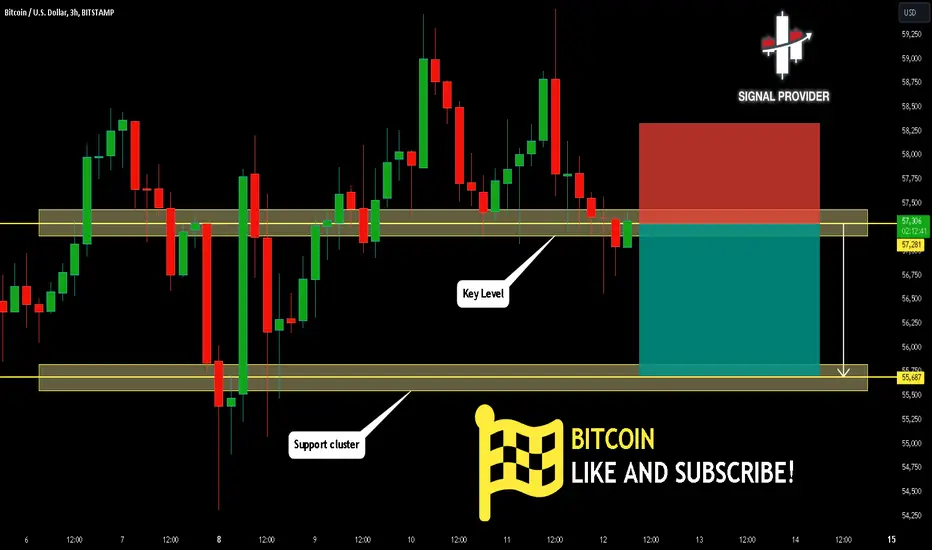
Time Frame: 3h
Current Trend: Bearish
Sentiment: Overbought (based on 7-period RSI)
Forecast: Bearish
The price is testing a key resistance 57,281.
Taking into consideration the current market trend & overbought RSI, chances will be high to see a bearish movement to the downside at least to 55,687 level.
P.S
The term oversold refers to a condition where an asset has traded lower in price and has the potential for a price bounce.
Overbought refers to market scenarios where the instrument is traded considerably higher than its fair value. Overvaluation is caused by market sentiments when there is positive news.
Like and subscribe and comment my ideas if you enjoy them!
BITCOIN Will Go Lower! Sell!
Take a look at our analysis for BITCOIN.
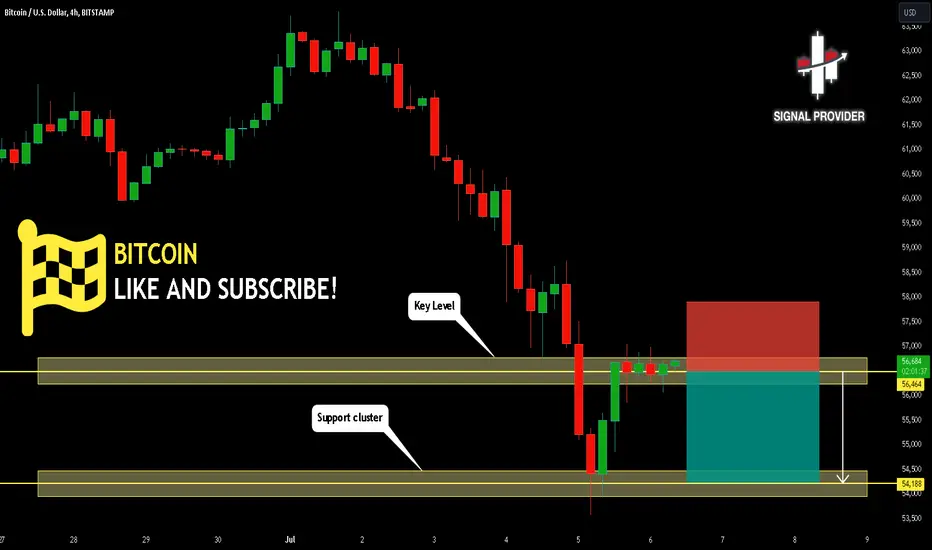
Time Frame: 4h
Current Trend: Bearish
Sentiment: Overbought (based on 7-period RSI)
Forecast: Bearish
The market is approaching a key horizontal level 56,464.
Considering the today's price action, probabilities will be high to see a movement to 54,188.
P.S
We determine oversold/overbought condition with RSI indicator.
When it drops below 30 - the market is considered to be oversold.
When it bounces above 70 - the market is considered to be overbought.
Like and subscribe and comment my ideas if you enjoy them!
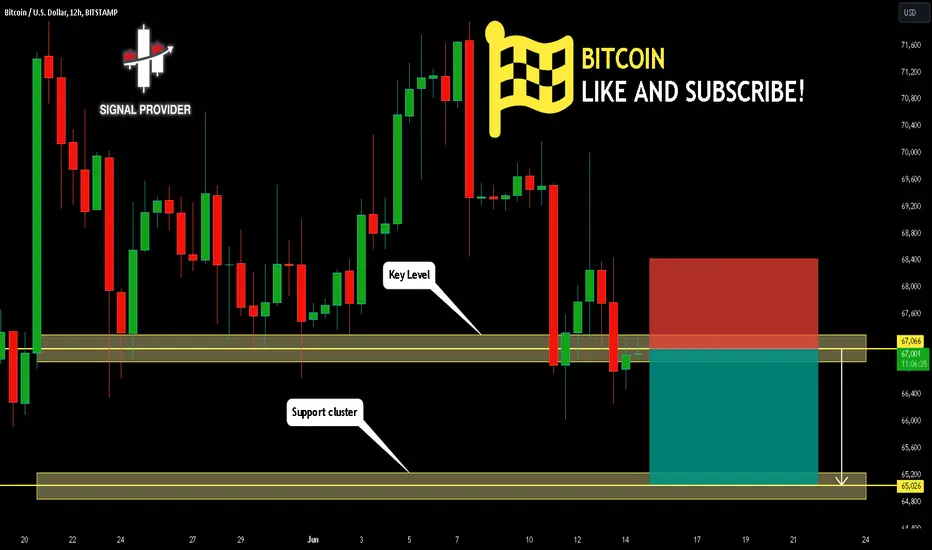
BITCOIN Will Go Down From Resistance! Short!
Here is our detailed technical review for BITCOIN.
Time Frame: 12h
Current Trend: Bearish
Sentiment: Overbought (based on 7-period RSI)
Forecast: Bearish
The market is testing a major horizontal structure 67,066.
Taking into consideration the structure & trend analysis, I believe that the market will reach 65,026 level soon.
P.S
Please, note that an oversold/overbought condition can last for a long time, and therefore being oversold/overbought doesn't mean a price rally will come soon, or at all.
Like and subscribe and comment my ideas if you enjoy them!
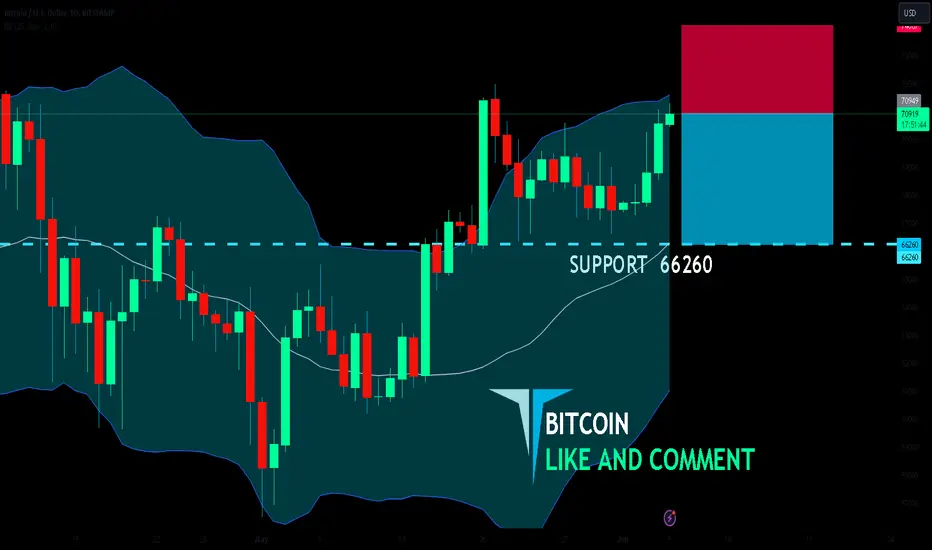
BITCOIN SENDS CLEAR BEARISH SIGNALS|SHORT
Hello,Friends!
Bearish trend on BITCOIN, defined by the red colour of the last week candle combined with the fact the pair is overbought based on the BB upper band proximity, makes me expect a bearish rebound from the resistance line above and a retest of the local target below at 66260.
✅LIKE AND COMMENT MY IDEAS✅
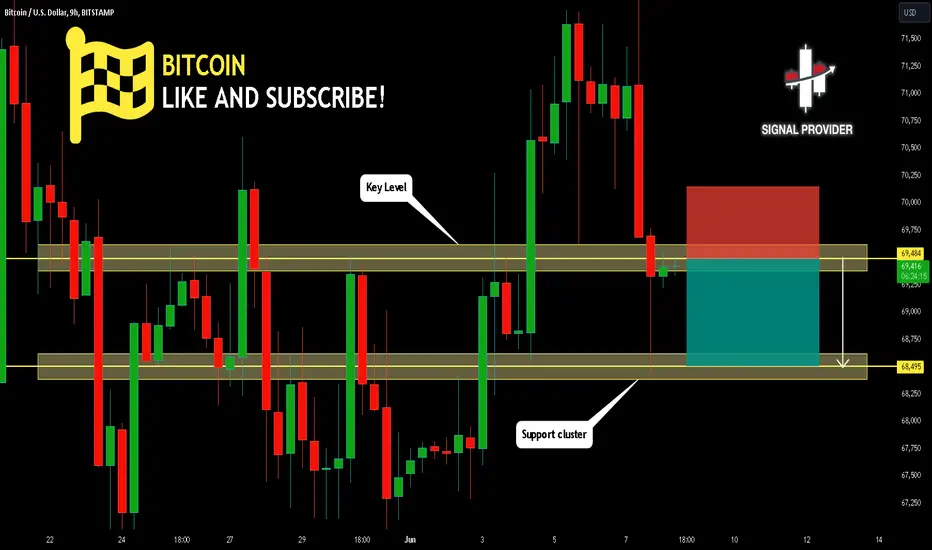
BITCOIN Will Go Down! Short!
Here is our detailed technical review for BITCOIN.
Time Frame: 9h
Current Trend: Bearish
Sentiment: Overbought (based on 7-period RSI)
Forecast: Bearish
The market is on a crucial zone of supply 69,484.
The above-mentioned technicals clearly indicate the dominance of sellers on the market. I recommend shorting the instrument, aiming at 68,495 level.
P.S
The term oversold refers to a condition where an asset has traded lower in price and has the potential for a price bounce.
Overbought refers to market scenarios where the instrument is traded considerably higher than its fair value. Overvaluation is caused by market sentiments when there is positive news.
Like and subscribe and comment my ideas if you enjoy them!
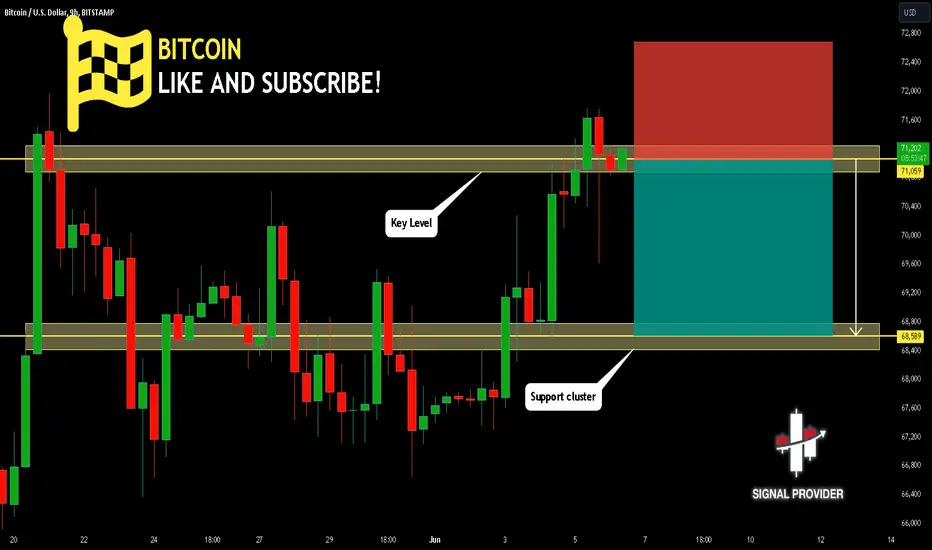
BITCOIN Will Go Lower! Sell!
Please, check our technical outlook for BITCOIN.
Time Frame: 9h
Current Trend: Bearish
Sentiment: Overbought (based on 7-period RSI)
Forecast: Bearish
The market is trading around a solid horizontal structure 71,059.
The above observations make me that the market will inevitably achieve 68,589 level.
P.S
The term oversold refers to a condition where an asset has traded lower in price and has the potential for a price bounce.
Overbought refers to market scenarios where the instrument is traded considerably higher than its fair value. Overvaluation is caused by market sentiments when there is positive news.
Like and subscribe and comment my ideas if you enjoy them!
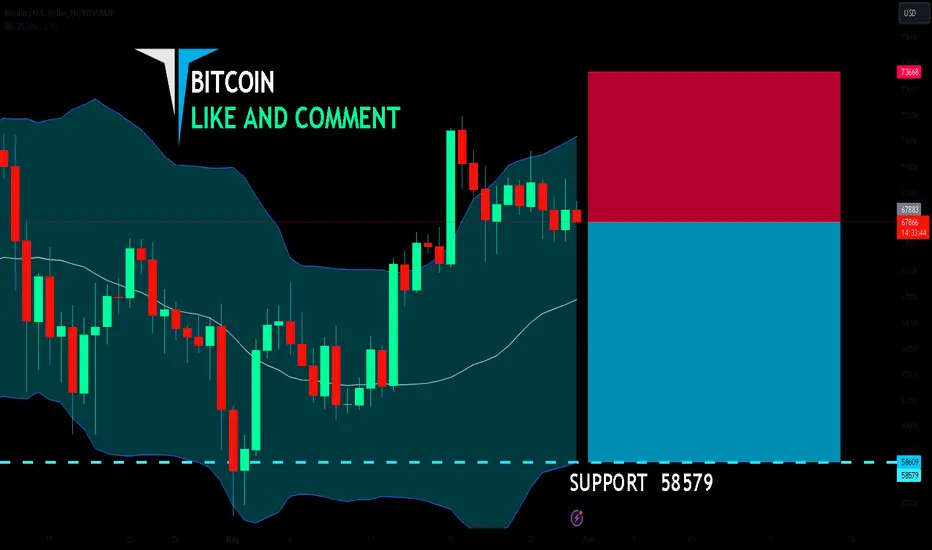
BITCOIN BEARS WILL DOMINATE THE MARKET|SHORT
Hello,Friends!
BITCOIN pair is trading in a local uptrend which we know by looking at the previous 1W candle which is green. On the 1D timeframe the pair is going up too. The pair is overbought because the price is close to the upper band of the BB indicator. So we are looking to sell the pair with the upper BB line acting as resistance. The next target is 58579 area.
✅LIKE AND COMMENT MY IDEAS✅
Bitcoin Big Sell off!I hope you guys enjoyed the video; if you have any questions or comments feel free to comment down below!

Bitcoin Monthly Close!I hope you guys enjoyed the video; if you have any questions or comments feel free to ask!

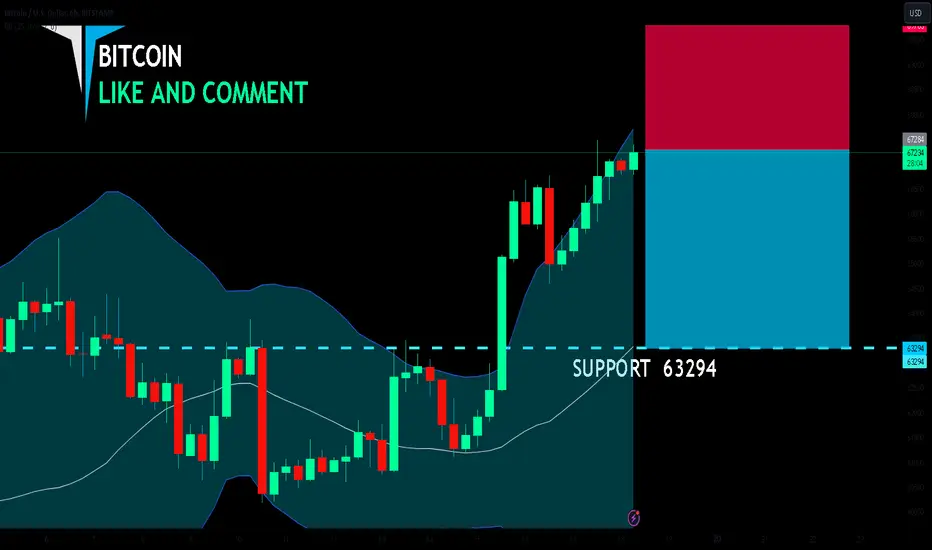
BITCOIN SHORT FROM RESISTANCE
Hello,Friends!
BITCOIN pair is in the uptrend because previous week’s candle is green, while the price is clearly rising on the 6H timeframe. And after the retest of the resistance line above I believe we will see a move down towards the target below at 63294 because the pair overbought due to its proximity to the upper BB band and a bearish correction is likely.
✅LIKE AND COMMENT MY IDEAS✅
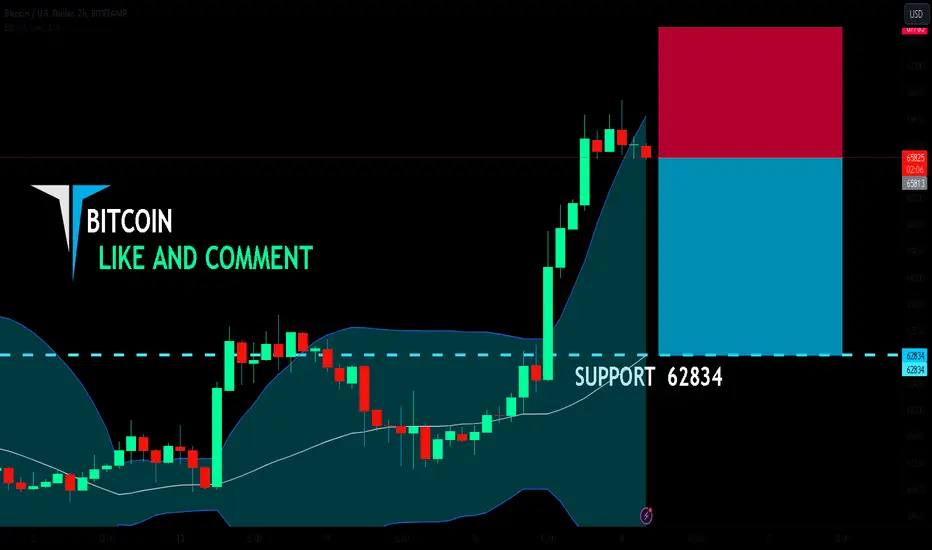
BITCOIN BEARS ARE STRONG HERE|SHORT
Hello,Friends!
BITCOIN pair is in the uptrend because previous week’s candle is green, while the price is clearly rising on the 2H timeframe. And after the retest of the resistance line above I believe we will see a move down towards the target below at 62834 because the pair overbought due to its proximity to the upper BB band and a bearish correction is likely.
✅LIKE AND COMMENT MY IDEAS✅
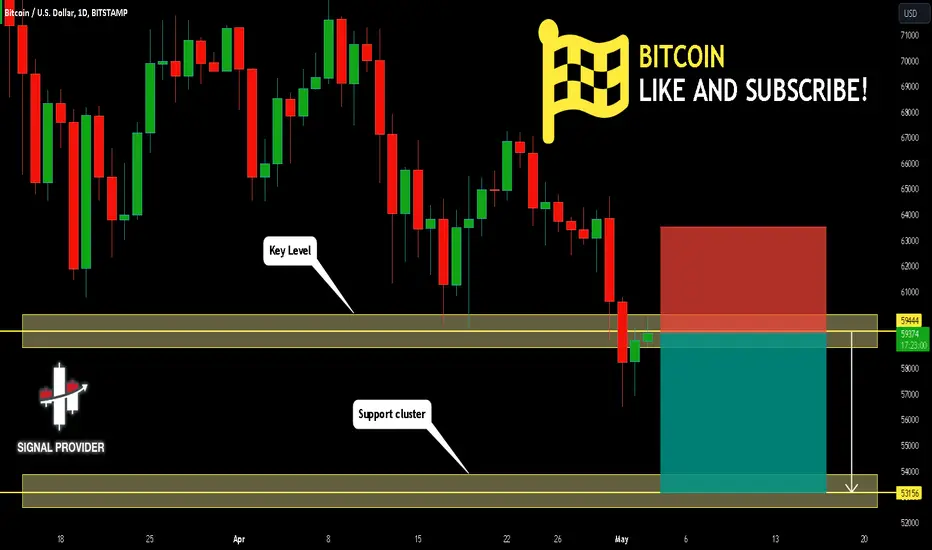
BITCOIN Will Go Lower! Short!
Here is our detailed technical review for BITCOIN.
Time Frame: 1D
Current Trend: Bearish
Sentiment: Overbought (based on 7-period RSI)
Forecast: Bearish
The market is on a crucial zone of supply 59444.
The above-mentioned technicals clearly indicate the dominance of sellers on the market. I recommend shorting the instrument, aiming at 53156 level.
P.S
We determine oversold/overbought condition with RSI indicator.
When it drops below 30 - the market is considered to be oversold.
When it bounces above 70 - the market is considered to be overbought.
Like and subscribe and comment my ideas if you enjoy them!
BITCOIN ENTERING INTO A BEAR MARKET? Bitcoin has finally broken below 60k and we are starting to see our bull trend get reversed!

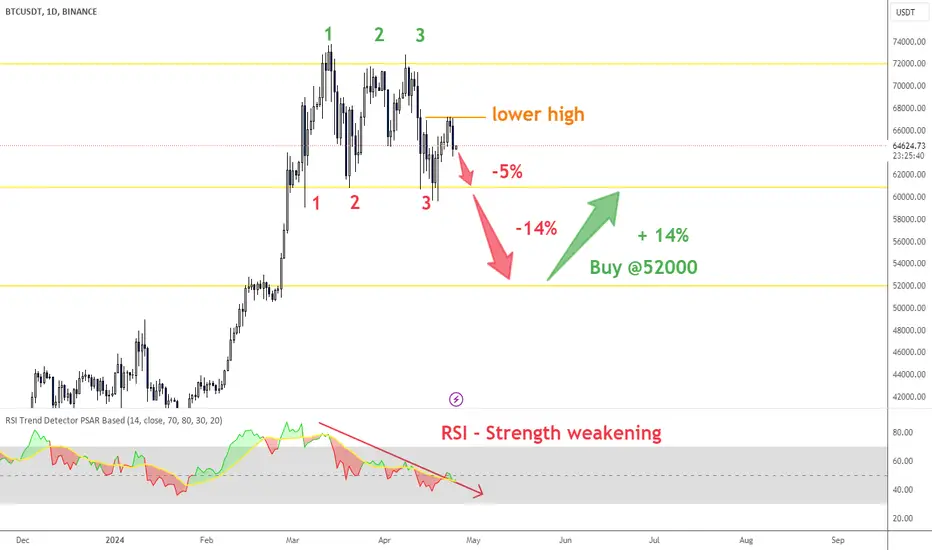
Bitcoin - SELLAfter a massive gain looks like Bitcoin can do some retracing
- Had made 3 high touches but did not break
- Had made 3 low touches but did not break
- Lower High in the range
SELL now to go down to Support for 5% , then holding to 52000
Consider BUY @ 52000 for a quick gain +14%
BITCOIN BEARS ARE STRONG HERE|SHORT
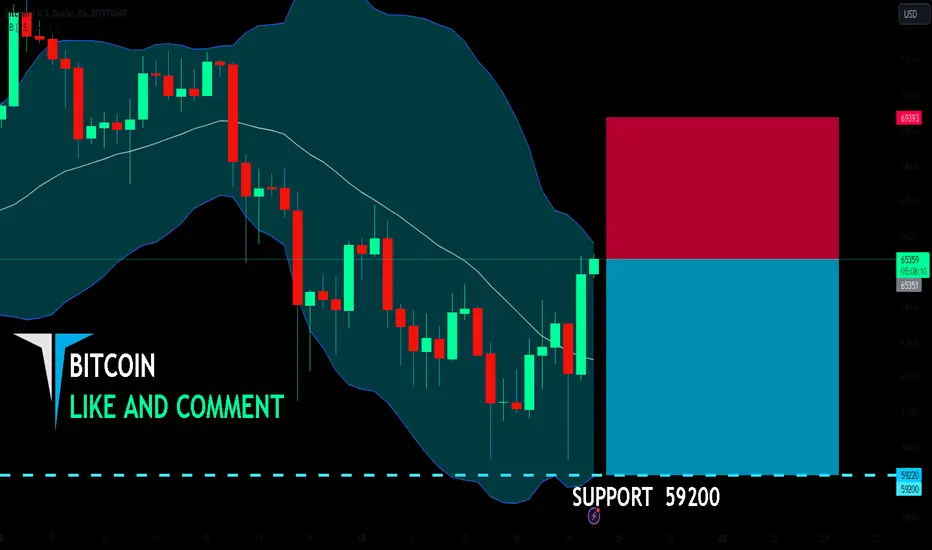
Hello,Friends!
Bearish trend on BITCOIN, defined by the red colour of the last week candle combined with the fact the pair is overbought based on the BB upper band proximity, makes me expect a bearish rebound from the resistance line above and a retest of the local target below at 59200.
✅LIKE AND COMMENT MY IDEAS✅
BITCOIN MARKET CRASH TA! TIME TO BUY?I hope you guys enjoyed the video; if you have any questions; feel free to comment down below!

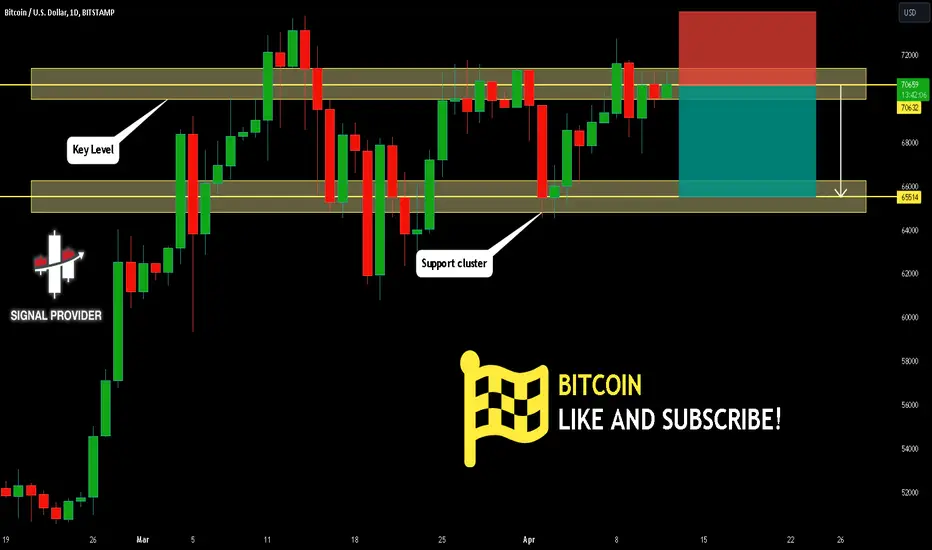
BITCOIN Will Go Lower From Resistance! Sell!
Here is our detailed technical review for BITCOIN.
Time Frame: 1D
Current Trend: Bearish
Sentiment: Overbought (based on 7-period RSI)
Forecast: Bearish
The market is testing a major horizontal structure 70632.
Taking into consideration the structure & trend analysis, I believe that the market will reach 65514 level soon.
P.S
The term oversold refers to a condition where an asset has traded lower in price and has the potential for a price bounce.
Overbought refers to market scenarios where the instrument is traded considerably higher than its fair value. Overvaluation is caused by market sentiments when there is positive news.
Like and subscribe and comment my ideas if you enjoy them!
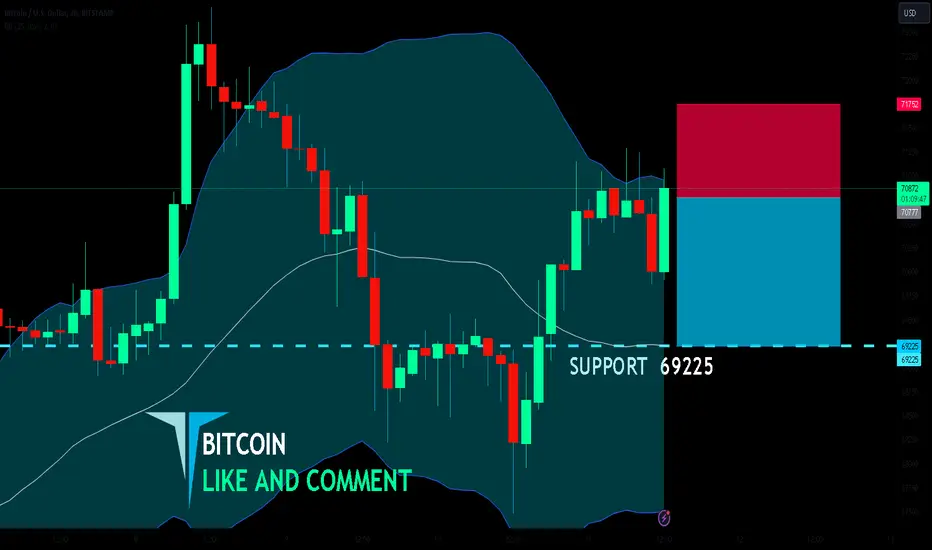
BITCOIN SELLERS WILL DOMINATE THE MARKET|SHORT
Hello,Friends!
BITCOIN uptrend evident from the last 1W green candle makes short trades more risky, but the current set-up targeting 69225 area still presents a good opportunity for us to sell the pair because the resistance line is nearby and the BB upper band is close which indicates the overbought state of the BITCOIN pair.
✅LIKE AND COMMENT MY IDEAS✅
BITCOIN SHORT FROM RESISTANCE
Hello,Friends!
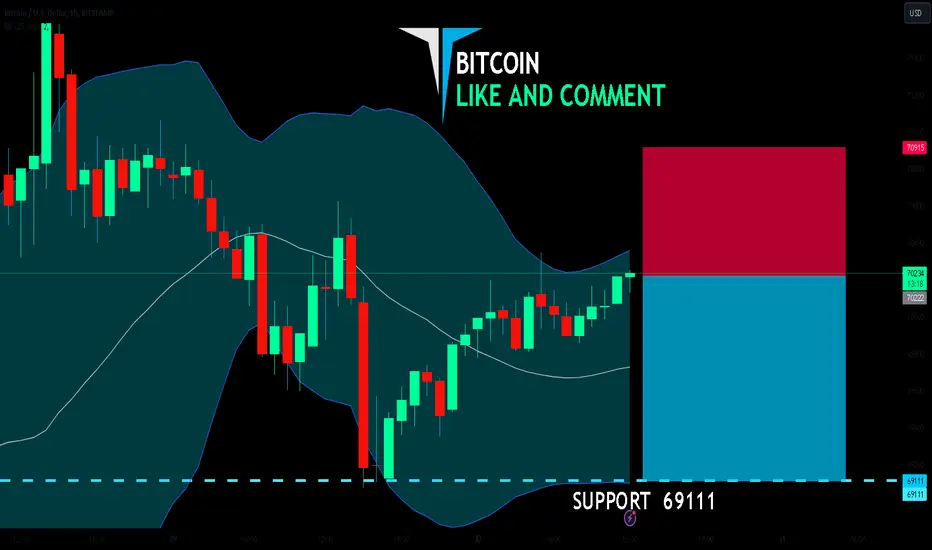
BITCOIN pair is trading in a local uptrend which we know by looking at the previous 1W candle which is green. On the 1H timeframe the pair is going up too. The pair is overbought because the price is close to the upper band of the BB indicator. So we are looking to sell the pair with the upper BB line acting as resistance. The next target is 69111 area.
✅LIKE AND COMMENT MY IDEAS✅
🌙 Beware the Bearmoon: Bitcoin's Rising Wedge Signals $56-57k 📈 Bitcoin has recently exhibited a rising wedge pattern on the 4-hour chart, indicating a potential correction in the near term. This pattern is characterized by converging trendlines forming higher highs and higher lows, signaling a weakening momentum and a potential reversal. 🔍
💲 As of the time of writing, Bitcoin is trading at $68,200, and based on the formation of the rising wedge, a measured move suggests a correction towards the $56,000 to $57,000 range. This projection is derived by measuring the widest part of the wedge and extending it downwards from the breakout point. 📉
🌙 Furthermore, tomorrow marks a new moon, which historically has shown a correlation with downward price action in the cryptocurrency markets, colloquially referred to as "bearmoon." This phenomenon is often attributed to a combination of factors including options expirations and human psychology, leading to increased selling pressure and market volatility. 🐻
📊 Adding to the confluence of indicators, daily indicators also support the notion of a correction towards the projected range. Combining technical analysis with lunar cycle patterns and other indicators strengthens the case for a potential downward movement in Bitcoin's price. 📉
💼 Traders and investors should monitor price action closely, keeping in mind the identified levels and factors influencing market sentiment. Risk management strategies should be implemented to mitigate potential losses in the event of adverse price movements.🛡️

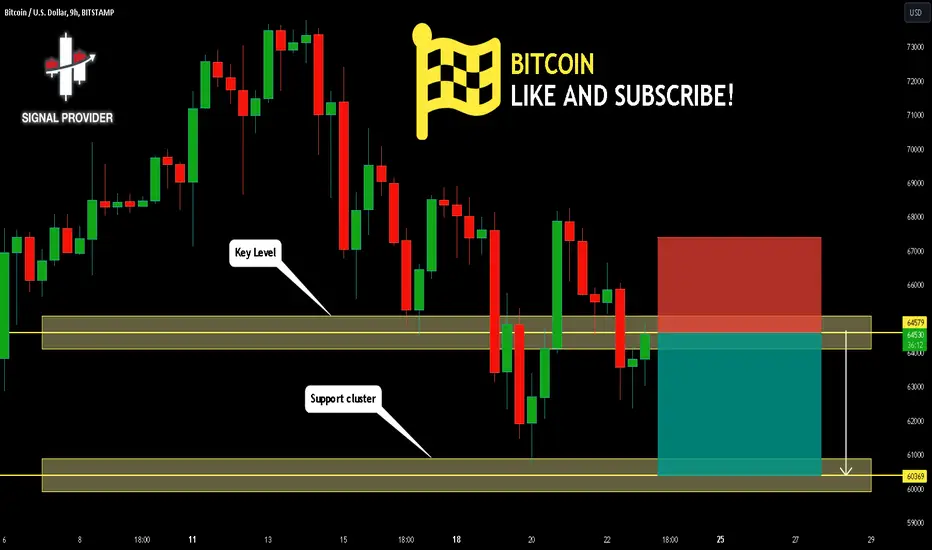
BITCOIN Will Go Down! Sell!
Please, check our technical outlook for BITCOIN.
Time Frame: 9h
Current Trend: Bullish
Sentiment: Oversold (based on 7-period RSI)
Forecast: Bullish
The market is testing a major horizontal structure 64579.
Taking into consideration the structure & trend analysis, I believe that the market will reach 60369 level soon.
P.S
Please, note that an oversold/overbought condition can last for a long time, and therefore being oversold/overbought doesn't mean a price rally will come soon, or at all.
Like and subscribe and comment my ideas if you enjoy them!
BITCOIN, is the ETF approval a sell on the news event?Welcome back,
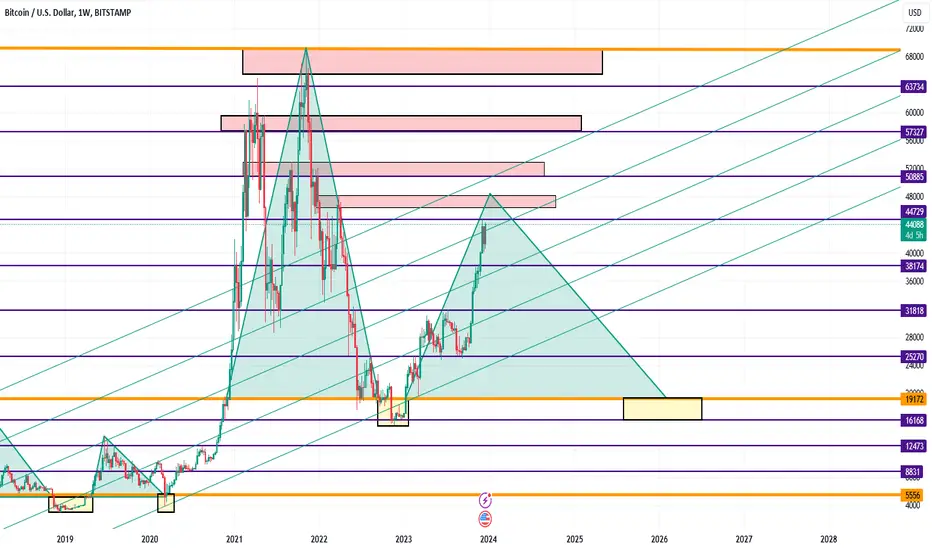
some times it's nice to just browse through the charts and find interesting patterns. There is no guaranty that chart history repeats it self, but, there is a chance to. In this chart I'm observing a pullback to 20k-30k area for the bitcoin in case the ETF approval which everyone is waiting for within the start of 2024 will be a sell on the news event.
First of all, I am absolutely bullish on BTC within the next years. But at this stage of trend I don't want to get in a long position anymore. There had been many chances earlier this year and the risk of profit taking is too high now. Also the fundamentals are already anticipated from the market for weeks now.
What can you see on the chart? Most important are the orange lines, marking the bottoms of a cycle. With purple lines I marked the most significant price actions, just every 12,5% for the actual cycle and 25% for the past cycle. The price reacted similar in both cycles and IF history wants to repeat itself, we could see a very long correctional movement starting from around 48-50k back down to 20-30k.
Obviously you can't make good trades on the weekly chart, so this is just for observation and it's important to find structures on lower time frames to confirm the move.
Let me know what you think about Bitcoin. All opinions are respected here :)