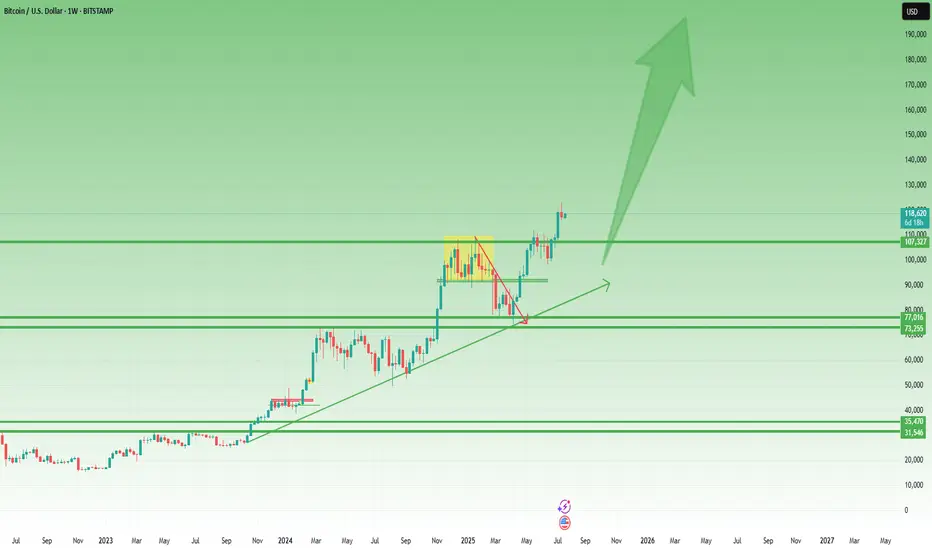
Bitcoin- 175-200k by year's endEvery major Bitcoin move over the last decade — whether a jaw-dropping bull run or a brutal crash — has shared one silent macro trigger.
It’s not the halving.
It’s not ETF hype.
It’s not Twitter sentiment or TikTok FOMO.
👉 It’s global liquidity.
And right now, this powerful force is expanding fast — the same setup that previously drove Bitcoin from $5K to $70K in under a year.
But here’s the twist: as of today, Bitcoin is already trading near $120,000, not $20K or 30k.
That means the engine is already roaring — and if this macro thesis holds, the next stop might just be $175,000-200.000 by year's end.
________________________________________
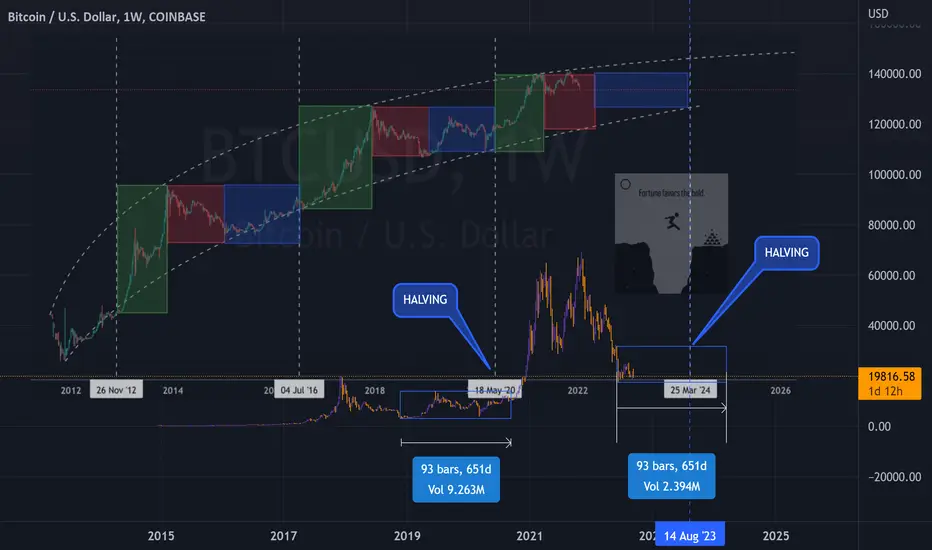
🧠 What Is Global Liquidity, Really?
Global liquidity = the total money sloshing around the financial system.
It’s often measured through M2 money supply, combining:
• Cash
• Checking/savings deposits
• Easily accessible liquid assets
The most comprehensive view comes from Global M2, which aggregates liquidity from 20 of the world’s largest central banks.
Right now, Global M2 is not just rising — it’s breaking to all-time highs.
And if history repeats itself, Bitcoin tends to follow this wave closely.
________________________________________
📅 Past Performance: Bitcoin and Liquidity Walk Hand in Hand
Let’s break it down:
• 2016–2017: Liquidity surges → BTC +5,000%
• 2020–2021: Post-COVID easing → BTC $5K to $69K
• 2018 & 2022: Liquidity dries up → BTC crashes ~70%
It’s a recurring pattern:
Liquidity drives the crypto cycle.
________________________________________
💡 Why Liquidity Moves: Interest Rates and Central Banks
Central banks control the tap.
• 🟢 Cut rates → Easier credit → More lending → More liquidity
• 🔴 Raise rates → Tighter credit → Less spending → Liquidity contraction
In 2022, the Fed tightened hard.
🧊 U.S. money supply shrank.
📉 Bitcoin fell from $70K to $15K.
But starting August 2023, the Fed paused, then pivoted.
Since then:
• 🟢 The U.S. M2 supply rebounded
• 🟢 Global M2 began expanding again
• 🟢 Over 64 global rate cuts were made in just six months — one of the fastest global easing cycles in history
The last time we saw this much cutting? 2020.
And we all know what happened to Bitcoin then.
U.S M2
________________________________________
🟢 Today’s Setup: The Engine Is Already Running
Fast forward to mid-July 2025:
Bitcoin is no longer at $30K — it’s already testing $120K.
Intraday highs have touched $123K, with a current consolidation zone between $117K–$120K.
This isn’t a "recovery rally" — we’re already in price discovery territory.
The question now becomes:
Is $150K and above next… or are we topping out?
________________________________________
📈 Charting the Path: Bitcoin vs Global M2
When we overlay Bitcoin price over global liquidity trends, one thing becomes crystal clear:
📊 Bitcoin tracks liquidity direction.
• When money supply expands, Bitcoin rallies.
• When money dries up, Bitcoin tanks.
Given that global M2 is at record highs, and liquidity conditions are easing globally, the chart suggests there’s still plenty of fuel in the tank.
And if we follow the same growth, Bitcoin could realistically reach $175,000 before 2026 kicks in.
________________________________________
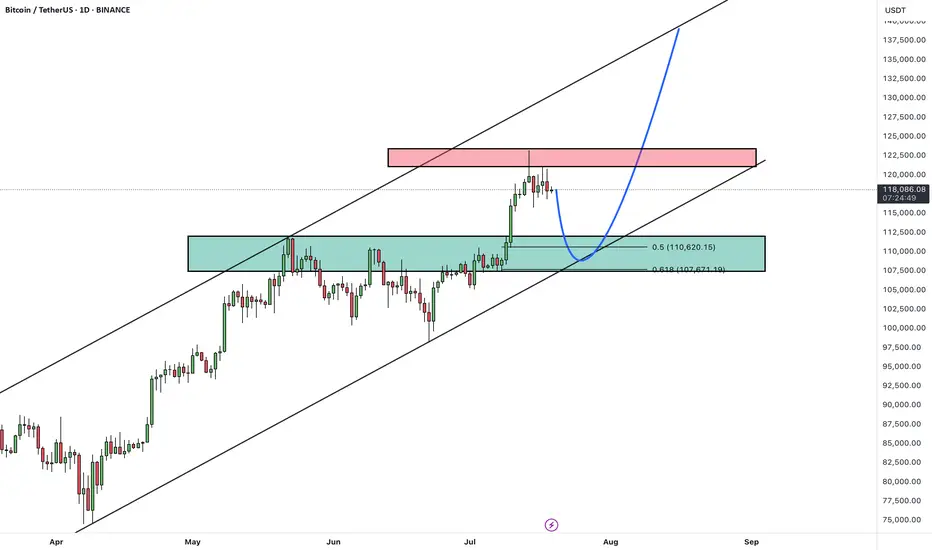
Technically:
As we can clearly see from the posted weekly chart, you don’t need to be an expert to recognize the strength of the current uptrend.
While last week printed a small bearish Pin Bar, this alone shouldn’t raise major concerns — especially considering the presence of multiple key support levels, starting from the 110K zone.
In the context of a strong and well-established trend, such candles often reflect normal short-term profit-taking, not a reversal.
🎯 Conclusion – Don’t Fight the Tide
This isn’t about hopium.
It’s not moon talk.
It’s about macro flows and monetary velocity.
Ignore the noise.
Watch what the central banks are doing.
Because Bitcoin moves not on wishful thinking, but on waves of liquidity — and the tide right now is rising fast.
Whether $175K comes by year-end, one thing is clear:
We are in the middle of a liquidity-driven expansion phase, and Bitcoin is already responding.
Stay focused, manage your risk, and don’t chase — ride the wave. 🌊
Bitcoin (Cryptocurrency)
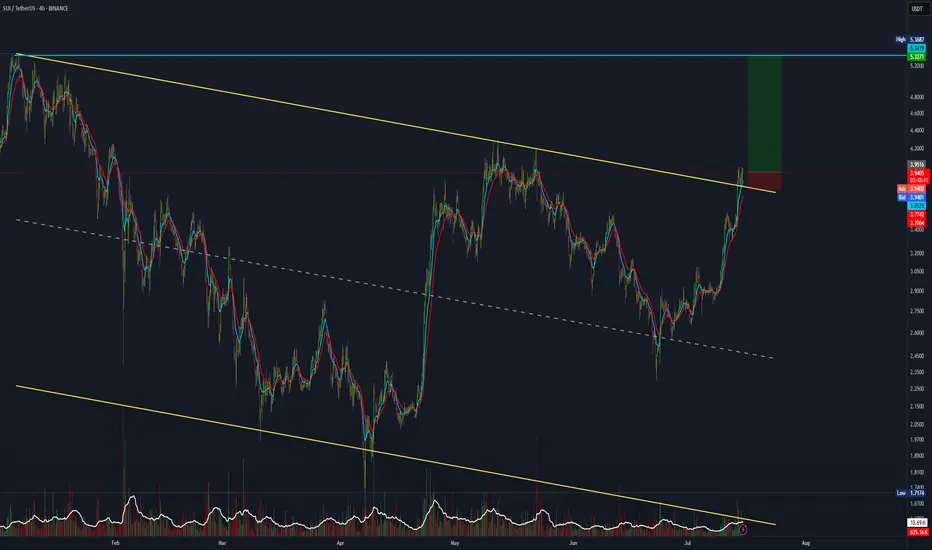
SUI trade setup with a 7:1 risk-to-reward ratio.SUI has broken out and retested the major channel. If you're bullish, this 7:1 R:R setup is worth considering.
Entry: 3.94
Stop Loss: 3.77
Target: 5.30.
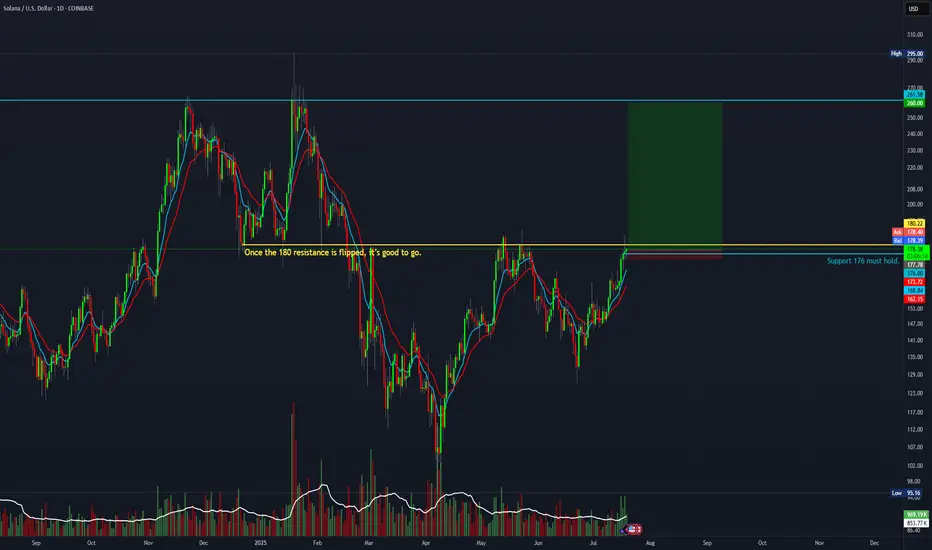
20:1 R:R for SolanaTaking a chance on this super high-risk setup with a 20:1 R:R before it takes off.
Entry: 177.78
Stop Loss: 173
Target: 260
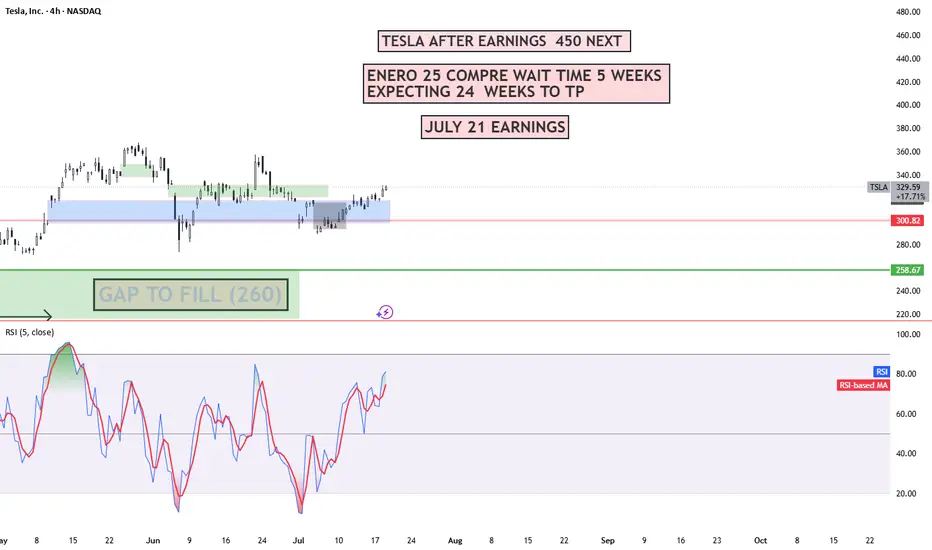
TESLA 400 BY END OF YEAR !! 5 REASONS !!!
1. **Strong Earnings and Revenue Growth**
Tesla has a track record of exceeding earnings expectations. If the company reports robust financial results in Q3 and Q4—driven by higher vehicle deliveries and growth in its energy storage business—investors are likely to gain confidence. This could push the stock price upward as Tesla demonstrates its ability to scale profitably.
2. **Advancements in Autonomous Driving**
Tesla’s Full Self-Driving (FSD) technology is a game-changer in the making. If Tesla achieves significant progress toward Level 4 or 5 autonomy—where vehicles can operate with little to no human intervention—it could position the company as a leader in transportation innovation. Such a breakthrough would likely excite investors and drive the stock price higher.
3. **Battery Technology Innovation**
Tesla is working on developing cheaper, longer-lasting batteries, which could lower production costs and improve profit margins. If the company announces advancements in battery tech—such as improvements from its Battery Day initiatives or new manufacturing processes—it could signal a competitive edge, boosting the stock to $400.
4. **Global Expansion and Production Increases**
Tesla’s new Gigafactories in Texas and Berlin are ramping up production, while potential market entries like India loom on the horizon. Increased output and access to new customers signal strong growth potential. If Tesla successfully scales its operations, investors may see this as a reason to push the stock price toward $400.
5. **Favorable Market Trends and Government Policies**
The global shift toward sustainable energy and electric vehicles (EVs) is accelerating, supported by government incentives and regulations favoring clean energy. If EV adoption continues to rise and policies provide a tailwind—such as subsidies or stricter emissions standards—Tesla, as an EV leader, could see increased demand and a higher stock valuation.
While reaching $400 by year-end is ambitious, Tesla’s strong brand, innovative edge, and leadership under Elon Musk could make it achievable. That said, risks like market volatility and growing competition from other EV makers could pose challenges. If these five factors align, however, Tesla’s stock has a solid shot at hitting that target.
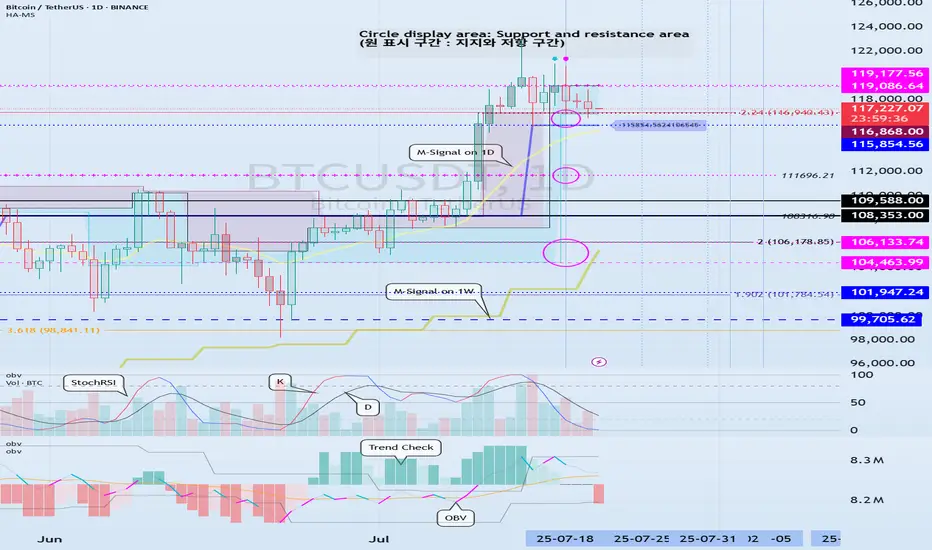
Support around 115854.56-116868.0 is the key
Hello, traders.
If you "Follow", you can always get the latest information quickly.
Have a nice day today.
-------------------------------------
(BTCUSDT 1D chart)
The DOM(60) indicator of the 1W chart is generated at the 119177.56 point, and the DOM(60) indicator of the 1D chart is generated at the 119086.64 point, and then shows a downward trend.
However, since the HA-High indicator is formed at the 115854.56 point, it is difficult to say that it has yet turned into a downward trend.
Accordingly, it is necessary to check whether it is supported in the HA-High ~ DOM(60) section.
The next volatility period is expected to occur around July 25 (July 24-26).
However, the important volatility period is expected to be around August 2-5 (maximum August 1-6), so we need to look at what kind of movement it shows as it passes through the volatility period that will occur in the future.
-
Since the StochRSI indicator has entered the oversold zone, there is a possibility that the decline will be restricted.
Therefore, the key is whether there is support around 115854.56-116868.0.
This is because if it falls below the HA-High indicator, there is a possibility that a downtrend will begin.
Also, since the M-Signal indicator on the 1D chart is rising around 115854.56, it can be seen as an important zone.
--------------------------------------------------
An indicator called Trend Check has been added to the OBV indicator.
This indicator is an indicator that comprehensively evaluates the StochRSI, PVT-MACD oscillator, and OBV indicators and expresses them in a column.
Accordingly, if the TC indicator rises from the 0 point, it can be interpreted that the buying force is dominant, and if it falls, the selling force is dominant.
Therefore, if it rises above 0, it is likely to show an upward trend, and if it falls below 0, it is likely to show a downward trend.
Also, if the TC indicator touches the highest point (6) or lowest point (-6), there is a high possibility that the trend will reverse, so you should think about a response plan for this.
-
Thank you for reading to the end.
I hope you have a successful trade.
--------------------------------------------------
- Here is an explanation of the big picture.
(3-year bull market, 1-year bear market pattern)
I will explain the details again when the bear market starts.
------------------------------------------------------
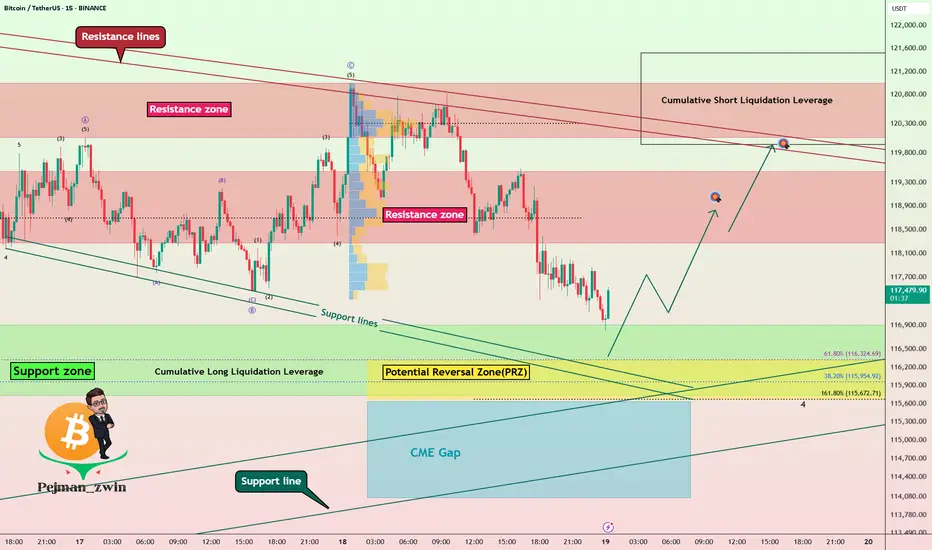
Bitcoin Technical Setup: Support Holds, Eyes on $118,600Bitcoin ( BINANCE:BTCUSDT ) moved as I expected in the previous ideas and finally completed the CME Gap($117,255-$116,675) in the last hours of the week. ( First Idea _ Second Idea )
Before starting today's analysis, it is important to note that trading volume is generally low on Saturday and Sunday , and we may not see a big move and Bitcoin will move in the range of $121,000 to $115,000 ( in the best case scenario and if no special news comes ).
Bitcoin is currently trading near the Support zone($116,900-$115,730) , Cumulative Long Liquidation Leverage($116,881-$115,468) , Potential Reversal Zone(PRZ) , and Support lines .
According to Elliott Wave theory , Bitcoin had a temporary pump after the " GENIUS stablecoin bill clears House and heads to Trump's desk " news, but then started to fall again, confirming the end of the Zigzag Correction(ABC/5-3-5) . Now we have to wait for the next 5 down waves or the corrective waves will be complicated .
I expect Bitcoin to rebound from the existing supports and rise to at least $118,600 . The second target could be the Resistance lines .
Do you think Bitcoin will fill the CME Gap($115,060-$114,947) in this price drop?
Cumulative Short Liquidation Leverage: $121,519-$119,941
Do you think Bitcoin can create a new ATH again?
Note: Stop Loss(SL)= $114,700
Please respect each other's ideas and express them politely if you agree or disagree.
Bitcoin Analyze (BTCUSDT), 15-minute time frame.
Be sure to follow the updated ideas.
Do not forget to put a Stop loss for your positions (For every position you want to open).
Please follow your strategy and updates; this is just my Idea, and I will gladly see your ideas in this post.
Please do not forget the ✅' like '✅ button 🙏😊 & Share it with your friends; thanks, and Trade safe.
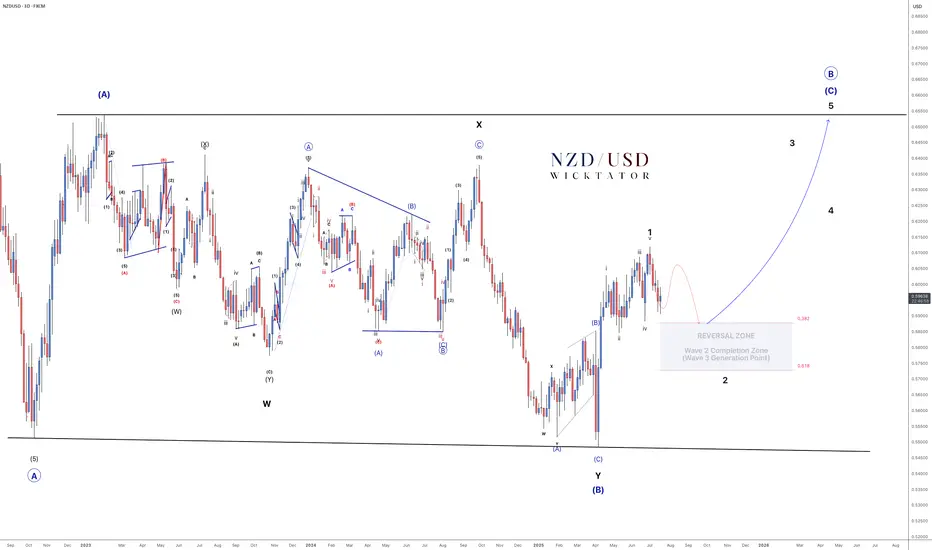
NZDUSD - Elliott Wave: High-Probability Reversal Zone Ahead!NZDUSD – Elliott Wave Roadmap
3Day Chart
Every move has been unfolding with precision — true to Elliott Wave Theory.
We're in the final leg of a massive A-B-C correction:
- Wave A and the complex Wave B (WXY) are complete.
- Wave C is now in play, targeting the highs of Wave A.
We’ve just seen a clean 5-wave advance (wave 1 leading diagonal).
Now expecting a classic ABC correction for wave 2, into our reversal zone (38.2–61.8% Fib).
🔍 Once price enters this zone, we’ll drop to lower timeframes and:
- Look for bullish confirmations (BOS, trendline break)
- Set entries with stops below corrective lows
- Targets: 0.63 (500 pips) and 0.65 (700 pips)
📌 Why is the buy zone so big?
It’s a higher timeframe zone. Once price enters, we zoom into lower timeframes for precise entries. The zone simply tells us when to focus, not where to blindly buy.
This is the Wave 3 generation point — and that’s where the real move begins.
Plan your trade. Watch for the setup. Execute with confidence.
Goodluck and as always, Trade Safe!
NZDUSD 12H Chart - Looking for this ABC correction for wave 2
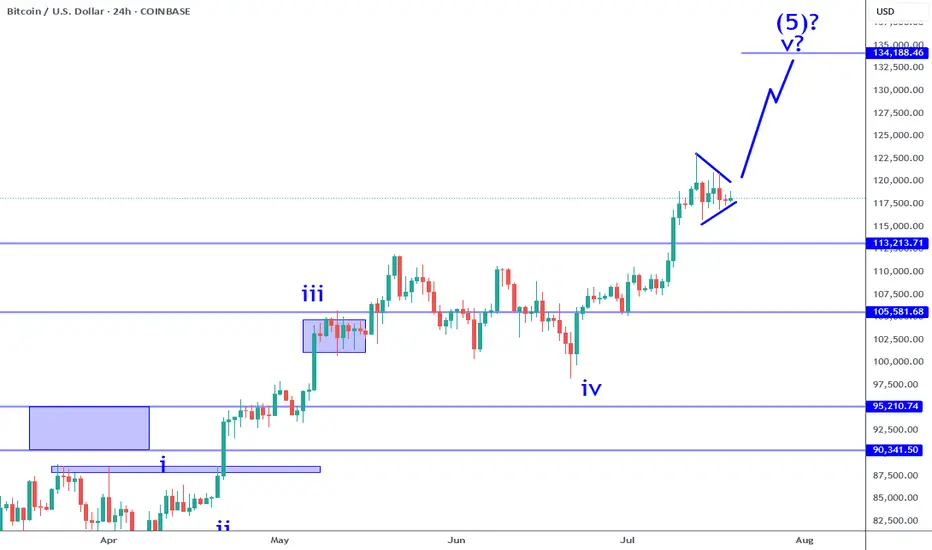
Bitcoin: 130K AREA Upon Triangle Break Out.Bitcoin consolidating in a sub wave 4 and poised to break out (see triangle formation on chart). This breakout would be the sub wave 5 which can take price as high as the 133K to 134K area. In my opinion, this can be the completion of the broadest impulse wave (5th of the 5th). Wave counts aside, this is EXTREMELY important to recognize because it highlights significant price vulnerability and implies very high risk for longs (especially for investors). Of course, these price moves do not play out unless accompanied by a specific catalyst. We have the catalysts in place to drive price higher, but what can lead to a broad corrective structure? Who knows.
There are numerous drivers in play at the moment: the weakening dollar, tariffs, favorable legal environment, etc. And all the talk, videos and other propaganda all point to the continuation of this trend. The broader markets, metals, Ethereum, whatever asset it is, it is continuously going higher with little to no variance. The recipe for total complacency while risk is increasing. Back in April, before the pullback, things looked similar, and then the unexpected reaction to the tariff news at the time. No one saw that coming, and when it came, NO ONE saw or expected that we would be pushing all time highs across EVERYTHING in just a matter of months. When the top is in, the correction will likely be similar or worse. The market is be driven by a declining dollar, not a growing economy.
For the next leg higher into the 130's, what for swing trade or day trade setups. The trend is pretty clear, so it is all a matter of confirming mini pullbacks and continuation or reversal patterns on smaller time frames. Risk can be managed using reference levels on smaller time frames like 4H or 1H for swing trades. The Trade Scanner Pro also provides precise confirmations along with risk and profit objectives. There is plenty of opportunity and ways to play this, without having to get caught as an investor.
The scenario on the chart that illustrates price going to the 130K area assumes a break out occurring this week. IF the market chooses otherwise, like it breaks the low of the triangle instead, then it lowers the probability of the bullish scenario playing out. It's up to the market to choose, all I can do is map out scenarios based on the structure that is in play at the moment.
Either way, it is important to always accept that markets are mostly random. Price action is shaped by the perceptions of the future which can change on a whim. There is no need to feel like you are missing out because when things look their greatest, that is often the worst time to buy and vice versa.
Thank you for considering my analysis and perspective.
BTC Weekly Recap & Outlook 20/07/2025📈 BTC Weekly Recap & Outlook
Market Context:
Price continued its bullish momentum, fueled by institutional demand and supportive U.S. policy outlook.
We captured solid profits by following the game plan I shared earlier (see linked chart below).
🔍 Technical Analysis
✅ BTC made a strong bullish move, breaking into new all-time highs.
📊 The daily RSI entered overbought territory, which signaled the potential for a short-term retracement or consolidation.
Currently, price is ranging, and RSI is cooling off. That tells me the market is likely building energy for the next leg up — but not before a significant liquidity run.
🎯 Game Plan
I'm watching for one of two potential setups:
1️⃣ Liquidity Sweep to the Downside
- A run of the daily swing low
- Into the most discounted range (0.75 Fib zone)
OR
2️⃣ Tap into the Weekly FVG Zone (marked with the purple line)
Either move would create the liquidity and energy needed to fuel a breakout above the equal highs (EQHs) marked by the black line.
🚀 Target
First Target: EQHs (Black Line)
Second Target: Price Discovery (new ATHs)
💬 Let me know your thoughts or drop your own chart ideas below!
📌 Follow for Weekly Recaps & Game Plans
If you found this useful, make sure to follow for weekly BTC updates, market outlooks, and detailed trade plans based on structure and liquidity.

BTC Daily Outlook
In my opinion, Bitcoin looks like it might need a short pause here.
📉 It's sitting just below a key Fib level and may require some time to consolidate before making another attempt.
📌 Price is printing a possible second close below the BB center.
📉 SMA is below the BB center — not ideal.
📊 Volume saw a strong red spike on July 15
📉 OBV formed a lower high while price remains elevated (granted, it’s the weekend and volume tends to dip).
📉 RSI is below 70 and under its moving average.
Too early for a strong conclusion — but this is a caution signal.
Let’s stay alert and watch it unfold together.
Always take profits and manage risk.
Interaction is welcome.
BTC Forming Bullish Triangle!Bitcoin is currently consolidating inside a symmetrical triangle pattern after a strong bullish rally. The price is approaching the apex of the triangle, signaling a potential breakout soon.
The 50 EMA is acting as dynamic support, perfectly aligned with the triangle’s lower trendline, reinforcing the bullish structure.
A confirmed breakout above the triangle resistance could trigger a strong upward move, with a potential target near the $125,000–$130,000 zone.
Cheers
Hexa
BINANCE:BTCUSDT CRYPTOCAP:BTC
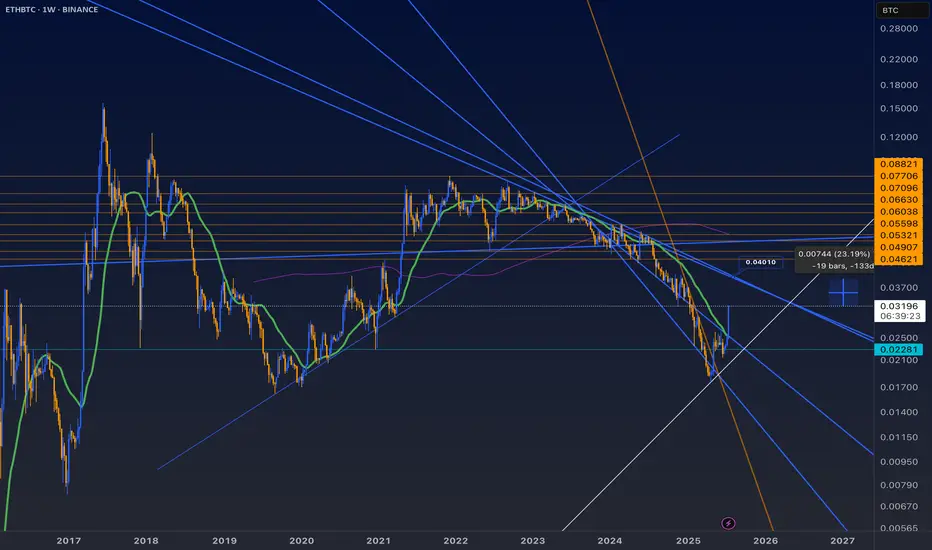
ETH/BTC 25-7-20I think there’s some clear headroom for more movement to 0.40 Ethereum per Bitcoin. Let’s see but right now is hot. Then the support after the 0.400 resistance is hit is back at 0.22, but who know what the price of Bitcoin would be at that point.
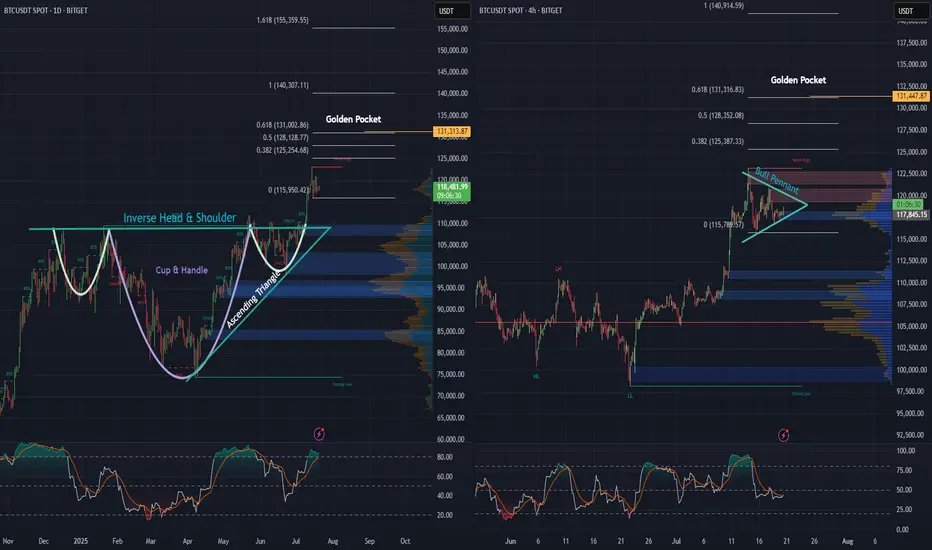
BTC daily, and 4 hr. Bullish Patterns Stack Up!Looking at the Daily and 4-hour charts for BTC, we can see multiple bullish formations unfolding.
An inverse head and shoulders - daily
A cup and handle - daily
An ascending triangle - daily
Price action looks strong, as we’ve begun the breakout from the neckline on the inverse H&S, as well as the cup and handle and ascending triangle simultaneously, and momentum is building fast.
Also, on the 4-hour chart, there’s a pretty substantial bull pennant taking shape. A breakout here could be the next leg up, and the push needed to keep momentum alive.
Zooming out, when we apply the trend-based Fibonacci extension, it reveals a $131,000 golden pocket, on both the the daily as well as the 4 hr. And that could be a major upside target if these bullish structures hold.
Stay tuned to see if BTC continues its move and sets a new all-time high.
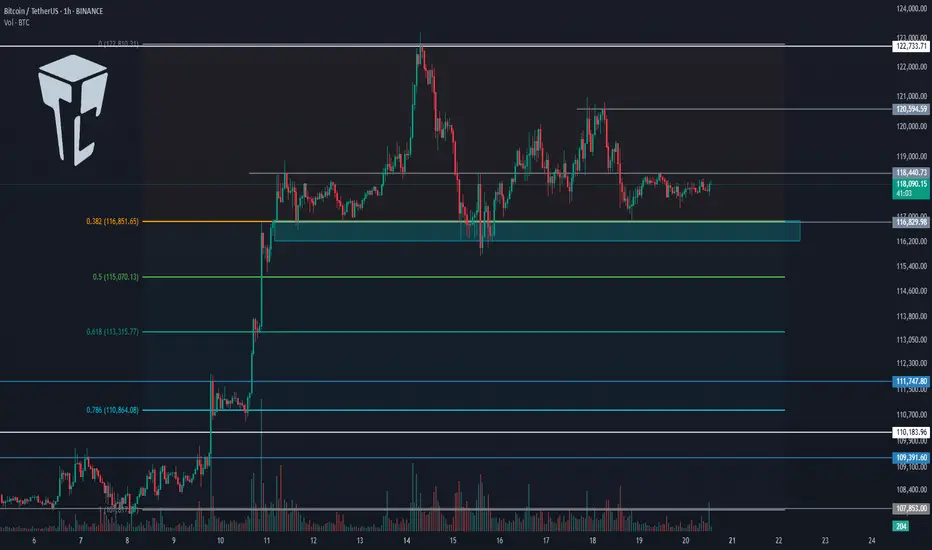
TradeCityPro | Bitcoin Daily Analysis #132👋 Welcome to TradeCity Pro!
Let’s dive into the Bitcoin analysis and key crypto indices. As usual, in this analysis I’ll review the futures triggers for the New York session.
📅 1-Hour timeframe
On the 1-Hour timeframe, as you can see, Bitcoin is still holding the key support at 116829 and has been ranging between 116829 and 118440 since yesterday.
✨ Today, if the 118440 level breaks, we can open a solid long position. However, I still believe that due to Bitcoin Dominance being in a downtrend, altcoins are a much better choice for opening positions.
✔️ If you're only planning to trade Bitcoin, this trigger is suitable. The next entry points would be 120594 and 122733. If we open positions at all three triggers and the market moves upward, we can get strong risk-to-reward setups since we’ve entered with significant volume across three positions.
📊 If the 116829 level breaks downward, we might see sharper corrections. In that case, the next supports will be the 0.5 and 0.618 Fibonacci levels.
👑 BTC.D Analysis
Looking at Bitcoin Dominance, as you can see, the trend is heavily bearish and moving downward.
⭐ The downtrend in dominance is quite steep, and the next support we have is at 60.49. There’s still room for dominance to drop to this level.
📅 Total2 Analysis
Moving to Total2, yesterday the 1.46 trigger was activated and price moved to 1.5, and it is now sitting just below that level.
💫 If this level breaks, another bullish wave towards 1.62 could form.
📅 USDT.D Analysis
Looking at Tether Dominance, this index is also in a downtrend similar to Bitcoin Dominance, which shows that money is exiting both Bitcoin and Tether and entering altcoins.
🎲 So keep a close eye on altcoins in the coming days, because a lot of capital is flowing into them and they could see significant pumps.
❌ Disclaimer ❌
Trading futures is highly risky and dangerous. If you're not an expert, these triggers may not be suitable for you. You should first learn risk and capital management. You can also use the educational content from this channel.
Finally, these triggers reflect my personal opinions on price action, and the market may move completely against this analysis. So, do your own research before opening any position.
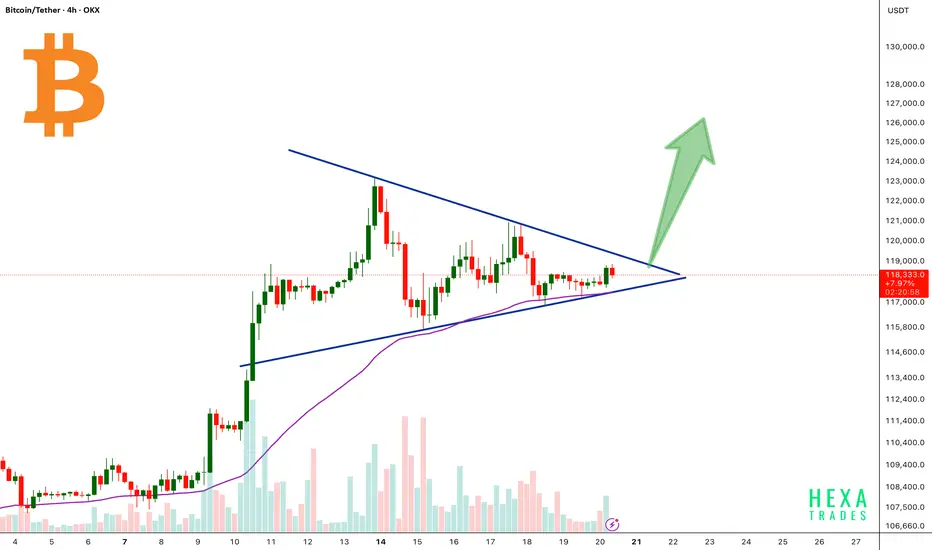
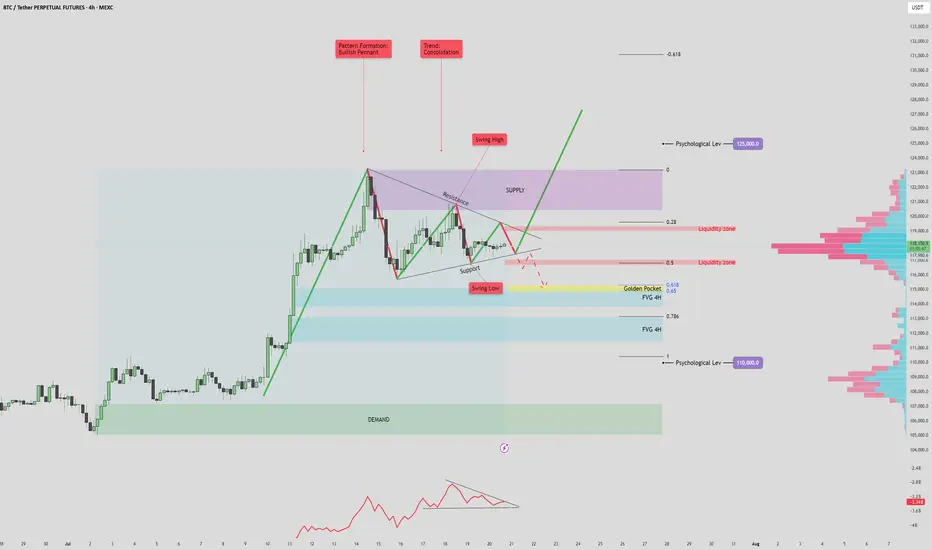
BTC/USDT 125k? or 110k fall again?BTC/USDT 4H Analysis – July 20, 2025
The current market structure shows a bullish pennant forming after a strong impulsive move upward, with price consolidating between key support and resistance levels. This pattern, combined with volume signals and key price zones, suggests a potential for a high-volatility breakout.
🔷 Volume Profile & OBV Insights
The On-Balance Volume (OBV) indicator is forming a symmetrical triangle, indicating a volume squeeze. This suggests a potential sudden spike in volume that could confirm the next major move.
Anchored Volume Profile (VPVR) on the right shows a notable low-volume area between 112K–115K. If price breaks below this zone, it could lead to a rapid selloff toward deeper fair value areas due to reduced liquidity support.
📈 Bullish Scenario
If price breaks above the pennant resistance and 119.5K liquidity zone, it may signal bullish continuation.
A successful retest of the breakout level as support would confirm strength, opening the door to:
Short-term target: 123K (supply zone and previous swing high)
Mid-term target: 125K (key psychological level and potential ATH)
Watch for confirmation via OBV breakout and strong bullish volume. Failure to sustain above the 118K–119K area could signal a bull trap.
📉 Bearish Scenario
A breakdown below pennant support and the 115K level would likely trigger a move into the low-volume range.
First key downside target: 114.7K–115.7K, which aligns with the Golden Pocket (Fib 0.618 zone) and a 4H Fair Value Gap (FVG).
This zone may act as a support or a liquidity grab reversal area.
If this zone fails to hold, deeper downside targets become likely:
FVG 2 (~112K)
Psychological support at 110K, which aligns with strong historical demand and a major VPVR node.
This bearish move may either confirm further downside momentum or present a fakeout opportunity if price sharply reverses from one of these deeper levels.
✅ Summary
BTC is coiled within a bullish pennant, with both bullish continuation and bearish breakdown scenarios in play. Volume confirmation and breakout direction will be key. Traders should monitor how price reacts around the 115K–118K zone for directional clarity. A move beyond this range, especially with volume support, will likely define the next trend leg.
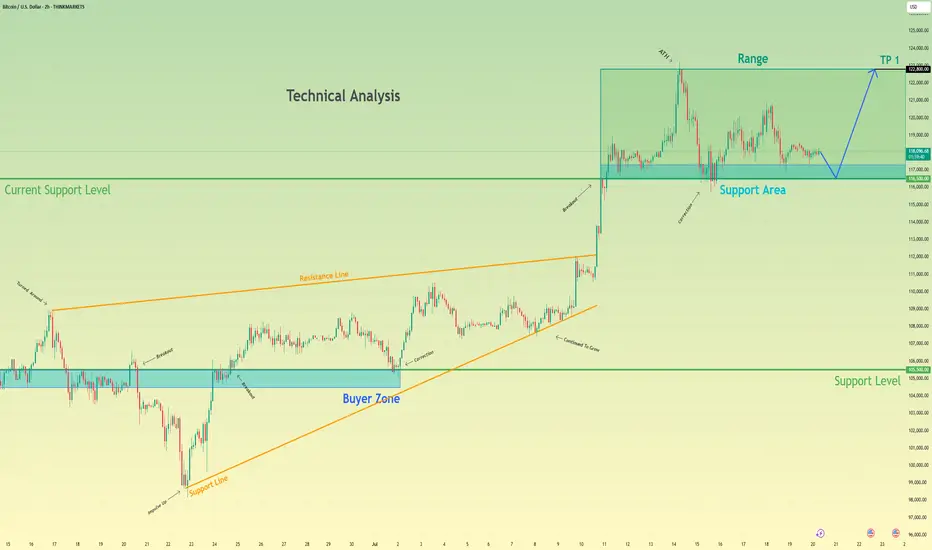
BITCOIN - Price can bounce up from support line to $125000Hi guys, this is my overview for BTCUSD, feel free to check it and write your feedback in comments👊
For a long time, the price was trading sideways inside a wide flat range between the $99000 support area and the $112000 resistance level.
After accumulating volume, bitcoin made a strong upward impulse and performed a breakout, pushing above the top of the flat.
Following this movement, the price action began to form a rising wedge pattern, moving between its clear support and resistance lines.
Recently, price tested the resistance line of the wedge and then started a predictable correction back down towards support.
Now, BTC is approaching the support line of the wedge, which aligns with the important horizontal support area around $112000-$113500.
I expect that the price can test this support line and then bounce up to the $125000 resistance line of the wedge.
If this post is useful to you, you can support me with like/boost and advice in comments❤️
Disclaimer: As part of ThinkMarkets’ Influencer Program, I am sponsored to share and publish their charts in my analysis.

Bitcoin may bounce up from support area to 122800 pointsHello traders, I want share with you my opinion about Bitcoin. Analyzing the broader market context on the BTC chart, the past price action has carved out two significant technical structures: a wide trading range and a larger upward wedge pattern. The formation of this wedge indicates a generally positive market sentiment, though the narrowing price swings suggest a decrease in upward momentum. The foundation of the current structure was established around the buyer zone of 105500 - 104500, a level that has historically proven to be a robust floor. This historical behavior provides a critical reference for our hypothesis. Currently, we are observing bitcoin's price action closely, interacting with the current support area, located between 116500 and 117300. The character of the movement here is largely corrective and consolidative, pointing to a state of temporary equilibrium. This consolidation near the lower boundary of the wedge is a pivotal point. My thinking is that a final, brief dip to thoroughly test the 116500 - 117300 support area is a high-probability scenario. Such a move would effectively absorb remaining sell-side liquidity before a reversal. We can then anticipate an impulsive move upwards across the range. Therefore, the logical take-profit for this long position is set at 122800 points, as this level marks the upper resistance of the range and a natural target. Please share this idea with your friends and click Boost 🚀
Disclaimer: As part of ThinkMarkets’ Influencer Program, I am sponsored to share and publish their charts in my analysis.
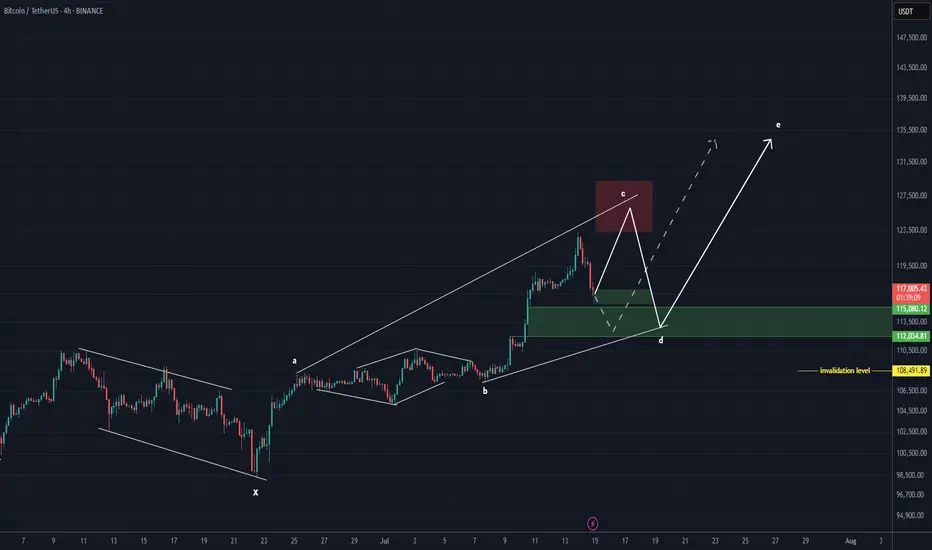
Bitcoin is still bullish (4H)Bitcoin appears to be in a dual bullish structure, currently in the second bullish phase following wave X.
Considering the expansive nature of the correction in the second pattern, it seems we are within an expanding triangle or a diametric structure.
Based on the duration of wave C, it appears that the bullish wave of the second structure is not yet complete.
We expect such fluctuations for Bitcoin in the coming period.
A daily candle close below the invalidation level would invalidate this outlook.
For risk management, please don't forget stop loss and capital management
Comment if you have any questions
Thank You
TheKing Cycles- Nothing can be perfect in Life or in Trading, but you can always brighten up your day.
- Remember "Cycles are Cycles"
- Everything is in graph
- You can follow bears, predicting 10 years of recession, but we are in a big recession and for a long time already.
- You can fall in the deep and predict the darkness.
- i like to see the sunshine in the morning and i will always radiate warmth.
- Follow Hope, and always believe in your own judgement.
- Be Bold and do the opposite of what commons peoples think.
Happy Tr4Ding !
The Crypto Era- Just updated an old chart!
- If you want to know where we stand, it's clearly outlined on the chart.
Some older Analyses :
- HODL strong!
Happy Tr4Ding !

The SqueezeWhile it is logical to assume that the bulls are the ones about to get squeezed, I am going to be a contrarian and bet on the SHORTs getting liquidated, big time.
Good afternoon my fellow Cryptocurrency trader, how are you feeling this Saturday?
Every now and then, every once in a while the market enters a fight between down and up. When tensions rise, when people become anxious, when greed is strong, that's the time for a market squeeze to develop.
Seeing how good Bitcoin is doing, the strong Ether advance, how the altcoins are moving ahead and the rest, it is easy to rationalize that the market will squeeze all the over-leveraged LONG traders. I will repeat myself again, this is a SHORT squeeze.
Let's wait and see. Prices are going up. 1 Billion in liquidations coming next.
Let the bears run. Let's us start a mini bull-run phase.
Namaste.

BTCUSDTHello Traders! 👋
What are your thoughts on BITCOIN?
Bitcoin has recently posted a new all-time high and is now undergoing a healthy correction. This pullback is expected to extend toward a key support zone, which aligns with both the previous breakout level and the bottom of the ascending channel.
Once the correction is completed near the channel support / previous high, we anticipate a bullish continuation.
The next leg higher could take Bitcoin toward the upper boundary of the current channel.
As long as price remains above the key support area, the overall structure stays bullish and this correction is likely to be a buy-the-dip opportunity within a broader uptrend.
Will Bitcoin use this pullback as a launchpad for new highs? Share your view in the comments! 🤔👇
Don’t forget to like and share your thoughts in the comments! ❤️
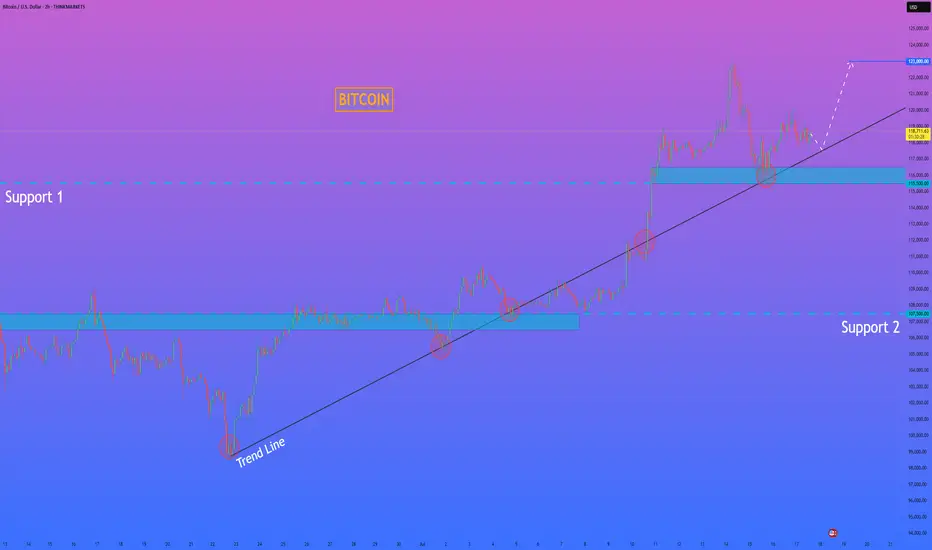
HelenP. I Bitcoin will correct to trend line and then start riseHi folks today I'm prepared for you Bitcoin analytics. The price has been trading in a strong bullish structure, clearly respecting the ascending trend line since the rebound from the 107500 level. Each time the price touched the trend line, it formed a higher low and continued the upward movement. After breaking through the important Support 1 zone (115500–116500), BTC made a strong impulse upward and reached a local high above 122000 points. Currently, the price is making a pullback and moving closer to the trend line again. This area has previously acted as a major point of interest for buyers, and now it's expected to play a key role once more. The support zone and trend line are converging, which makes this level critical for the next move. I believe BTCUSD will bounce from this area and continue its bullish momentum. My goal is set at 123000 points. Given the market structure, higher lows, and strong reaction from the support zones, I remain bullish and expect further growth from current levels. If you like my analytics you may support me with your like/comment ❤️
Disclaimer: As part of ThinkMarkets’ Influencer Program, I am sponsored to share and publish their charts in my analysis.