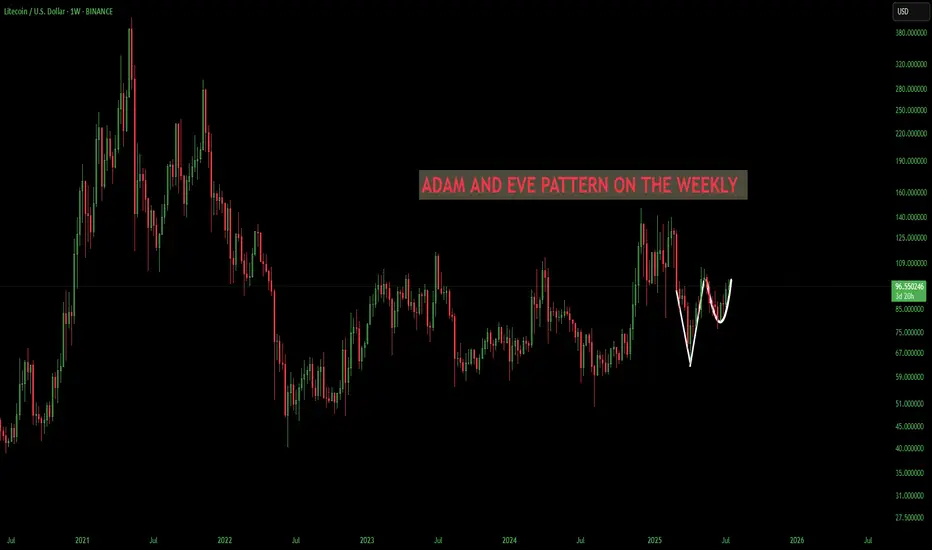
LTC/USD LITECOIN Adam & Eve Pattern On WeeklyThe Adam and Eve pattern is quite effective and usually signals a trend change to bullish. Once this pattern breaks the neckline I think its straight to $200 before any sort of pullback.
Haven't done a chart in a while cause its been the same old stuff, sideways. We are starting to ignite now. Silver is running which means something is breaking in the background financial system. I see the biggest blow off top you've ever seen coming, its the only way out of this, print print print until it doesn't work anymore.
Also I was reading that Bitcoin is removing its cap for spam in each block in October? This could spell disaster for fees and congestion. Litecoin will skyrocket during that time I believe because the fees will be so high it will price out the little guy trying to send a grand or two. I see an influx of people coming to Litecoin. Good luck , none of this is financial advice just my opinion
Bitcoin (Cryptocurrency)
Bitcoin Interesting Fractal And Timing! GOING STRAIGHT UP!I noticed that the timing and pattern of how this is playing out in 2025 in Bitcoin is very similar to that of 2017. This fractal is not identical but its damn close. In 2017 there were approximately 15 million people in crypto, very few leverage exchanges, and trading was no where near what it is today. Now we have exchanges everywhere, hundreds of them most with leverage which we didn't really have before. Also not to mention that now we have big players getting in and they aren't buying and selling on the daily, they are buying it all and holding it, hence why we aren't seeing the typical "Alt season". The sloshing effect we had in the early days when traders would rotate out of Bitcoin into alts is not happening as it used to.
In 2017 Trump took office and in the end of March the bull run started in full swing. Something very similar is also happening now that we are in March and these fractals are lining up. Let see how this plays out. I think we are on the cusp of a giant mega bull run like you've seen before.
Crypto traders last year made mega profits cashing out multiple billions in capital gains. Once the selling stops around the end of March and beginning of April from people selling to pay taxes I think its on. This is not financial advice this is just my opinion. Lets see how this chart ages. Thank you for reading.

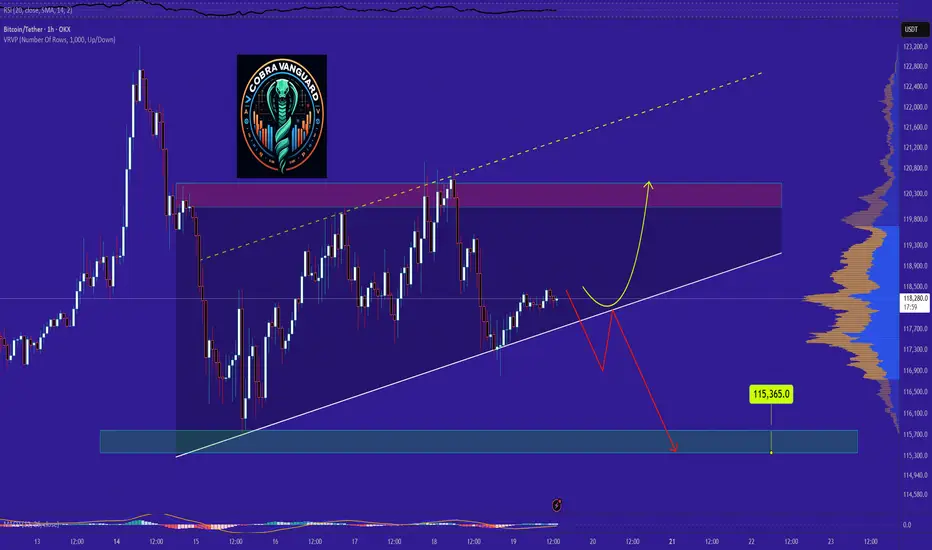
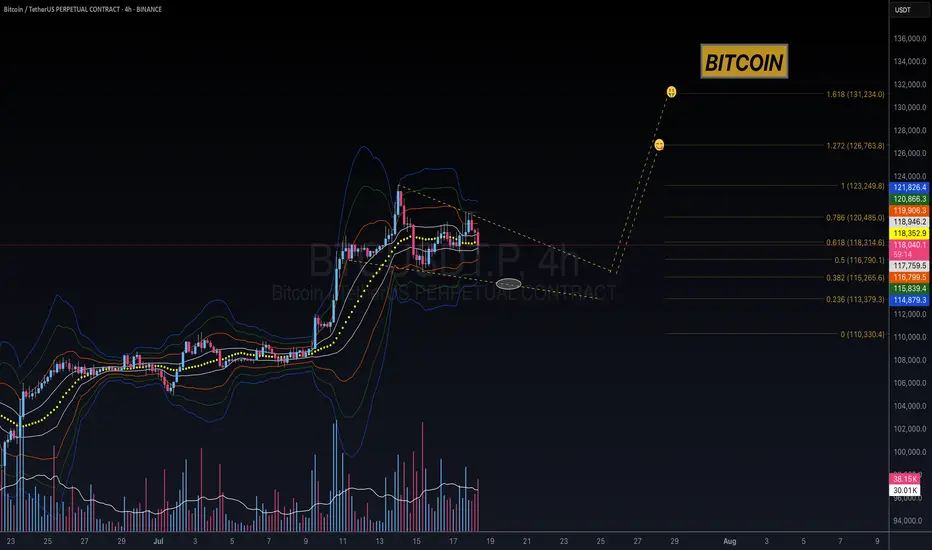
BITCOIN's Situation (1h) !!!The price is within an ascending triangle, which could be encouraging. However, since crypto doesn't always follow patterns, it might break down from below and correct to around $115K!
Best regards CobraVanguard.💚
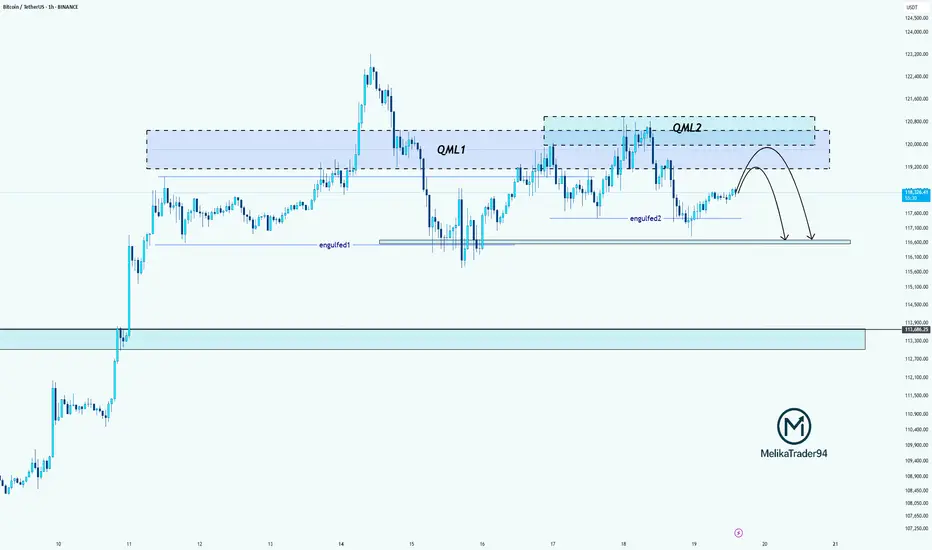
BTC Double QML Setup: Is Another Drop Loading?Hello guys!
Do you remember the last analysis?
Now this BTC chart shows a textbook example of two consecutive QML (Quasimodo Level) patterns forming (QML1 and QML2), each confirmed by clean engulfed lows.
QML1 caused a strong drop after the high was broken and a new low formed.
Price retraced and created QML2, again with a confirmed engulfed low (engulfed2).
We're now likely to see a reaction at the QML2 supply zone.
If price respects this second QML zone, we could see another bearish move toward the 116k zone, possibly lower.
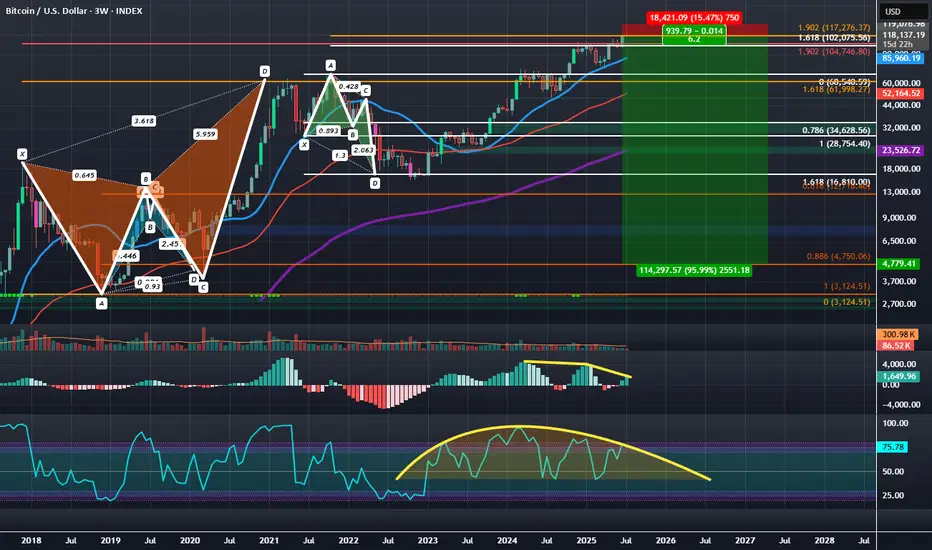
BTCUSD: Bearish Logscale Butterfly with Bearish RSI DivergenceBitcoin has been setting up at the log adjusted 1.902 HOP for a Type 2 retest of the Logscale Bearish Butterfly for the last few months but recently pushed a bit above it and appears to be settling at the linear 1.902 HOP of the local price around the $118,000 area. Between $104,000 and $118,000 is a zone of linear of logscale Fibonacci confluence pointing towards the being the area to look for a more major downside reaction than we got off the initial Type 1 Reaction 1.618 PCZ reversal in 2021.
The most recent push to the linear 1.902 seems to have allowed the structure of the RSI to develop a more Bearishly Distributive and Divergent curve, while the MACD is in the process of developing a 2nd layer of Bearish Divergence. Ultimately at these highs we'd like to see the RSI weaken further as price begins to settle back within the 1.902 bearish zone of confluence before being more sure of downside.
Additionally, during the push higher, longer dated bearish call interest came in around the 123-125k levels which to me signals a newly formed hard resistance that will be hard to gap over and will make failure here more likely. I think if we do see failure we can of course fill the CME gap down at 91.8k, but ultimately the true first target is down at 30k with max targets down near the 0.886 around $4.8k and the 100 percent retrace down at around $3,123.51 over the coming quarters.
Taking into account the wide range in downside exposure I think the best and safest way to speculate on this downside would be through the buying of the March, 27th, 2026 Puts at the $95,000 strike or the closest IBIT equivalent March, 20th, 2026 Puts at the 58 strike this will give plenty of time, as well as plenty of range for the puts to appreciate 10's of thousands of dollars in value as BTC trades down into the targeted zones below it.
BTCUSDT: A Period of Adjustment and the Next TrendAfter a strong rally to record highs, BTCUSDT is currently entering a period of slight correction. The coin is now trading around 118,500 USD, down more than 0.57% on the day.
From a technical perspective, BTCUSD is moving within a narrowing price wedge, showing a slight downtrend. The support level at 116,500 USD is acting as a springboard for the Bulls. However, as the price approaches the tip of the wedge, a breakout may occur at any time, with two possible scenarios highlighted on the chart.
My personal outlook is that BTCUSDT will continue to decline in the short term before breaking out of the wedge in an upward direction. What do you think about BTCUSDT?
Please share your thoughts in the comments and don’t forget to like this post!
Wishing you all happy and successful trading!
BTC Battles Resistance – Can Bulls Reclaim the Channel?🔥📈 BTC Battles Resistance – Can Bulls Reclaim the Channel? 🧠🚪
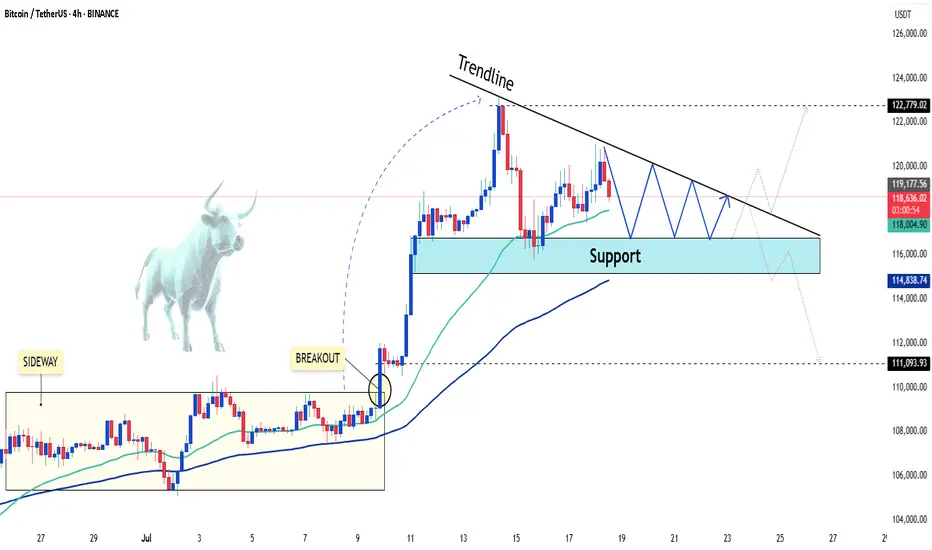
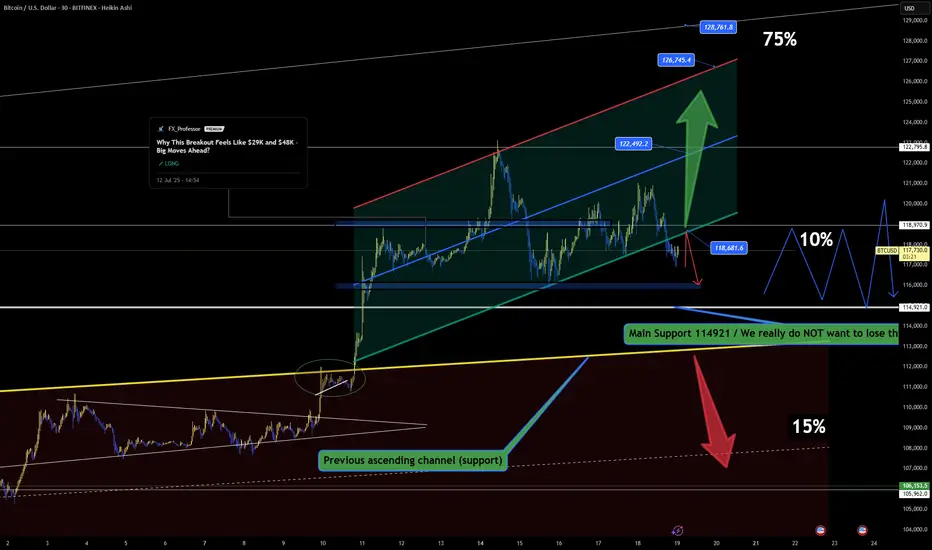
Bitcoin is now knocking on the door of the broken channel support — what was once a floor is now acting as resistance. For bulls to regain momentum, price must reclaim and close back inside the channel, ideally above 118.6K.
📍 Key Structural Notes:
We've already broken below the internal channel — this is no longer a confirmed uptrend.
Current resistance is the same trendline that previously acted as support — classic technical flip.
Failing here keeps BTC vulnerable for a deeper move toward the Main Support at 114.9K, where the real test lies.
📊 Order Flow Context:
Funding remains mildly positive, showing no panic from longs.
Premium is near-zero — market isn't chasing.
OI is steady, showing neutral positioning but potential for sudden volatility.
Spot volume picked up during the recent move, but not strong enough to confirm a breakout… yet.
🧩 Scenarios:
✅ Breaks back above 118.6K with volume → Targets: 122.4K, 126.7K, 128.7K (channel continuation).
❌ Rejection at resistance → Eyes on 114.9K. Losing that, and we enter danger territory toward 106K.
We’re at a decision point — and these are the moments that shape the next leg.
One Love,
The FXPROFESSOR 💙
Disclosure: I am happy to be part of the Trade Nation's Influencer program and receive a monthly fee for using their TradingView charts in my analysis. Awesome broker, where the trader really comes first! 🌟🤝📈
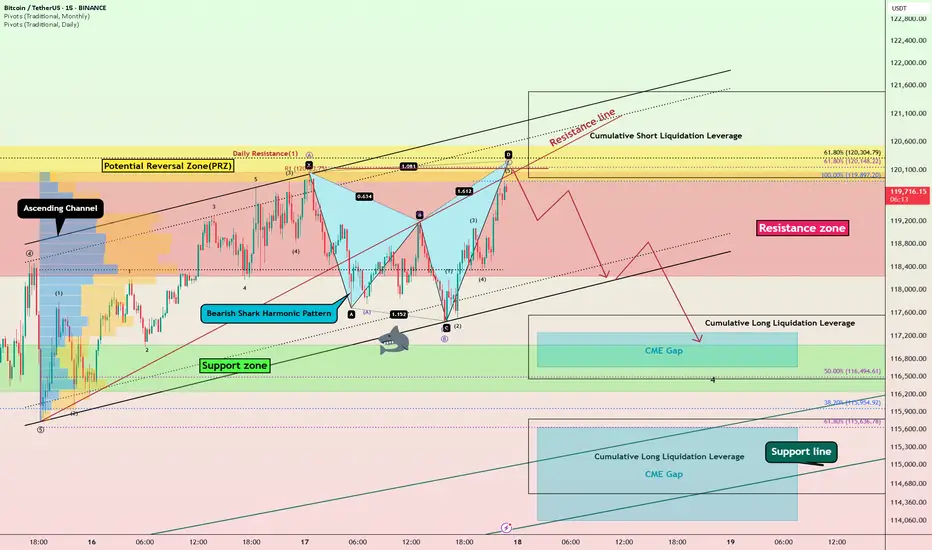
Bitcoin Bearish Shark Detected – CME Gap Below $115K in Sight?Today's analysis is on the 15-minute timeframe , following the previous analysis I shared with you on the 1-hour timeframe .
Bitcoin ( BINANCE:BTCUSDT ) is currently trading in the Resistance zone($120,100-$118,240) near the Potential Reversal Zone(PRZ) and Cumulative Short Liquidation Leverage($121,490-$119,965) .
From a technical perspective , it looks like Bitcoin is completing the Bearish Shark Harmonic Pattern on the 15-minute timeframe .
From an Elliott wave theory perspective, it looks like Bitcoin is completing the microwave 5 of wave C of the Zigzag Correction(ABC/5-3-5) .
I expect Bitcoin to start falling from the top of the ascending channel and at least decline to the lower line of the descending channel, and if the ascending channel breaks this time, we should wait for the CME Gap($117,255-$116,675)/CME Gap($115,060-$114,947) to fill.
Cumulative Long Liquidation Leverage: $117,556-$116,465
Cumulative Long Liquidation Leverage: $115,773-$114,513
Do you think Bitcoin can create a new ATH again?
Note: Stop Loss(SL)= $121,620
Please respect each other's ideas and express them politely if you agree or disagree.
Bitcoin Analyze (BTCUSDT), 15-minute time frame.
Be sure to follow the updated ideas.
Do not forget to put a Stop loss for your positions (For every position you want to open).
Please follow your strategy and updates; this is just my Idea, and I will gladly see your ideas in this post.
Please do not forget the ✅' like '✅ button 🙏😊 & Share it with your friends; thanks, and Trade safe.
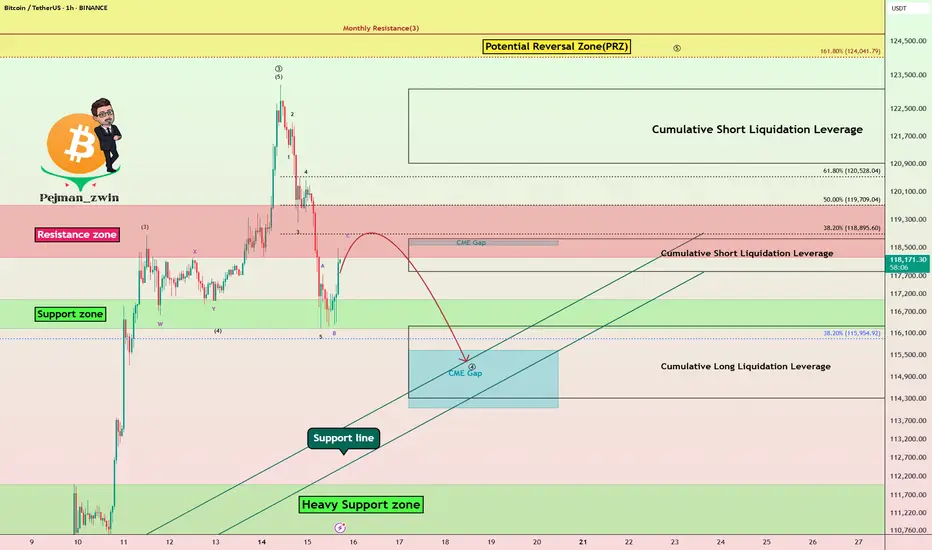
Bitcoin Struggles Below $120K:Will the CME Gap Pull Price Lower?Bitcoin ( BINANCE:BTCUSDT ) has been experiencing a high momentum bullish trend in recent days, which few people expected, especially when it crossed $120,000 . However, in the past 24 hours , Bitcoin has fallen back below $120,000 .
Bitcoin is currently trading in the Resistance zone($119,720-$118,240) and Cumulative Short Liquidation Leverage($118,757-$117,829) on the 1-hour time frame .
In terms of Elliott Wave theory , Bitcoin appears to be completing a main wave 4 . Main wave 4 is likely to have a Zigzag Correction(ABC/5-3-5) .
I expect Bitcoin to attack the Support lines and fill the CME Gap($115,060-$114,947) in the next hour.
Cumulative Short Liquidation Leverage: $123,087-$120,922
Cumulative Long Liquidation Leverage: $116,305-$114,325
Do you think Bitcoin can create a new ATH again?
Note: Stop Loss(SL)= $121,000
Please respect each other's ideas and express them politely if you agree or disagree.
Bitcoin Analyze (BTCUSDT), 1-hour time frame.
Be sure to follow the updated ideas.
Do not forget to put a Stop loss for your positions (For every position you want to open).
Please follow your strategy and updates; this is just my Idea, and I will gladly see your ideas in this post.
Please do not forget the ✅' like '✅ button 🙏😊 & Share it with your friends; thanks, and Trade safe.
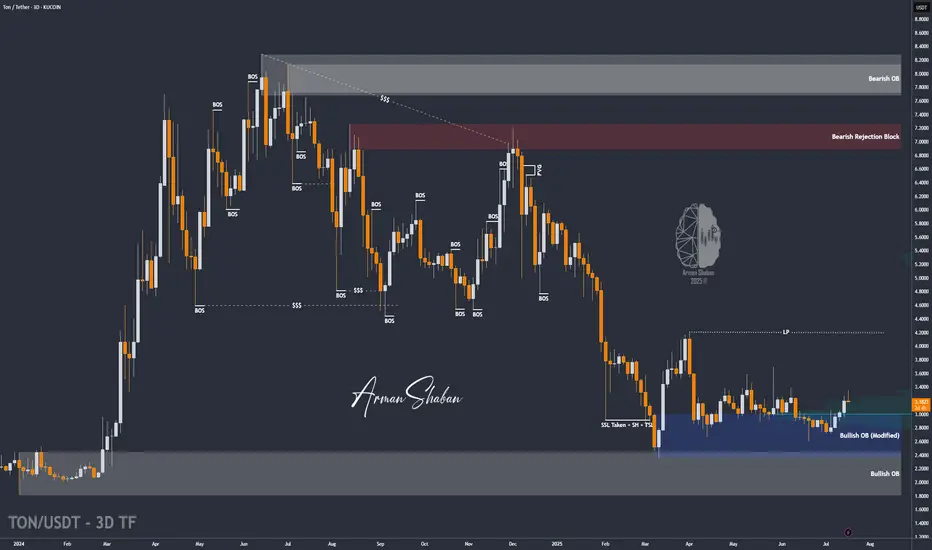
TON/USDT | Another Bullish Move Ahead? (READ THE CAPTION)By analyzing the Toncoin chart on the 3-day timeframe, we can see that, as per yesterday’s analysis, the price climbed to $3.36 before facing a slight correction — which is perfectly normal since every strong bullish trend needs a healthy pullback. The $3.05–$3.20 zone could serve as a good accumulation area for buyers, and we may soon witness another impressive rally from Toncoin! Based on the previous analysis, the next targets are $3.63, $4.20, and $4.68.
Please support me with your likes and comments to motivate me to share more analysis with you and share your opinion about the possible trend of this chart with me !
Best Regards , Arman Shaban
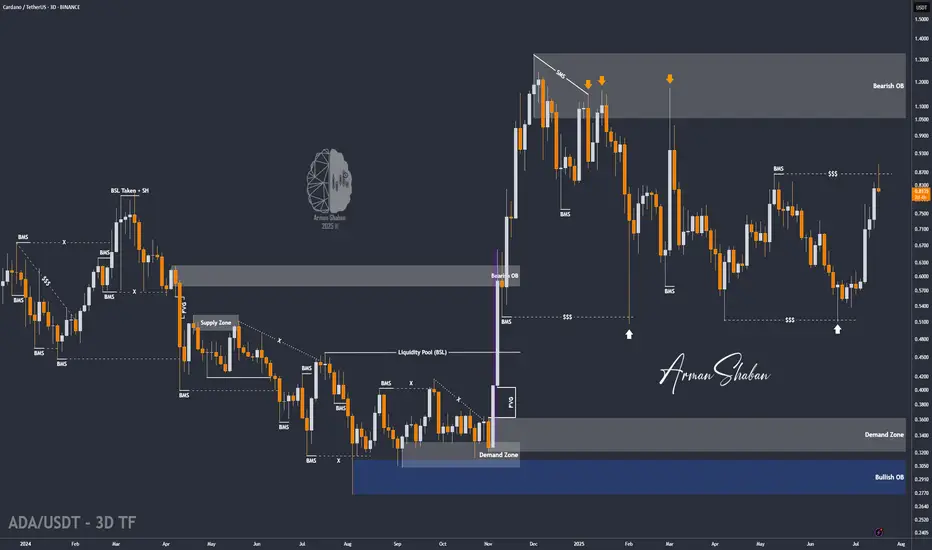
ADA/USDT | BIG Bullish Move Ahead! (READ THE CAPTION)By analyzing the Cardano chart on the 3-day timeframe, we can see that, as expected, the price continued its rally, reaching $0.89 before collecting liquidity above the $0.86 level and then facing a correction. Currently trading around $0.81, we expect the bullish trend to continue after this minor pullback. Key demand zones are at $0.78, $0.69, and $0.61. Based on the previous analysis, the next short- to mid-term bullish targets are $0.93, $1.05, and $1.33.
Please support me with your likes and comments to motivate me to share more analysis with you and share your opinion about the possible trend of this chart with me !
Best Regards , Arman Shaban
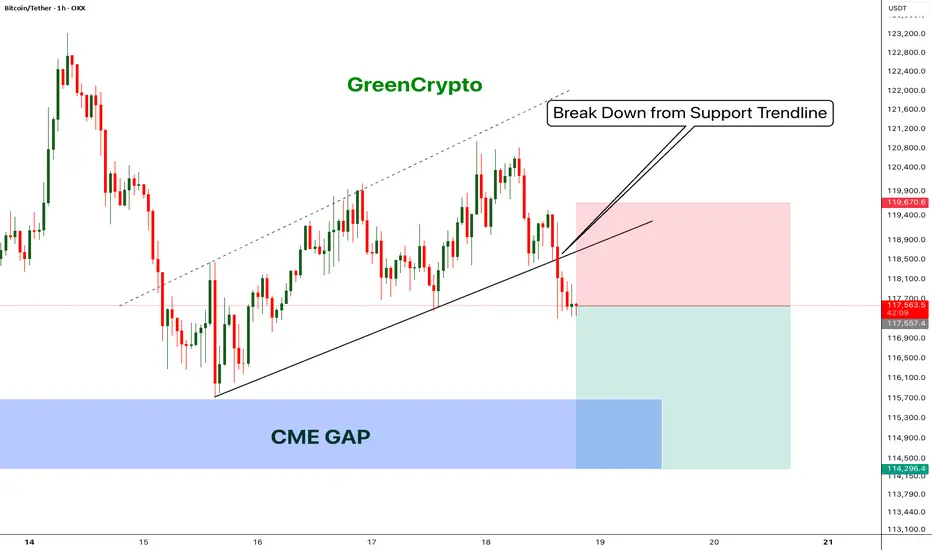
Bitcoin - Bears will push the price fill CME Gap- Bitcoin has broken down from the trending support,
- Price has been going down without any retracement on 1H candle.
- Looks like bitcoin will CME gap before going up further.
- A high risk Short Trade opportunity is here
Entry: 117,431
Stop Loss: 119,670
TP1: 116152.8
TP2: 114403.6
Move SL to Breakeven on TP1 hit
Don't forget to like and follow
Cheers
GreenCrypto
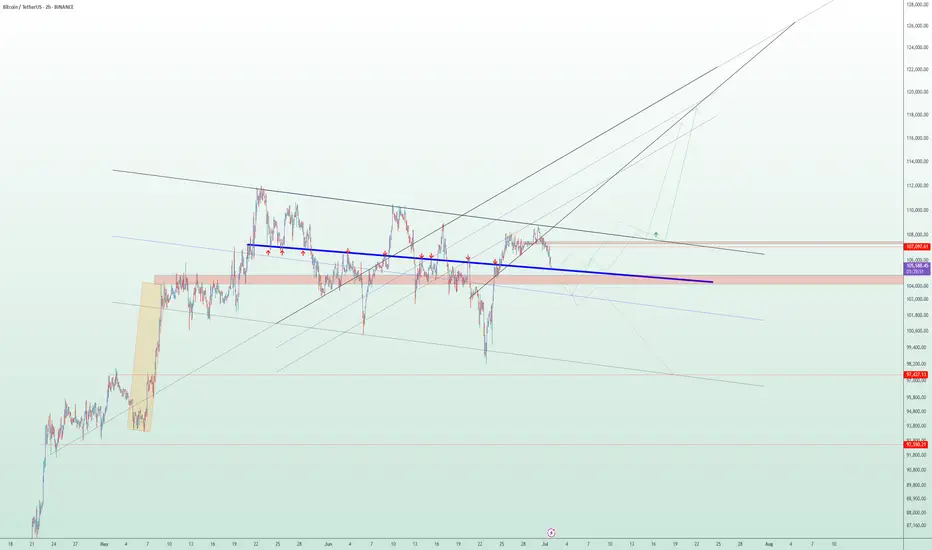
The Critical Blue Line – Will Bitcoin Soar or Sink
🔹 Bitcoin Technical Analysis – Key Blue Line, Bear Trap Possibility & Long-Term Scenario
On the Bitcoin chart, the blue horizontal level has acted multiple times as both support and resistance. The price has broken it several times but failed to sustain above, indicating high-volume decision-making zones by institutions and large players.
📉 Why this pattern keeps repeating:
Strong supply and demand concentration at this level.
Inability to break and hold shows market indecision.
Repeated fakeouts are likely used to shake out weak hands.
🔍 Important hidden scenario: Bear Trap Potential
If the price dips below the blue line but quickly reclaims it, it may form a bear trap, tricking short sellers into entering prematurely. This move could ignite strong bullish momentum from trapped sellers and renewed buyers.
🔮 If price holds above the blue line:
Signals market strength and potential bullish structure shift.
Targets:
109,800
117,200
120,000+ (Long-term)
📛 If support fails again:
Retracement toward the lower channel near 101,000 or lower is possible.
📊 Conclusion:
This zone is one of the most critical decision points in the current market. Traders should combine volume, candlestick behavior, and confirmation signals to avoid getting trapped by fake breaks
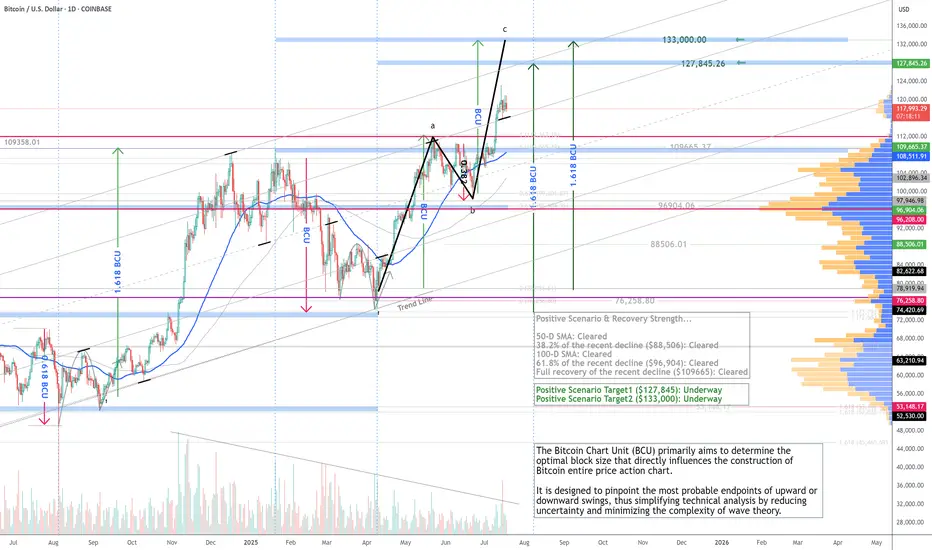
Bitcoin ($BTC): The Current Run Targets In Sight - 7/18/2025CRYPTOCAP:BTC has cleared all chart levels (listed), riding a textbook BCU (abc) wave to new highs! Momentum’s conservative, and abc targets are in sight: $127,845–$133,000. Let’s see how this unfolds at these levels!
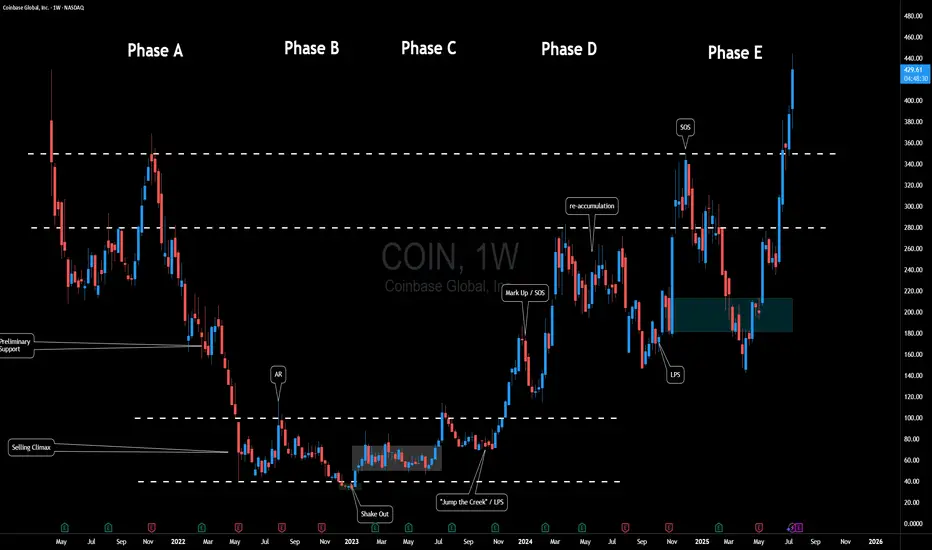
$COIN Fun Wyckoff InterpretationHere's a fun Wyckoff-inspired take on Coinbase Global ( NASDAQ:COIN ) over the past few years, mapping its weekly chart to the classic Accumulation Schematic. Wyckoff's method, envisioning the "Composite Man" quietly scooping up shares during weakness before blasting off... fits COIN perfectly, especially in crypto's wild swings.
We can see a textbook multi-year accumulation from mid 2022, a breakout into markup in 2024, and even a cheeky re-accumulation mid-2024 to fuel the latest highs.
Phase A: Stopping the Downtrend
After the initial IPO Coinbase experienced quite a bit of downside pressure.
Eventually price began to range between $40 and $100.
Phase B: Building Cause
Months of boring sideways chop.
Sellers exhausted because let's think for a moment... If crypto was truly going to stick around - how much lower could this thing go?
Smart money absorbs.
Phase C: The Trap
That shakeout low at ~$32 in early 2023. If you study Wyckoff, this is Schematic #1 vibes.
Phase D: Demand Dominates
Explosive rally (SOS) to ~$280 in early 2024, breaking the range on surging volume.
Mid-2024 pullback to ~$150 acts as a mini Re-Accumulation with its own LPS at the low. Higher lows / mitigation confirm no real distribution yet. Another SOS post-re-accumulation, pushing toward $400+.
Phase E: Markup Phase
Where will the composite man be eyeing for the next target?
Overall, Crypto adoption's heating up (BTC ETF flows, regulatory, etc), and the chart's still in a strong uptrend. But remember, Wyckoff's not crystal ball... it can however be used as a roadmap to navigate the chart.
Fun fact: COIN often mirrors BTC, so keep an eye out for correlation.
What's your opinion - accumulation complete or more shakeouts ahead? 🚀📈
Disclaimer: Not financial advice; DYOR! Chart based on weekly data up to July 2025.
BTC - Long the $115k LiquidationsHiya friends,
Hope the market has been treating y'all well.
Long Btc soon for another leg up! Then take profits! LOL
Trade thirsty, my friends!
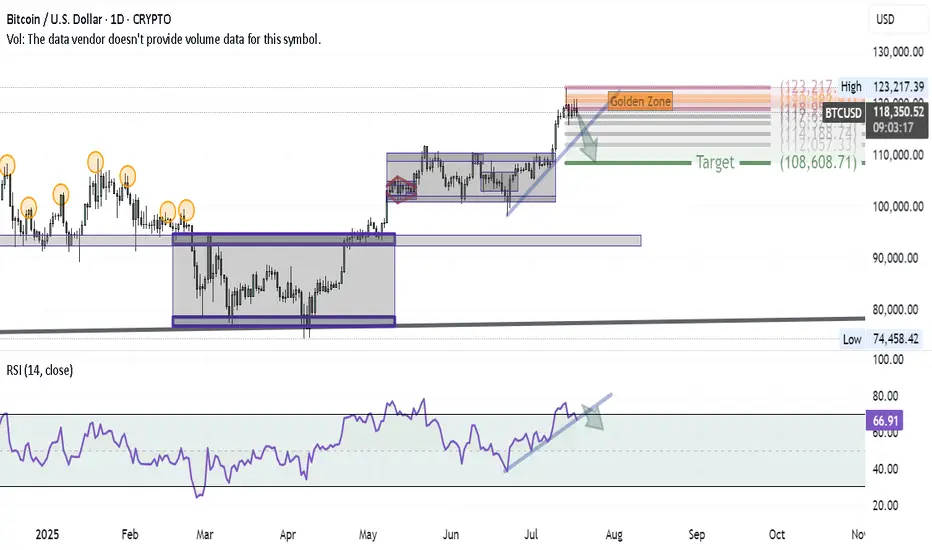
Bitcoin Correction Unfolding — First Wave in MotionAfter successfully hitting the BITCOIN target and anticipating a major correction in my previous ideas, here’s how the first wave of that correction is shaping up on the daily chart:
1- At the recent high, a Shooting Star candle formed — a classic reversal signal.
2- Using Volunacci analysis, the price retraced exactly to the Golden Zone, validating the first leg of the pullback.
3- The next step? A breakdown of the blue trendline would likely send us toward the Volunacci target at $108,600.
4- For confirmation, we're watching the RSI trendline — if it breaks down as well, it would strongly support the bearish continuation.
The setup is clean and developing as expected — it's all about following price and letting the chart guide the story.
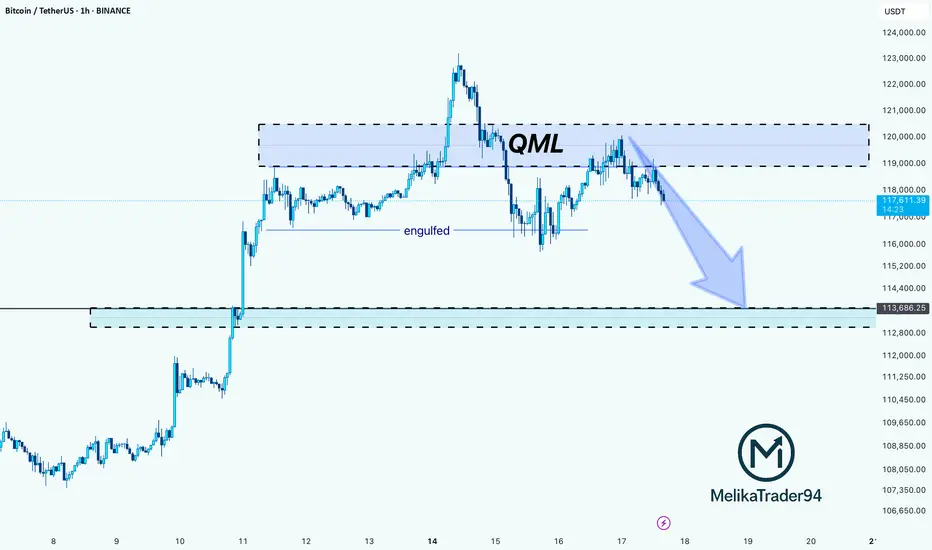
BTC Rejection from QML Zone: Towards on 113,600 SupportHello guys!
This chart shows a QML (Quasimodo Level) setup in play on Bitcoin. After price created a new high and engulfed the previous structure, it returned to the QML zone (around $119K–$121K) and reacted exactly as expected: strong rejection.
The sharp selloff from the QML area confirms a bearish shift in structure, and now the momentum is tilted to the downside.
The next key level to watch is the 113,600 demand zone, where the price may either bounce or consolidate.
As long as the price stays below the QML zone, bears have control.
You should consider that the main trend is bullish, and the stop loss may be hit, so please manage your risk!
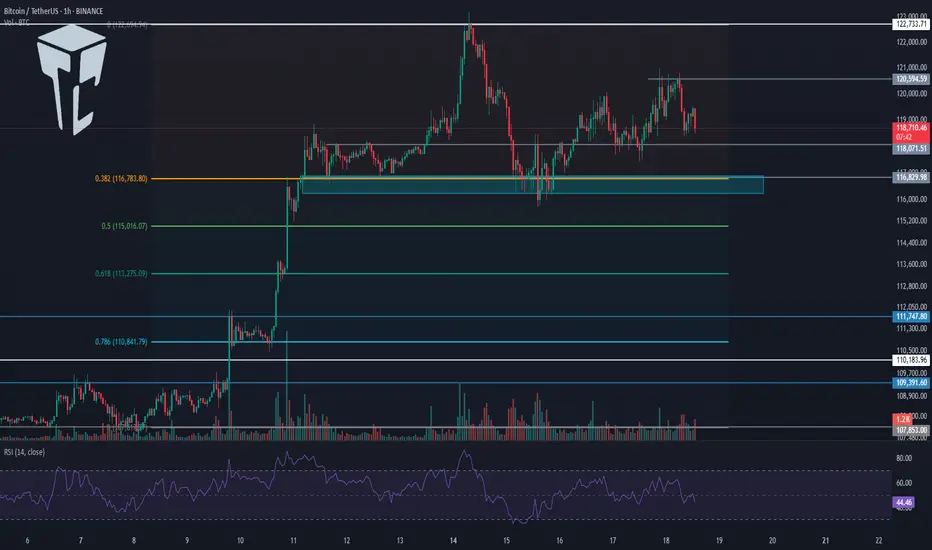
TradeCityPro | Bitcoin Daily Analysis #131👋 Welcome to TradeCity Pro!
Let’s dive into the Bitcoin analysis and key crypto indices. As usual, in this analysis, I’ll review the futures session triggers for New York.
⏳ 1-hour timeframe
Over the past few days, the market hasn't been very focused on Bitcoin, and altcoins have been moving more strongly to the upside.
⚡️ Bitcoin is still ranging between 116829 and 122733 and is fluctuating between these two levels.
💥 Currently, a local top has formed at 120594, and if that level breaks, we can open a long position. The main long trigger will be the breakout of 122733.
📈 If the market decides to correct, key support levels are 118071 and 116829. I’m setting the stop-loss for my previously opened positions below the 116000 zone.
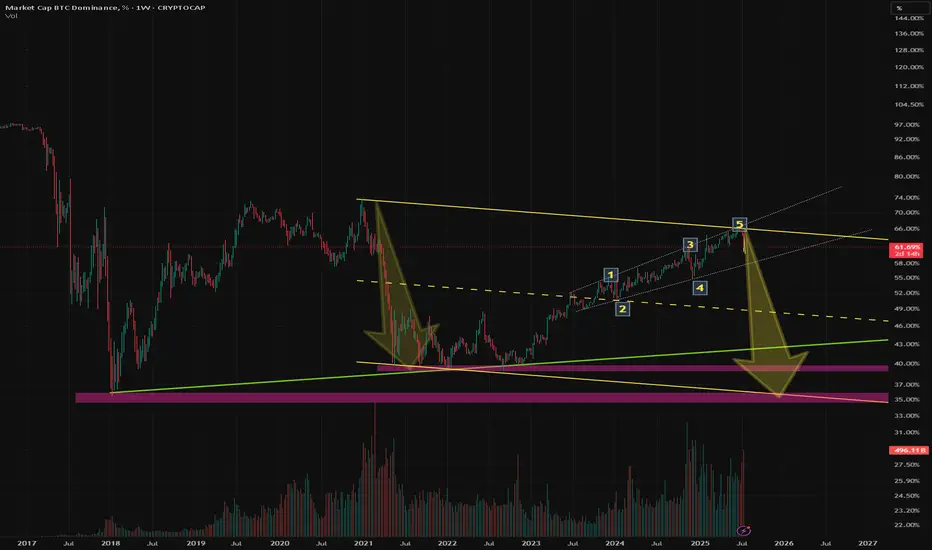
👑 BTC.D Analysis
Let’s look at Bitcoin Dominance. The reason I’m saying Bitcoin isn't currently the center of attention is exactly this dominance chart.
🔔 As you can see, BTC Dominance is in a very sharp downtrend with strong momentum, which means capital is flowing out of Bitcoin and into altcoins—giving us better long setups on alts.
✨ For now, I see the trend as bearish, and the next supports are at 61.34 and 60.49.
📅 Total2 Analysis
Total2 is still moving upward and has broken above 1.46, continuing its upward momentum.
✔️ The new top is at 1.5, and a breakout above this level can be used as a trigger for long entries.
📅 USDT.D Analysis
Let’s move to Tether Dominance. The 4.22 support was broken yesterday, and the index is now moving downward.
💫 The next support level is 4.08, and breaking that will confirm continuation of the downtrend.
❌ Disclaimer ❌
Trading futures is highly risky and dangerous. If you're not an expert, these triggers may not be suitable for you. You should first learn risk and capital management. You can also use the educational content from this channel.
Finally, these triggers reflect my personal opinions on price action, and the market may move completely against this analysis. So, do your own research before opening any position.
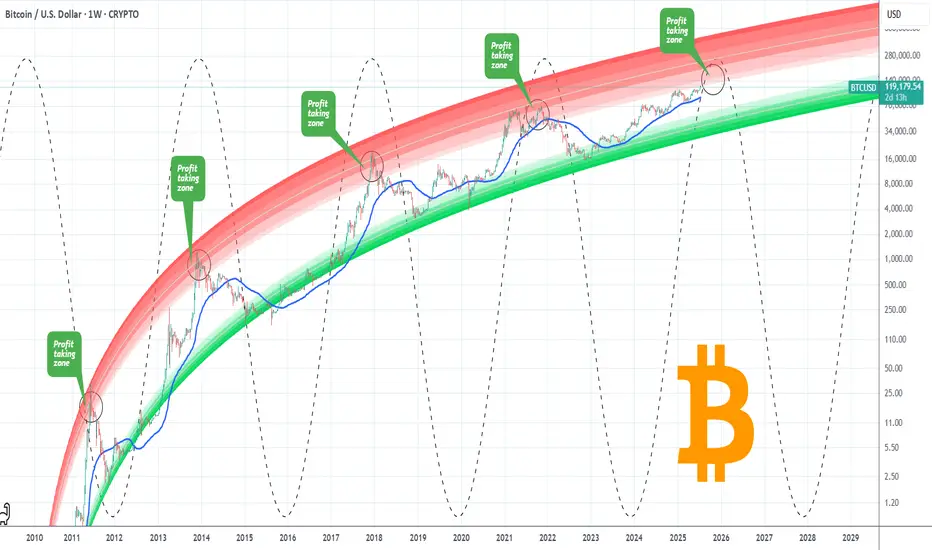
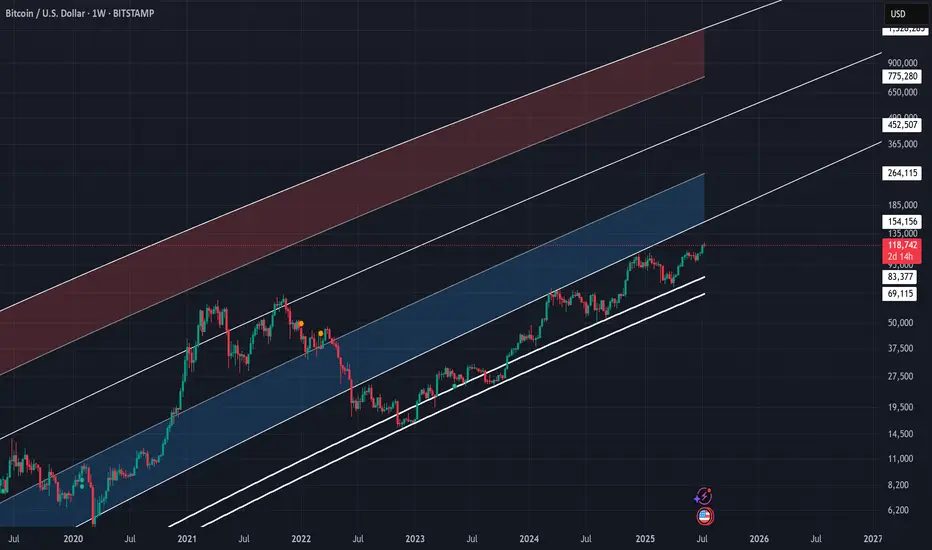
BITCOIN Entering Cyclical Profit Zone. Risk should be limited.Bitcoin (BTCUSD) has just entered the first level of the Logarithmic Growth Curve (LGC) Resistance Zone, which is the light pink band. The Top of the previous Cycle was priced at the top of the band just above this.
In fact every BTC Cycle had this as the 'Profit taking Zone'. The market marginally touched that also within December 2024 - January 2025 but got rejected, almost in similar fashion as January 2021, which was a Double Top approach of the peak formation during the previous Cycle.
This Cycle Top is expected to be within October - November 2025, so we call this the 'Profit Taking Zone' for a reason. Risk exposure from now on should be getting more and more limited. Peak range (depending of the nature of aggression of potential Rate Cuts in September) could be anywhere within $140 - 200k.
Do you think this is the time to start limiting BTC exposure, perhaps moving some of the huge profits to alts? Feel free to let us know in the comments section below!
-------------------------------------------------------------------------------
** Please LIKE 👍, FOLLOW ✅, SHARE 🙌 and COMMENT ✍ if you enjoy this idea! Also share your ideas and charts in the comments section below! This is best way to keep it relevant, support us, keep the content here free and allow the idea to reach as many people as possible. **
-------------------------------------------------------------------------------
💸💸💸💸💸💸
👇 👇 👇 👇 👇 👇
is AltSeason Started ????"The altcoin season has likely begun! We're currently witnessing Bitcoin's dominance chart breaking down at a critical juncture, and this cycle may surpass even our most optimistic expectations. The technical signals are remarkably clear and verifiable for most seasoned traders. In these market conditions, the wisest strategy is to hold strong with conviction – maintain your positions and trust in the assets you've carefully accumulated. This could very well be the start of an extended altcoin rally that rewards patience and strategic positioning. #AltSeason #CryptoMarket #BTCDominance #HODLStrategy"
BTCUSD | 1W Time Frame | BITSTAMP ExchangeI have been using curve analysis for Bitcoin on the weekly time frame for a long time, employing two indicators: My BTC Log Curve and Bitcoin Logarithmic Growth Curves, of course, with my own custom settings to achieve maximum harmony with price movements. I recommend that to gain a precise understanding of Bitcoin curve analysis, you search for and study it, and make use of the two free indicators mentioned above.
Bitcoin finally managed to break free from the curve floor in the second week of September 2023, initiating a logical and gradual upward trend. Currently, it is supported by a significant level around $84,000 (keeping in mind that this rate will gradually increase due to the market's floating nature). However, the most critical price ceiling for Bitcoin in the current bullish market trend is approximately $154,000. Given the acceptable momentum of the current upward trend, reaching this price target seems reasonable. Nevertheless, we should anticipate a corrective reaction from the market, considering the historical behavior in this price range.
In summary, it can be stated that for mid-term holders, the price target of $154,000 appears to be a realistic and attainable goal, while the price floor of $84,000 serves as a very suitable level for buying and re-accumulating.
ETH 1D Overview Finally we are seeing altcoins regaining lost ground on Bitcoin and the second largest crypto by market cap is rallying strong.
Since ETH has such strength currently the opportunity to short is quite slim with high risk, however I think it's important to see where ETH may find some resistance or if a pullback was to happen, where would it come from?
The first level is the bearish orderblock level that has just been tapped as of writing. This area previously began the sell-off at the end of 2024 by confirming a new lower high. Naturally this area will present problems for the bulls and so a potential pullback could be initiated from this level. I would like to see a sweep of the stop loss positions just above the area and then a SFP to confirm the pullback is in motion.
Should the bearish orderblock fail the next clear level is the daily local top around $4000. A big even level and the area that started 5 months of downtrend. IMO the most likely level where longs will take profit. I do think if we see any form of consolidation between the bearish orderblock and the local high the bulls will look to carry the rally on, shallow pullbacks maintain momentum
Ten out of the last eleven days have been green candles with the only one day being red just above a key high, I expect if we are to get a pullback that bullish orderblock area ($2900-3000) to be retested as support. Therefor if any of the above areas initiate a pullback this area should provide support and therefor a long entry.
To clarify I am in no way bearish about Ethereum, this is just a plan for different eventualities.
