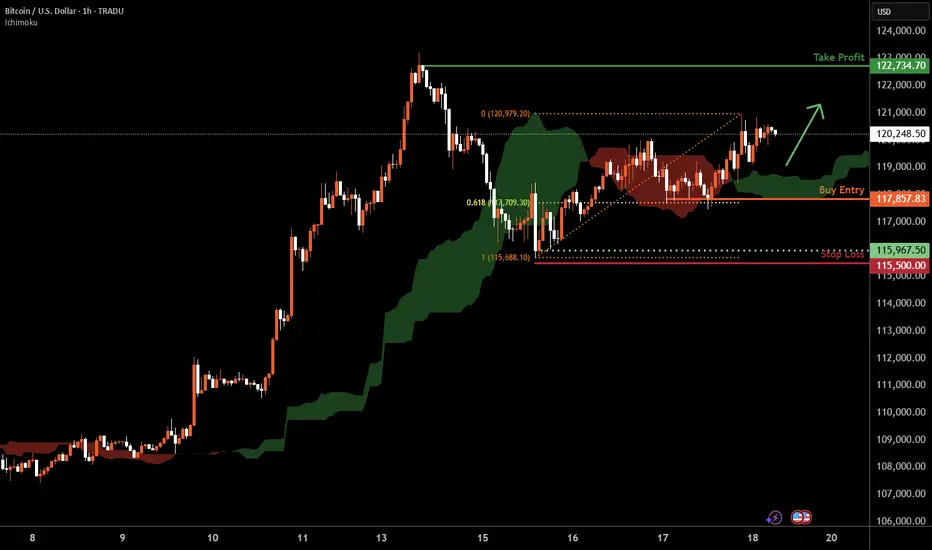
Bitcoin H1 | Falling toward a 61.8% Fibonacci supportBitcoin (BTC/USD) is falling towards a swing-low support and could potentially bounce off this level to climb higher.
Buy entry is at 117,857.83 which is a swing-low support that aligns with the 61.8% Fibonacci retracement.
Stop loss is at 115,500.00 which is a level that lies underneath a swing-low support.
Take profit is at 122,734.70 which is a swing-high resistance.
High Risk Investment Warning
Trading Forex/CFDs on margin carries a high level of risk and may not be suitable for all investors. Leverage can work against you.
Stratos Markets Limited (tradu.com ):
CFDs are complex instruments and come with a high risk of losing money rapidly due to leverage. 66% of retail investor accounts lose money when trading CFDs with this provider. You should consider whether you understand how CFDs work and whether you can afford to take the high risk of losing your money.
Stratos Europe Ltd (tradu.com ):
CFDs are complex instruments and come with a high risk of losing money rapidly due to leverage. 66% of retail investor accounts lose money when trading CFDs with this provider. You should consider whether you understand how CFDs work and whether you can afford to take the high risk of losing your money.
Stratos Global LLC (tradu.com ):
Losses can exceed deposits.
Please be advised that the information presented on TradingView is provided to Tradu (‘Company’, ‘we’) by a third-party provider (‘TFA Global Pte Ltd’). Please be reminded that you are solely responsible for the trading decisions on your account. There is a very high degree of risk involved in trading. Any information and/or content is intended entirely for research, educational and informational purposes only and does not constitute investment or consultation advice or investment strategy. The information is not tailored to the investment needs of any specific person and therefore does not involve a consideration of any of the investment objectives, financial situation or needs of any viewer that may receive it. Kindly also note that past performance is not a reliable indicator of future results. Actual results may differ materially from those anticipated in forward-looking or past performance statements. We assume no liability as to the accuracy or completeness of any of the information and/or content provided herein and the Company cannot be held responsible for any omission, mistake nor for any loss or damage including without limitation to any loss of profit which may arise from reliance on any information supplied by TFA Global Pte Ltd.
The speaker(s) is neither an employee, agent nor representative of Tradu and is therefore acting independently. The opinions given are their own, constitute general market commentary, and do not constitute the opinion or advice of Tradu or any form of personal or investment advice. Tradu neither endorses nor guarantees offerings of third-party speakers, nor is Tradu responsible for the content, veracity or opinions of third-party speakers, presenters or participants.
Bitcoin (Cryptocurrency)
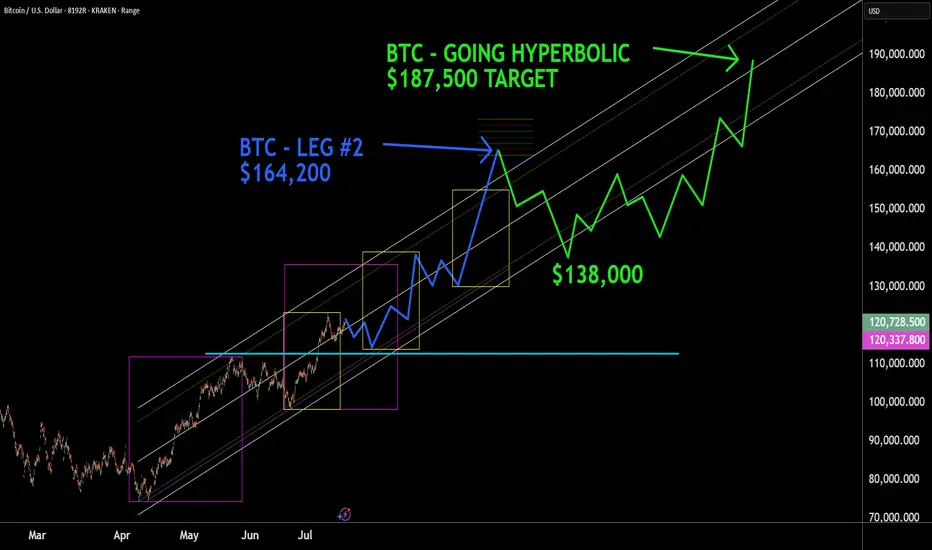
BTC - HYPERBOLIC FINISH This box here where we right shit in, what it really worth? You will never understand technical analysis if you think reading words in a little box mean something. BTC , next top mid frame with a throw over of center to $164,000. Then consolidation around the core to $138,000, then the hyperbolic finish to $187,500+. Nuf said. Good luck. Volatility will be high, but mainly move in one direction. Murrey Math, ( Which trading view wont let me display because its an unpublished indicator , Elliott Wave, Kumar Wave being used for this forecast.
4:1 R:R trade setup for ARKMEverything is pumping right now, and this one also offers a 4:1 R:R setup.
Entry: 0.596
Stop Loss: 0.500
Target: 0.950
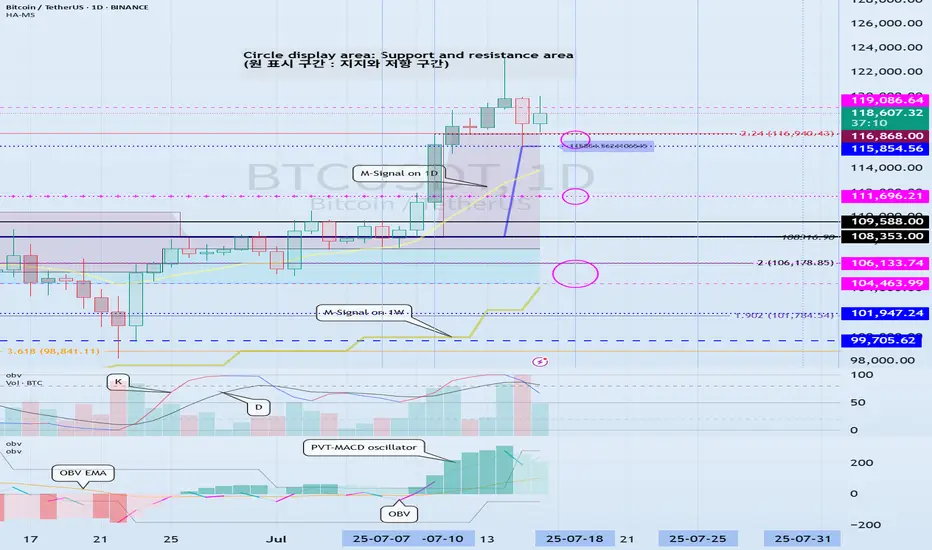
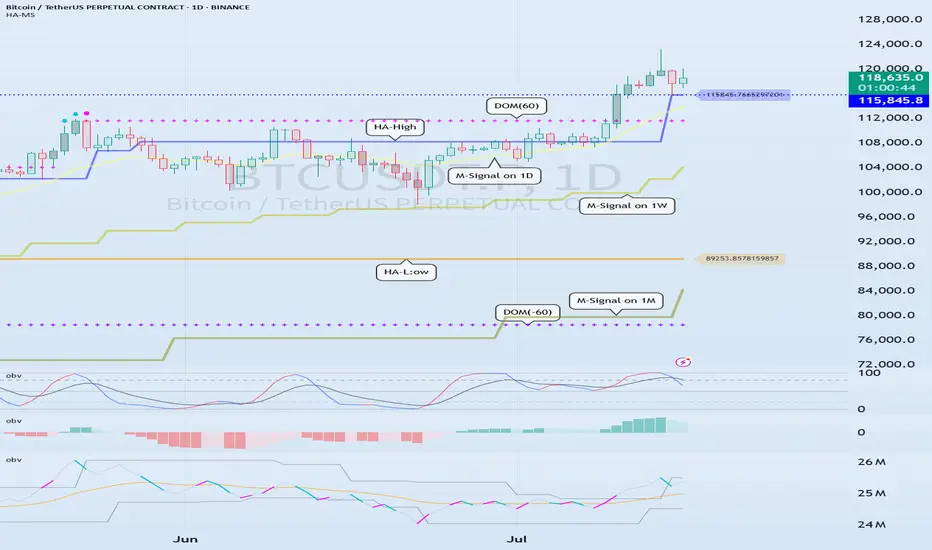
Check support at 115854.56-119086.64
Hello, traders.
If you "Follow", you can always get new information quickly.
Have a nice day today.
-------------------------------------
(BTCUSDT 1D chart)
On the 1W chart, the DOM(60) indicator was created at the 119086.64 point.
Accordingly, the key is whether it can be supported near 119086.64.
The meaning of the DOM(60) indicator is to show the end of the high point.
In other words, if it rises above HA-High ~ DOM(60), it means that there is a high possibility of a stepwise upward trend.
On the other hand, if it fails to rise above DOM(60), it is likely to turn into a downtrend.
The basic chart for chart analysis is the 1D chart.
Therefore, if possible, check the trend of the 1D chart first.
The DOM(60) indicator of the 1D chart is currently formed at the 111696.21 point.
And, the HA-High indicator was created at the 115854.56 point.
Therefore, since it cannot be said that the DOM(60) indicator of the 1D chart has been created yet, if the price is maintained near the HA-High indicator, it seems likely to rise until the DOM(60) indicator is created.
We need to look at whether the DOM(60) indicator will be created while moving sideways at the current price position or if the DOM(60) indicator will be created when the price rises.
If the price falls and falls below 111696.21, and the HA-High indicator is generated, the HA-High ~ DOM(60) section is formed, so whether there is support in that section is the key.
-
Since the DOM(60) indicator on the 1W chart was generated, if it fails to rise above the DOM(60) indicator, it is highly likely that the HA-High indicator will be newly generated as it eventually falls.
Therefore, you should also look at where the HA-High indicator on the 1W chart is generated when the price falls.
-
The next volatility period is around July 18 (July 17-19).
Therefore, you should look at which direction it deviates from the 115854.56-119086.64 section after this volatility period.
Since the K of the StochRSI indicator fell from the overbought section and changed to a state where K < D, it seems likely that the rise will be limited.
However, since the PVT-MACD oscillator indicator is above 0 and the OBV indicator is OBV > OBV EMA, it is expected that the support around 115845.56 will be important.
-
Thank you for reading to the end.
I hope you have a successful trade.
--------------------------------------------------
- Here is an explanation of the big picture.
(3-year bull market, 1-year bear market pattern)
I will explain the details again when the bear market starts.
------------------------------------------------------
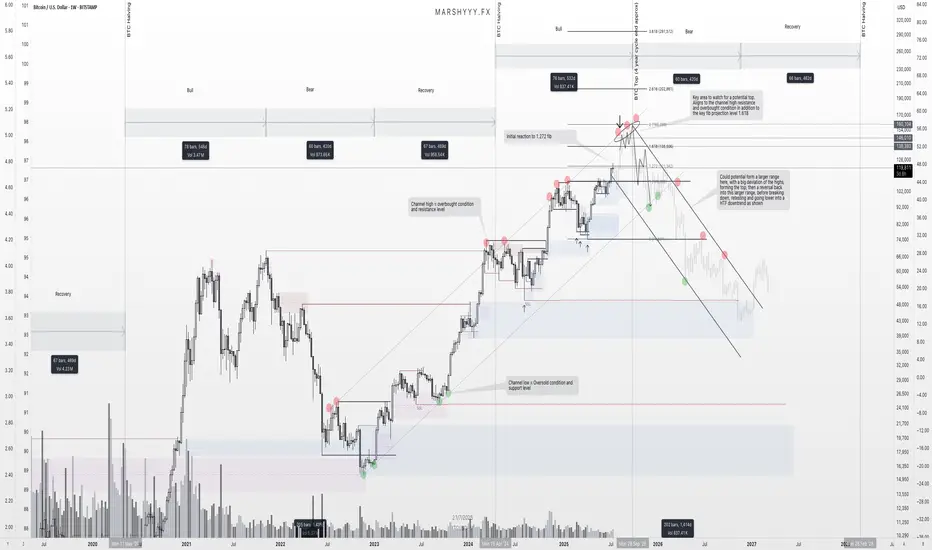
BTC – Final Push Before the Top? Here's What I’m WatchingBeen getting a lot of questions recently about where I think BTC tops this cycle, so I figured it’s time to lay out what I’m seeing on the higher timeframes and what could be coming next.
First off, I want to stress this again — USDT.D will be the key chart for spotting the top. It’s been one of the most accurate indicators across the board for understanding tops and bottoms. But it’s even more powerful when used alongside broader structure and confluence, which is what I’m doing here.
Looking at BTC’s high timeframe structure, I’ve been tracking this ascending trend channel since 2023 — and we’ve remained within its bounds beautifully. Every leg up has been met with a reaction near the channel highs, while each major correction has tapped into the lower channel support or just below midline before continuing the trend.
Right now, price is pushing back up toward that upper channel resistance, and if it behaves like it has previously, I’d expect it to act as a major magnet again. That aligns with a projected range of $140,000 to $160,000, depending how deep the wick runs or how extended this move gets from the channel midline.
On top of that, fib extensions from the previous high to low give us another layer of confidence. We’ve already seen a reaction at the 1.272 level, which paused price temporarily. The next big fib? The 1.618 — which sits right around $138k — adding confluence with the top of this HTF trend channel.
What makes this even more interesting is that this move is aligning near-perfectly with the 4-year cycle structure, which suggests a potential cycle top around September 2025. That’s roughly two months away, and it fits the pattern of previous cycles where BTC tops approximately 18–20 months post-halving.
As we approach this zone, I’ll be watching for the usual signs: slowing momentum, bearish divergence, volume anomalies, and rejection candles into resistance. But I won’t just be relying on the BTC chart alone. I’ll be stacking confluences from other key indicators too — USDT.D, BTC.D, macro risk indicators, and stablecoin flows — to confirm if this is truly the top or if there’s one more leg left in the tank.
Once the top does form, whether it's $138k or $160k or somewhere in between, I think we move into the distribution phase that begins the next macro downtrend. The next few years will be about preservation and accumulation again, and I’m already eyeing zones like $49k and below as potential long-term HTF demand levels when that time comes.
For now, we’re in what I believe is the final bullish leg of this cycle. I’m positioned, prepared, and watching closely for signs of exhaustion as we move into this zone of confluence.
Let the market do its thing — just make sure you’ve got a plan for when the music stops.
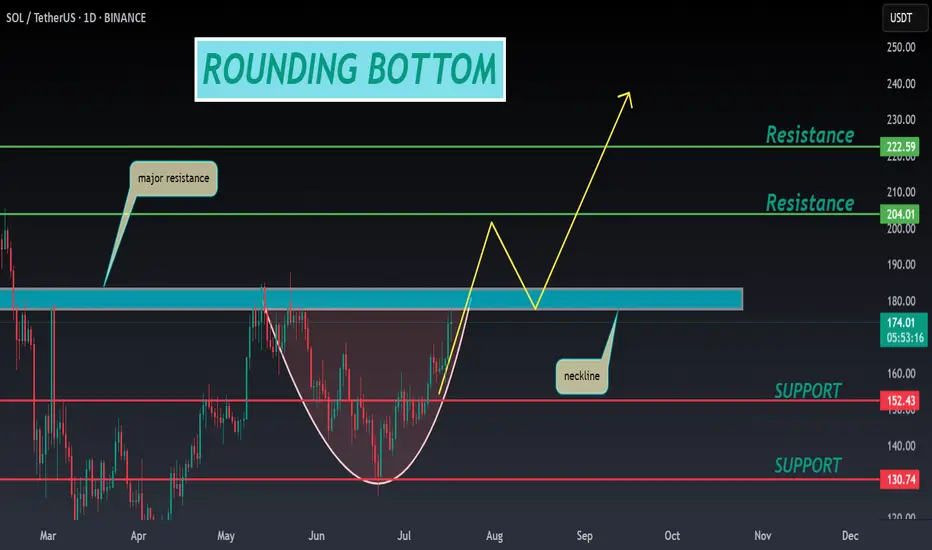
SOL ANALYSIS🔮 #SOL Analysis 💰💰
📊 #SOL is making perfect and huge rounding bottom pattern in daily time frame, indicating a potential bullish move. If #SOL retests little bit and breakout the pattern with high volume then we will get a bullish move📈
🔖 Current Price: $173.75
⏳ Target Price: $204.00
⁉️ What to do?
- We have marked crucial levels in the chart . We can trade according to the chart and make some profits. 🚀💸
#SOL #Cryptocurrency #Pump #DYOR
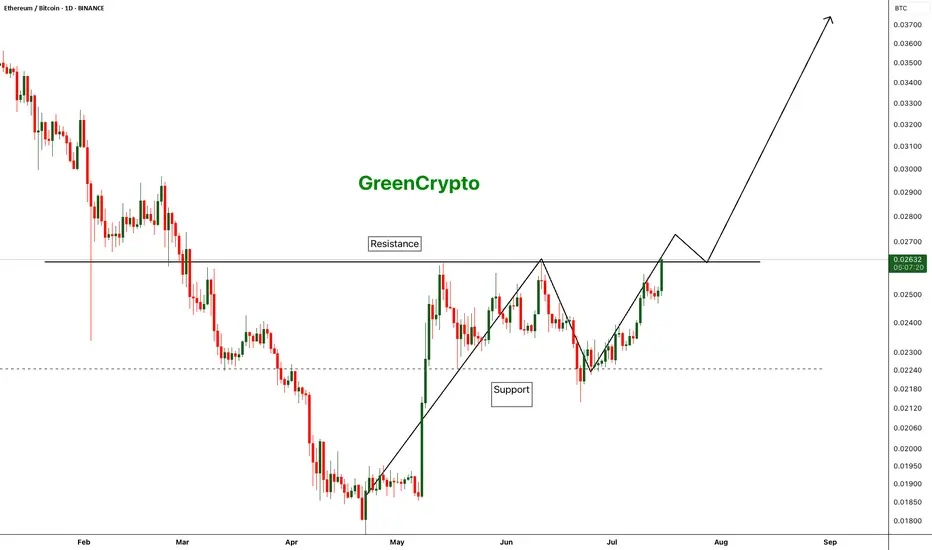
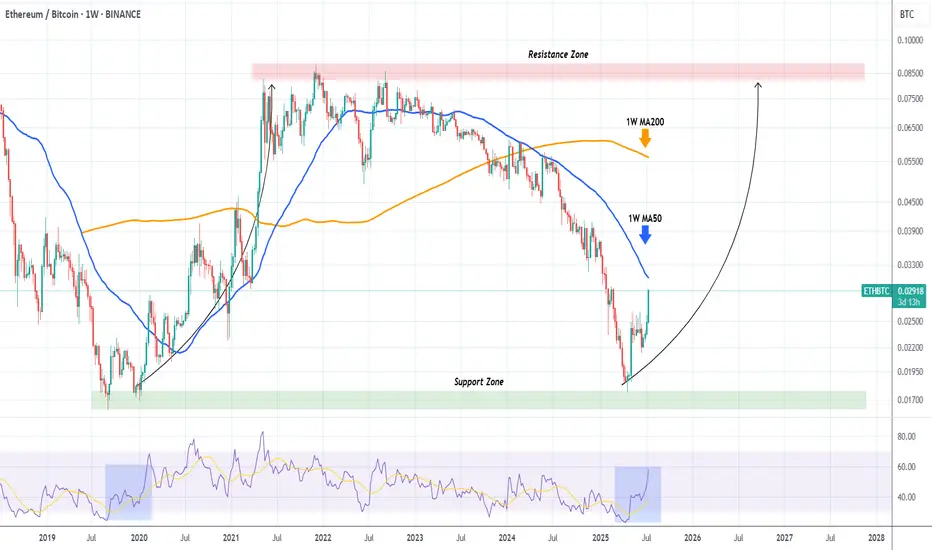
ETH/BTC - Finally Trend is reversing - After a long time we are finally seeing a change in the trend of ETH/BTC pair.
- Compared to BTC, ETH was underperforming for last couple of years and we are seeing some strength in ETH
- If this trend continue we can finally see some new ATH on ETH
Entry: 0.02633
StopLoss: 0.02125
TP1: 0.02825
TP2: 0.03168
TP3: 0.03592
Don't forget to keep stop loss. Stay tuned for more updates
Cheers
GreenCrypto
BTCUSD - Exhausted? Second time rejected, now down.BTCUSD got rejected at the Centerline the second time. This is super bearish. If it's closing below yesterdays low, that's a clear short signal to me.
Taking 50% gains off the table is never bad. Because then you still have 50% if it's going up further. Otherwise, you got 50% booked.
Don't let gree eat your brain §8-)

Fartcoin - Rangebound repeat? A BTC makes new highs attention has turned towards altcoins to play catch up.
FARTCOIN has been a top performer of the last month and currently on the 1D timeframe finds itself in a rangebound environment capped between $1.1923 - $1.3945. The end of last week price trended down in a bearish channel from top to bottom and it looks to be doing the same currently. As the supply zone above the range high got swept, price printed a SFP getting back inside the range and began trending down, for me there are two actionable long entries here:
- A range low bounce + breakout of trend channel would be an ideal long entry. An area of clear support coupled with a breakout is a historically strong setup with a clear invalidation if price breaks below the range and gets accepted.
- A more aggressive but potentially less ideal setup would be a breakout of the downtrend before hitting range lows. Higher risk as the level of support is not as defined but in the more risk-on environment crypto is currently in, the chance of major support levels being front run does go up as buyers become more impatient when FOMO grows.
The midpoint is key level to look out for too as a reclaim would mean a run at the highs, rejection opens the door to retest the lows.

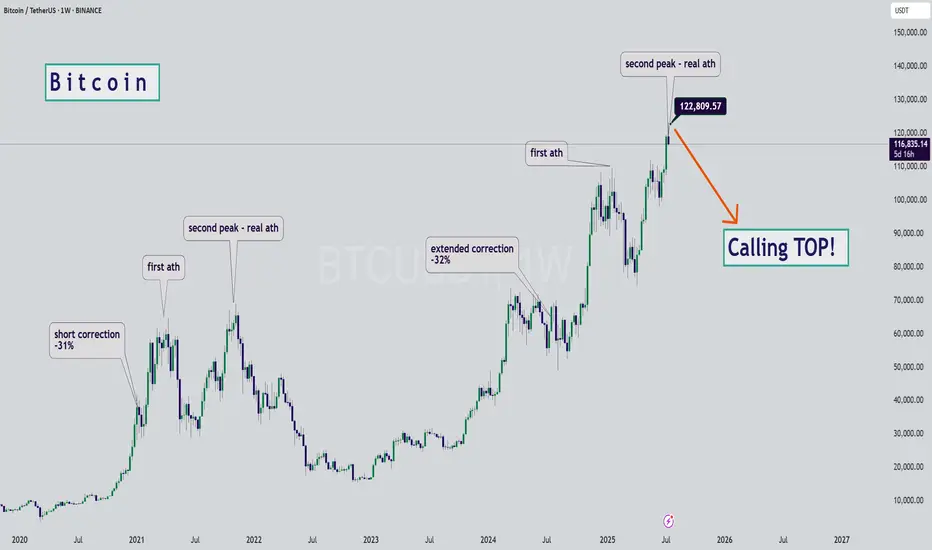
BTC - Calling the Start of the Bearish SeasonHello Watchers ☕
This was my previous Bitcoin update where I had a target of $116K, and also then closed all open positions at $122K:
I'm calling the top here mainly because of the way the chart looks, it really is classic Wyckoff if you look at the duration of the current bullish cycle, which has lasted a whole 973 Days with a 564% increase. What goes up, must come down!
Just for interest sake, the previous bullish cycle ran for 600 days with a 700% increase.
SOL/USDT : SOL Rebounds Strong – Is a 25% Rally Just Beginning?By analyzing the Solana (SOL) chart on the daily timeframe, we can see that after dropping to the $147.75 zone, the price experienced renewed buying pressure and has since rallied to around $159, delivering over 6% return so far.
This cryptocurrency shows strong bullish potential, with short-term gains possibly exceeding 25%.
The next upside targets are $168.5, $187, $220, and $263.
Please support me with your likes and comments to motivate me to share more analysis with you and share your opinion about the possible trend of this chart with me !
Best Regards , Arman Shaban
ADA/USDT : +50% in 21 Days, More Rise Ahead? (READ THE CAPTION)Over 50% growth in just 21 days — Cardano’s explosive rally continues, and the $0.76 target has now been hit! Since our last analysis, ADA has kept pushing higher, successfully reaching the next key level and bringing the total return from this move above 50%. Currently trading around $0.73, with strong bullish momentum still in play, I expect it won’t be long before we head toward the next targets. Upcoming levels to watch: $0.93, $1.05, and $1.33 — we’re getting closer to that 100% gain!
Please support me with your likes and comments to motivate me to share more analysis with you and share your opinion about the possible trend of this chart with me !
Best Regards , Arman Shaban
TON/USDT : Get Ready for a new Rally! (READ THE CAPTION)By analyzing the Toncoin chart on the 3-day timeframe, we can see that the price has finally managed to grow over 3% as expected, and is currently consolidating above the $3 level. We’ll have to see how far this bullish momentum can continue — but to be honest, I expected a stronger move considering the market rally and Bitcoin repeatedly hitting new ATHs. Still, no worries — once Bitcoin takes a breather, altcoins will likely begin their powerful runs! Based on previous analysis, the next targets are $3.15, $3.63, $4.20, and $4.68 respectively.
Please support me with your likes and comments to motivate me to share more analysis with you and share your opinion about the possible trend of this chart with me !
Best Regards , Arman Shaban
ETHBTC shows that Ethereum will outperform Bitcoin MASSIVELY!The ETHBTC pair has been rebounding hyper aggressively after the April 21 2025 Low on the 6-year Support Zone, and is now facing it's most important test, the 1W MA50 (blue trend-line).
This trend-line has been its Resistance since basically March 13 2023, so if broken, it will be a massive bullish break-out signal.
In fact during the 2020 - 2021 Bullish Leg, once the price broke above the 1W MA50, the market got the final confirmation of the upcoming long-term rally.
We expect Ethereum to outperform Bitcoin for the rest of the year at least.
-------------------------------------------------------------------------------
** Please LIKE 👍, FOLLOW ✅, SHARE 🙌 and COMMENT ✍ if you enjoy this idea! Also share your ideas and charts in the comments section below! This is best way to keep it relevant, support us, keep the content here free and allow the idea to reach as many people as possible. **
-------------------------------------------------------------------------------
💸💸💸💸💸💸
👇 👇 👇 👇 👇 👇
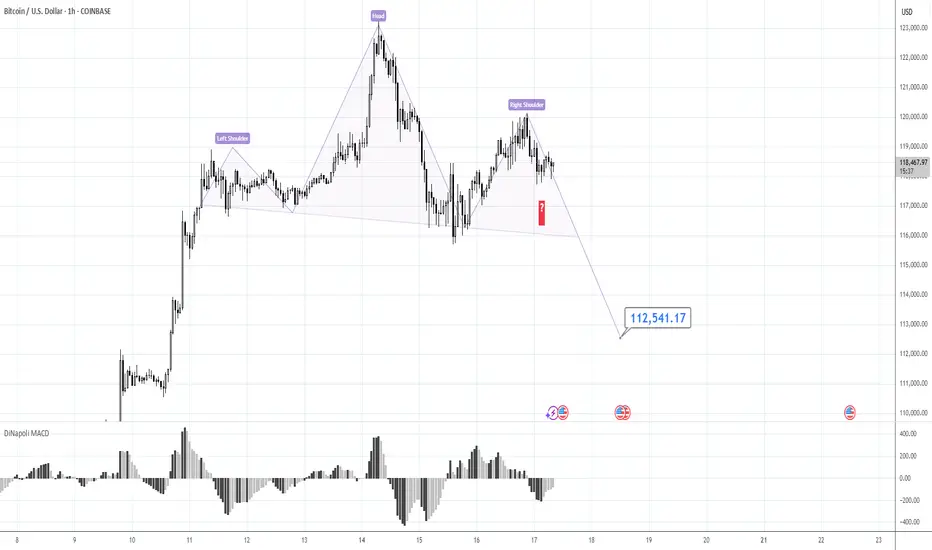
BITCOIN PREDICTION: INSIDER DATA THAT WILL HIT YOU HARD(warning)I am sharing with you my personal insider data of what I know about Bitcoin right now!

120K is the Key.Morning folks,
Our last plan worked perfect - market re-tested 117K support and jumped out. If you have longs - you could keep it.
We consider now two alternative scenarios, although we think that this one with triangle is more probable, we do not exclude the H&S shape on 1H chart that could lead BTC down to 112-113K support area.
So, if you do not know how to deal with this - keep an eye on the 120K area and top of the right arm. Upside breakout will confirm H&S failure and triangle scenario. Otherwise, until market stands under 120K - consider H&S as a basic scenario, just for safety.
Take care, S.
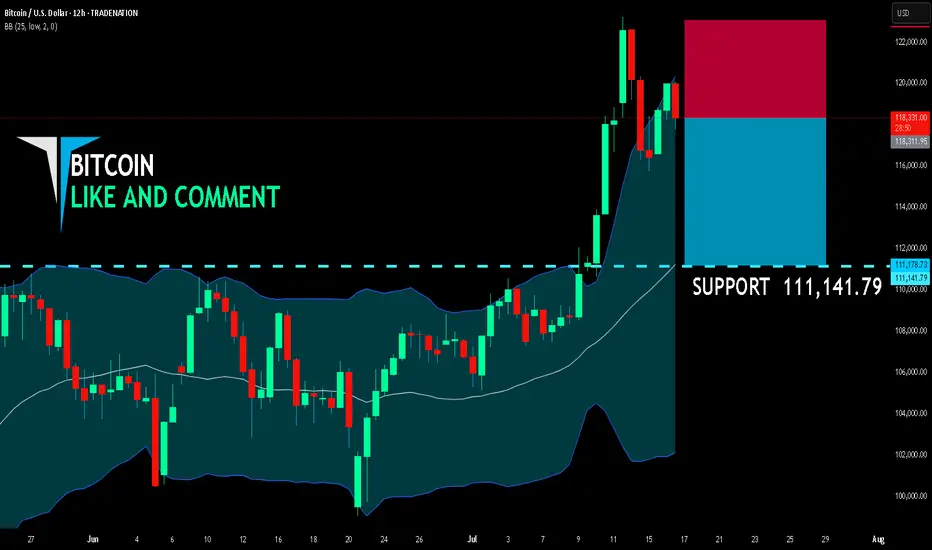
BITCOIN SHORT FROM RESISTANCE
BITCOIN SIGNAL
Trade Direction: short
Entry Level: 118,311.95
Target Level: 111,141.79
Stop Loss: 123,054.98
RISK PROFILE
Risk level: medium
Suggested risk: 1%
Timeframe: 12h
Disclosure: I am part of Trade Nation's Influencer program and receive a monthly fee for using their TradingView charts in my analysis.
✅LIKE AND COMMENT MY IDEAS✅
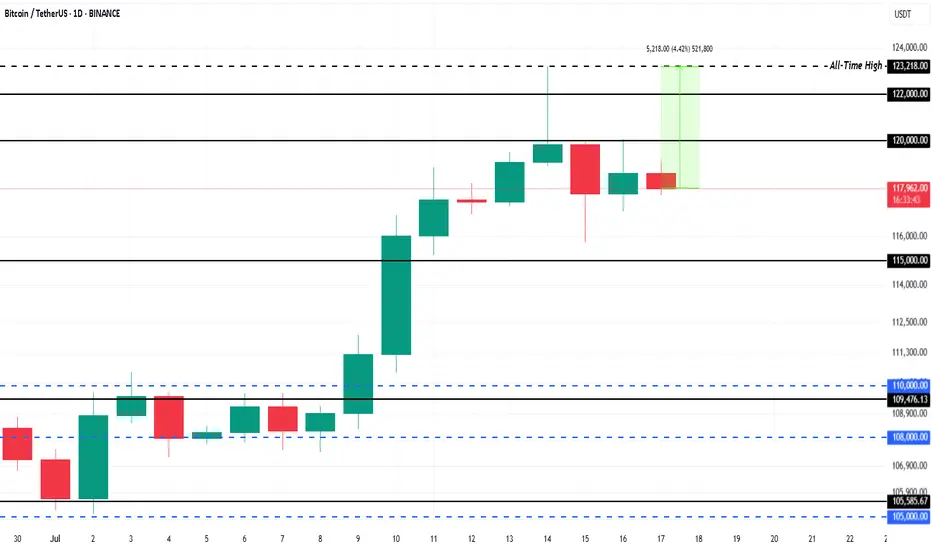
$1.5 Billion ETF Inflows Could Push Bitcoin Price 4% to New ATHBINANCE:BTCUSDT is currently trading at $118,325, facing resistance at the $120,000 level. This resistance is crucial for Bitcoin if it wants to break back to its ATH of $123,218 . The 4.4% gap to reach the ATH indicates potential for growth, but Bitcoin needs to secure support above $120,000 for this to happen.
This week, spot BINANCE:BTCUSDT exchange-traded funds (ETFs) saw over $1.5 billion in inflows , a significant portion of which occurred in the last 48 hours during Bitcoin’s dip.
The influx of institutional money highlights that investors are confident in Bitcoin’s potential despite the market cooling. If this trend persists, it could propel BINANCE:BTCUSDT price upward, as institutional support provides stability.
If BINANCE:BTCUSDT can hold above $120,000 and push past $122,000, it could continue its ascent toward new all-time highs. The current market conditions and ETF inflows support a bullish outlook, with a significant chance of breaking the resistance.
However, the risk of profit-taking remains , which could lead to a price drop. If BINANCE:BTCUSDT faces selling pressure, it could fall back to $115,000 , erasing a portion of recent gains. This would invalidate the bullish thesis, causing Bitcoin to retest lower support levels.
Bitcoin and Upcoming TrendBitcoin’s trend has been growing from strength to strength — and it’s likely to stay that way. Why?
This trend isn’t driven purely by speculation; it’s supported by strong fundamental reasons.
One of the most widely debated topics in finance today is the comparison between Bitcoin and gold. While both are viewed as stores of value, their long-term roles may diverge significantly.
Yet, they’ve been moving in near-perfect synchronization, with potential resistance ahead, but their trend still remain intact — and here’s why.
Mirco Bitcoin Futures and Options
Ticker: MBT
Minimum fluctuation:
$5.00 per bitcoin = $0.50 per contract
Disclaimer:
• What presented here is not a recommendation, please consult your licensed broker.
• Our mission is to create lateral thinking skills for every investor and trader, knowing when to take a calculated risk with market uncertainty and a bolder risk when opportunity arises.
CME Real-time Market Data help identify trading set-ups in real-time and express my market views. If you have futures in your trading portfolio, you can check out on CME Group data plans available that suit your trading needs tradingview.sweetlogin.com

Need a trading strategy to avoid FOMO
Hello, traders.
If you "Follow", you can always get new information quickly.
Have a nice day today.
-------------------------------------
1D chart is the standard chart for all time frame charts.
In other words, if you trade according to the trend of the 1D chart, you can make profits while minimizing losses.
This can also be seen from the fact that most indicators are created based on the 1D chart.
In that sense, the M-Signal indicators of the 1M, 1W, and 1D charts are suitable indicators for confirming trends.
If the price is maintained above the M-Signal indicator of the 1M chart, it is highly likely that the upward trend will continue in the medium to long term, so it is recommended to take note of this advantage especially when trading spot.
The M-Signal indicator on the 1W, 1D chart shows the medium-term and short-term trends.
The M-Signal indicator uses the MACD indicator formula, but it can be seen as a price moving average.
You can trade with just the price moving average, but it is difficult to select support and resistance points, and it is not very useful in actual trading because it cannot cope with volatility.
However, it is a useful indicator when analyzing charts or checking general trends.
Therefore, what we can know with the M-Signal indicator (price moving average) is the interrelationship between the M-Signal indicators.
You can predict the trend by checking how far apart and close the M-Signal indicators are, and then checking the direction.
-
If you have confirmed the trend with the M-Signal indicator, you need support and resistance points for actual trading.
Support and resistance points should be drawn on the 1M, 1W, and 1D charts.
The order of the roles of support and resistance points is 1M > 1W > 1D charts.
However, the strength of the role of support and resistance points can be seen depending on how long the horizontal line is.
Usually, in order to perform the role of support and resistance points, at least 3 candles or more form a horizontal line.
Therefore, caution is required when trading when the number of candles is less than 3.
The indicators created considering this point are the HA-Low and HA-High indicators.
The HA-Low and HA-High indicators are indicators created for trading on the Heikin-Ashi chart and indicate when the Heikin-Ashi candle turns upward or downward.
Therefore, the creation of the HA-Low indicator means that there is a high possibility of an upward turn.
In other words, if it is supported by the HA-Low indicator, it is a time to buy.
However, if it falls from the HA-Low indicator, there is a possibility of a stepwise decline, so you should also consider a countermeasure for this.
The fact that the HA-High indicator was created means that there is a high possibility of a downward turn.
In other words, if there is resistance from the HA-High indicator, it is a time to sell.
However, if it rises from the HA-High indicator, there is a possibility of a stepwise upward turn, so you should also consider a countermeasure for this.
This is where a dilemma arises.
What I mean is that the fact that the HA-High indicator was created means that there is a high possibility of a downward turn, so you know that there is a high possibility of a downward turn, but if it receives support and rises, you think that you can make a large profit through a stepwise upward turn, so you fall into a dilemma.
This is caused by greed that arises from falling into FOMO due to price volatility.
The actual purchase time should have been when it showed support near the HA-Low indicator, but when it showed a downward turn, it ended up suffering a large loss due to the psychology of wanting to buy, which became the trigger for leaving the investment.
Therefore, if you failed to buy at the purchase time, you should also know how to wait until the purchase time comes.
-
It seems that you can trade depending on whether the HA-Low and HA-High indicators are supported, but the task of checking whether it is supported is quite difficult and tiring.
Therefore, to complement the shortcomings of the HA-Low and HA-High indicators, the DOM(60) and DOM(-60) indicators were added.
The DOM(-60) indicator indicates the end of the low point.
Therefore, if it shows support in the DOM(-60) ~ HA-Low section, it is the purchase time.
If it falls below the DOM(-60) indicator, it means that a stepwise downtrend is likely to begin.
The DOM(60) indicator indicates the end of the high point.
Therefore, if it is supported and rises in the HA-High ~ DOM(60) section, it means that a stepwise uptrend is likely to begin.
If it is resisted and falls in the HA-High ~ DOM(60) section, it is likely that a downtrend will begin.
With this, the basic trading strategy is complete.
This is the basic trading strategy of buying when it rises in the DOM(-60) ~ HA-Low section and selling when it falls in the HA-High ~ DOM(60) section.
For this, the trading method must adopt a split trading method.
Although not necessarily, if it falls in the DOM(-60) ~ HA-Low section, it will show a sharp decline, and if it rises in the HA-High ~ DOM(60) section, it will show a sharp rise.
Due to this volatility, psychological turmoil causes people to start trading based on the price, which increases their distrust in the investment market and eventually leads them to leave the investment market.
-
When looking at the movement of the 1D chart, it can be seen that it is not possible to proceed with trading at the moment because it is already showing a stepwise upward trend.
However, since there is a SHORT position in futures trading, trading is possible at any time.
In any case, it is difficult to select a time to buy because the 1D chart shows a stepwise upward trend.
However, looking at the time frame chart below the 1D chart can help you select a time to buy.
The basic trading strategy is always the same.
Buy when it rises in the DOM(-60) ~ HA-Low section and sell when it falls in the HA-High ~ DOM(60) section.
Currently, since the 1D chart is continuing a stepwise upward trend, the main position is to eventually proceed with a long position.
Therefore, if possible, you should focus on finding the right time to buy.
However, if it falls below the HA-High indicator of the 1D chart, the possibility of a downtrend increases, so at that time, you should focus on finding the right time to sell.
In other words, since the HA-High indicator of the current 1D chart is generated at the 115845.8 point, you should think of different response methods depending on whether the price is above or below the 115845.8 point.
Therefore, when trading futures, increase the investment ratio when trading with the main position (a position that matches the trend of the 1D chart), and decrease the investment ratio when trading with the secondary position (a position that is different from the trend of the 1D chart) and respond quickly and quickly.
When trading in the spot market, you have no choice but to trade in the direction of the 1D chart trend, so you should buy and then sell in installments whenever it shows signs of turning downward to secure profits.
In other words, buy near the HA-Low indicator on the 30m chart, and if the price rises and the HA-High indicator is created, sell in installments near that area.
-
You should determine your trading strategy, trading method, and profit realization method by considering these interrelationships, and then trade mechanically accordingly.
If you trade only with fragmentary movements, you will likely end up suffering losses.
This is because you do not cut your losses.
-
Thank you for reading to the end.
I hope you have a successful trade.
--------------------------------------------------
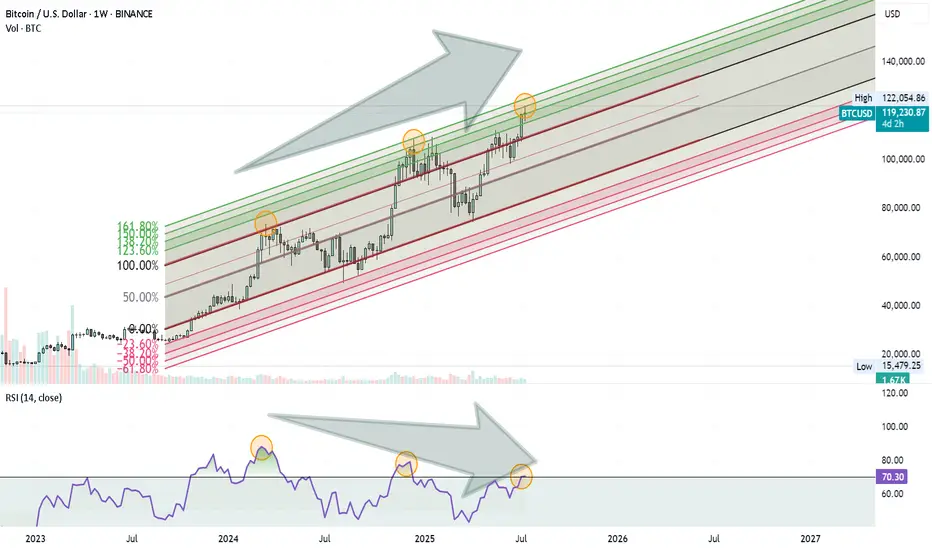
Bitcoin Rally Losing Steam?Bitcoin might be approaching a Turning Point . Here’s what I’m seeing on the weekly chart:
Price is moving inside an ascending Fibonacci channel.
It’s getting close to the 1.60 (160%) extension level, which has acted as a reversal zone before.
At the same time, the RSI is showing a clear negative divergence, suggesting that momentum is weakening.
These signs combined could mean we’re not far from a significant correction.
Nothing is confirmed yet, but it’s a setup worth keeping an eye on.
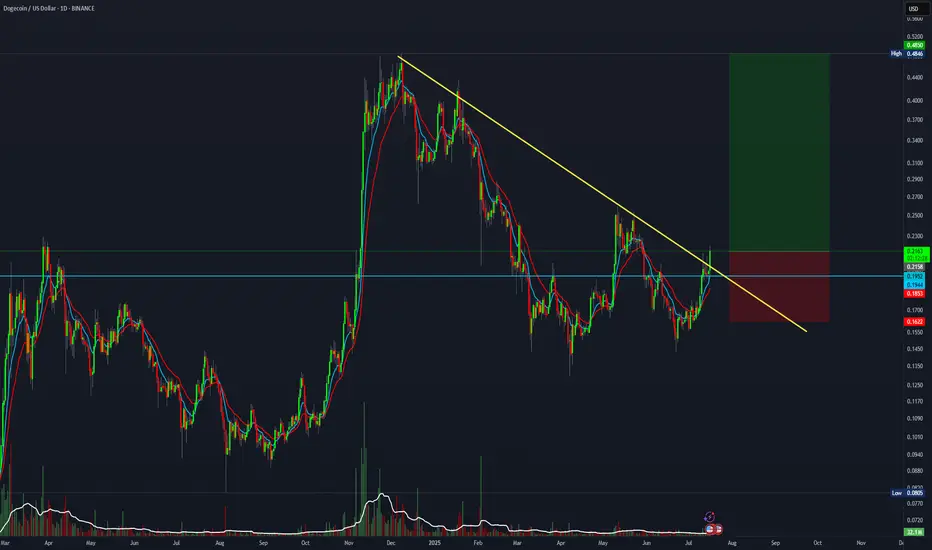
5:1 R:R for Dogecoin.DOGE is breaking out from the trendline. This setup offers a 5:1 R:R
Entry: 0.216
Stop Loss: 0.162
Target: 0.48
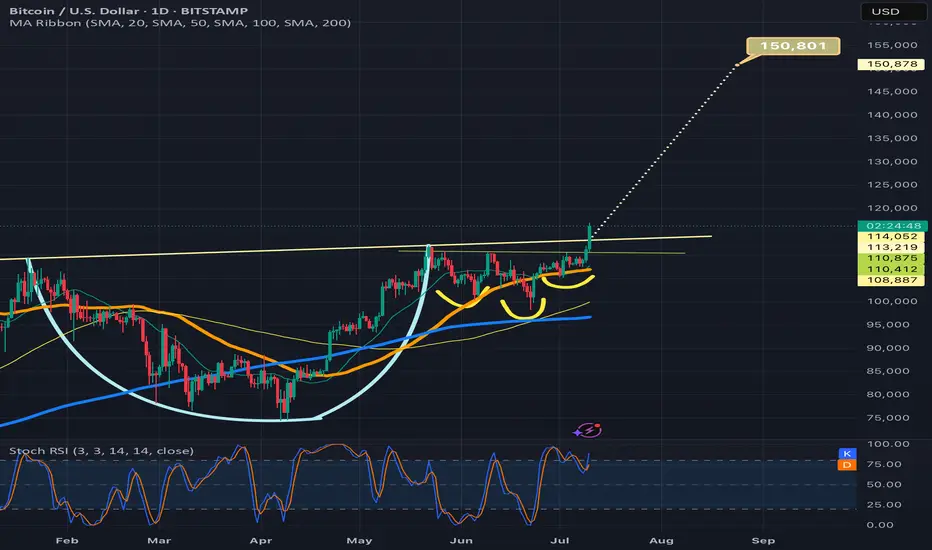
Btcusd breaking above cup and handle necklineIf it confirms the bullish breakout the target is 150k. Also by breaking above 116k and solidifying that level as strong support, we will trigger an even bigger inverse head and shoulders pattern (not shown here) with a breakout target around 208k! I will provide a link below to the chart I posted of that pattern. Thanks for reading, liking, and following. *not financial advice*