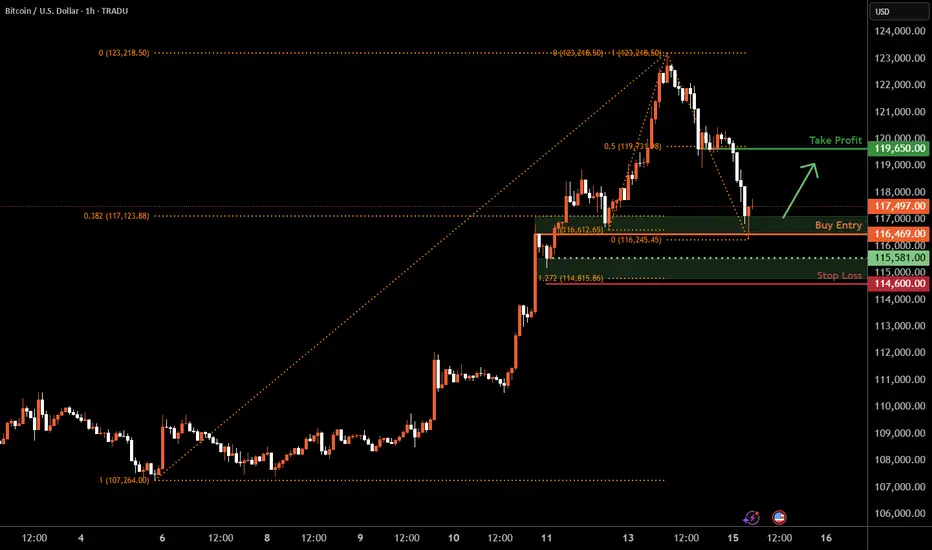
Bitcoin H1 | Potential bounce off a pullback supportBitcoin (BTC/USD) is falling towards a pullback support and could potentially bounce off this level to climb higher.
Buy entry is at 116,469.00 which is a pullback support that aligns closely with the 38.2% Fibonacci retracement.
Stop loss is at 114,600.00 which is a level that lies underneath a swing-low support and the 127.2% Fibonacci extension.
Take profit is at 119,650.00 which is a pullback resistance that aligns with the 50% Fibonacci retracement.
High Risk Investment Warning
Trading Forex/CFDs on margin carries a high level of risk and may not be suitable for all investors. Leverage can work against you.
Stratos Markets Limited (tradu.com ):
CFDs are complex instruments and come with a high risk of losing money rapidly due to leverage. 63% of retail investor accounts lose money when trading CFDs with this provider. You should consider whether you understand how CFDs work and whether you can afford to take the high risk of losing your money.
Stratos Europe Ltd (tradu.com ):
CFDs are complex instruments and come with a high risk of losing money rapidly due to leverage. 63% of retail investor accounts lose money when trading CFDs with this provider. You should consider whether you understand how CFDs work and whether you can afford to take the high risk of losing your money.
Stratos Global LLC (tradu.com ):
Losses can exceed deposits.
Please be advised that the information presented on TradingView is provided to Tradu (‘Company’, ‘we’) by a third-party provider (‘TFA Global Pte Ltd’). Please be reminded that you are solely responsible for the trading decisions on your account. There is a very high degree of risk involved in trading. Any information and/or content is intended entirely for research, educational and informational purposes only and does not constitute investment or consultation advice or investment strategy. The information is not tailored to the investment needs of any specific person and therefore does not involve a consideration of any of the investment objectives, financial situation or needs of any viewer that may receive it. Kindly also note that past performance is not a reliable indicator of future results. Actual results may differ materially from those anticipated in forward-looking or past performance statements. We assume no liability as to the accuracy or completeness of any of the information and/or content provided herein and the Company cannot be held responsible for any omission, mistake nor for any loss or damage including without limitation to any loss of profit which may arise from reliance on any information supplied by TFA Global Pte Ltd.
The speaker(s) is neither an employee, agent nor representative of Tradu and is therefore acting independently. The opinions given are their own, constitute general market commentary, and do not constitute the opinion or advice of Tradu or any form of personal or investment advice. Tradu neither endorses nor guarantees offerings of third-party speakers, nor is Tradu responsible for the content, veracity or opinions of third-party speakers, presenters or participants.
Bitcoin (Cryptocurrency)
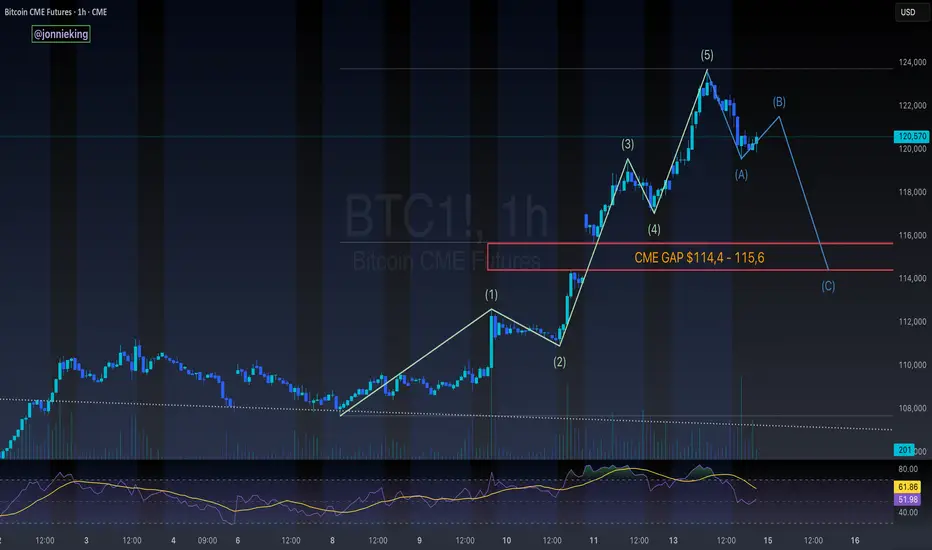
$BTC 5-Wave Impulse > ABC Correction > CME GapCRYPTOCAP:BTC appears to be headed towards an ABC correction after this impulsive 5-wave move to the upside
Would be a great opportunity to fill the CME gap ~$114k
Lines up perfectly with the 50% gann level retracement to confirm the next leg
don't shoot the messenger..
just sharing what i'm seeing 🥸
₿itcoin: Pushing Higher—But Watch for a Reversal AheadAfter taking a brief pause over the weekend, Bitcoin resumed its upward momentum early this morning, trading within the blue Target Zone between $117,553 and $130,891. This marks the first time the cryptocurrency giant has traded above the key $120,000 level. Within this zone, and in line with our primary scenario, we continue to anticipate the peak of the corrective wave B rally, followed by a trend reversal to the downside. We expect a significant wave C decline, targeting the lower blue zone between $62,395 and $51,323. As such, prices in the upper blue Target Zone may present an opportunity to take (partial) profits on existing long positions and, where appropriate, to initiate potential short positions as a hedge. These shorts could be protected with a stop 1% above the upper boundary of the zone, given there remains a 35% probability that Bitcoin could break directly above the $130,891 resistance and set a new high as blue wave alt.(i).
📈 Over 190 precise analyses, clear entry points, and defined Target Zones - that's what we do.

Retail in?After almost 3 decades as a trader, if there is one thing I have learned over the years, significant highs are made when sentiment is at extremes. Whether it is "mom and pop" or the "shoeshine guy" calling the top, it's when the buying (or selling) by retail is at a fever pitch. These days, you can't find a bear in Bitcoin, and the days on end of reports preaching "record inflows" is almost deafening.
Technically, Bitcoin is probing some key resistance today. It's stalled by the 161% Fibonacci extension of the recent early May highs to June lows. More importantly is the 127% extension of the January highs to April lows. RSI is very divergent as price hits new highs. And with sentiment at near extremes, bulls should be careful now. And a break back below the 112k level would be a very bearish "topping pattern" event.
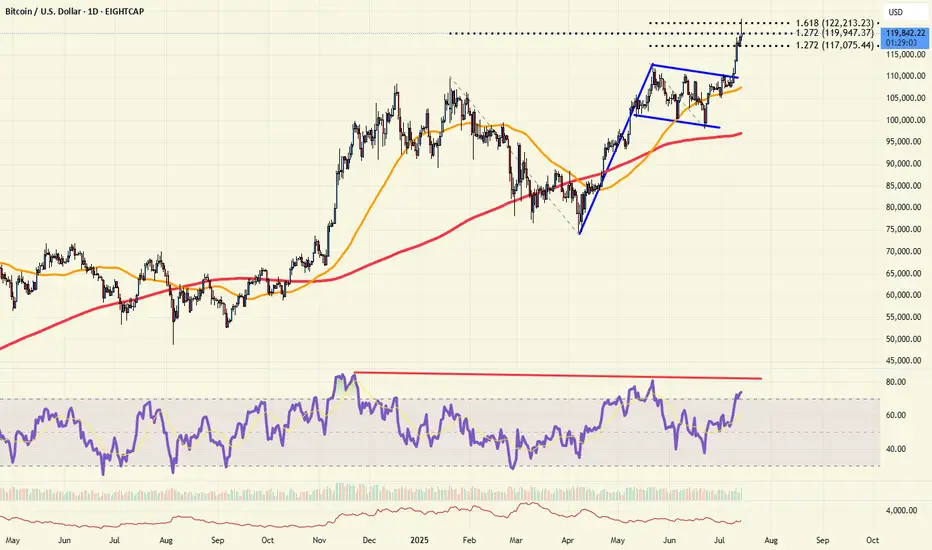
symmetrical triangle in progressBitcoin has been consolidating at this level for several weeks, easing some of the pressure in order to push above 120K. As of today, we have a clear formation—a large symmetrical triangle—which confirms the continuation of the upward trend and rules out any possibility of returning to lower levels.
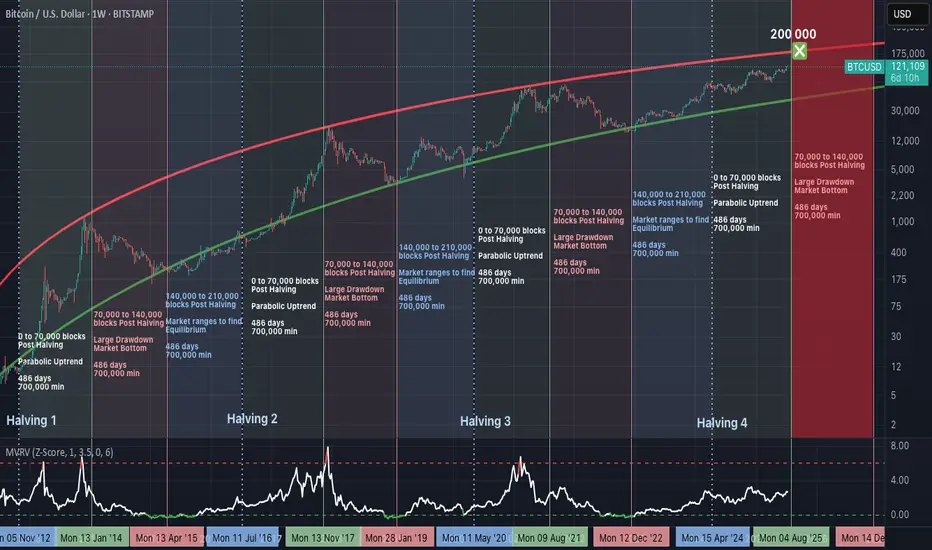
Bitcoin’s 486-Day Halving Blueprint: The $200,000 Blowoff?Summary
Bitcoin’s price consistently follows a 3-phase structure after each halving, with ~486 days per phase. If history repeats, we are nearing the end of the parabolic phase, with a potential peak around $200,000, before entering a structured drawdown.
Halving Cycles: The Real Clock Behind Bitcoin
Bitcoin’s monetary policy is pre-programmed.
A halving occurs approximately every 210,000 blocks (~4 years), and market behaviour after each halving follows this repeating pattern:
Phase 1: Parabolic Rally (0 to 70,000 blocks post-halving).
Phase 2: Major Drawdown (70,000 to 140,000 blocks).
Phase 3: Equilibrium Phase (140,000 to 210,000 blocks).
Each phase lasts approximately 486 days, and this structure has repeated reliably since 2012.
Phase 1: The Parabolic Rally (Current Phase)
We are currently in the growth segment of the cycle:
Price rising rapidly.
Miner profitability at highs.
Hashrate and network security increasing.
MVRV Z-Score steadily climbing, but not yet overextended.
Roughly 700,000 BTC are mined during this period, creating a supply shock as issuance is halved while demand accelerates.
Phase 2: The Drawdown (Expected Next)
Historically begins between block 70,000 to 140,000 post-halving.
Market peaks and begins to correct.
Miner margins compress.
Hashrate may plateau or decline.
Forced selling and miner capitulation drive volatility.
Price retraces significantly from the peak.
This phase resets the market and eliminates unsustainable excess.
Phase 3: The Equilibrium Phase
Occurs between block 140,000 to 210,000 post-halving.
Price enters consolidation.
Realized value and market price converge.
Ideal accumulation period for long-term investors.
Network fundamentals stabilize ahead of the next halving.
This phase is critical in building the base for the next cycle.
MVRV Z-Score: Market Thermometer
The chart includes the MVRV Z-Score, a key metric showing how far price deviates from realized value:
Readings above 6.0 have consistently marked cycle tops.
Readings near or below 0 have marked major bottoms.
Current value is around 2.67 — indicating a rising trend, but not overheated.
This metric reflects market-wide profitability and speculative pressure.
Why $200,000 Is in Sight
The projected resistance curve on the chart suggests that:
$200,000 aligns with the top of the long-term parabolic channel.
It corresponds with the expected end of the parabolic phase (Q1–Q2 2026).
It fits prior extension patterns following each halving.
It is a strong psychological target, likely to trigger heavy profit-taking.
This price level is not arbitrary—it is derived from the same structure that defined previous peaks.
What Comes After
If the historical cycle structure remains intact:
The peak should occur before mid-2026.
A deep correction phase follows, likely into 2027.
True bottoms tend to occur as miner capitulation concludes and difficulty adjusts downward.
This is where conviction and preparation matter most.
Final Thoughts
Bitcoin cycles are not random. They are structured around block height, issuance, and miner economics.
Every cycle since 2012 has followed this 486-day framework, divided across parabola, crash, and reset. This model has outperformed calendar-based predictions and technical narratives.
Disclaimer
This content is for educational and informational purposes only and does not constitute financial, investment, or trading advice. Past performance is not indicative of future results. Always do your own research and consult with a qualified financial advisor before making investment decisions. The author holds no responsibility for any losses incurred as a result of using the information presented herein.
Top Altcoins Choice —Your Pick · Bitcoin Hits New All-Time HighBitcoin is once again trading at a new all-time high and as this happens the altcoins go boom.
The first instance circled around the fact that Bitcoin was strong and range trading between $100,000 and $110,000. When Bitcoin goes sideways within a bull market, the altcoins tend to blow up, and blow up they need. Now, when Bitcoin moves to hit a new all-time high and keeps growing; the 2025 Cryptocurrency bull market is fully confirmed.
» Which one is your favorite altcoin trading pair?
» Which project you think will grow the most in 2025 & 2026?
» What is your TOP ALTCOIN CHOICE?
Top Altcoins Choice —Your Pick
Leave a comment with some of your favorite altcoins pairs, the ones you like most and I will do a full analysis for you. I will publish in my profile and also answer directly in the comments section. I will pick and choose.
If you see other commentators that have a pair that you like, make sure to boost their comment and reply. The more boosts a comments gets, higher priority will be given to the project and trading pair.
Boost this publication and leave a comment, let's get started with your TOP ALTCOINS CHOICE!
Namaste.
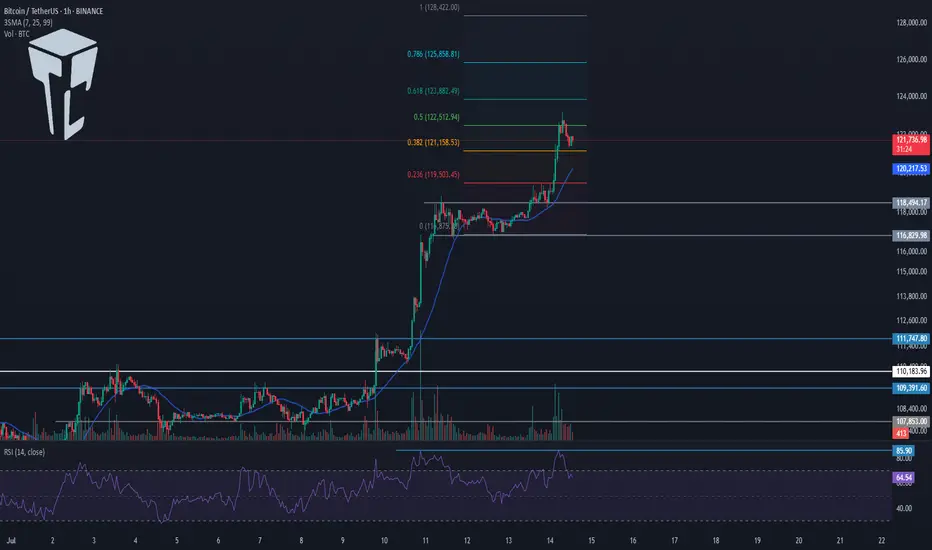
TradeCityPro | Bitcoin Daily Analysis #128👋 Welcome to TradeCity Pro!
Let’s get into the analysis of Bitcoin and key crypto indexes. As usual, I’ll be reviewing the futures triggers for the New York session.
⏳ 1-Hour timeframe
In the 1-Hour timeframe, as you can see, Bitcoin broke the 118494 top yesterday and is now moving upward.
✔️ According to the Fibonacci Extension zones, the price has moved up to the 0.5 Fibonacci level and has been rejected from there, printing a few red candles for now.
📊 The buying volume in this bullish leg was very high, and as you can see, volume was in convergence with the trend. Now that the corrective phase has started, the volume is also decreasing, and still remains in convergence with the uptrend.
🔔 From a momentum perspective, we’ve reached a market top because RSI has reached the ceiling it previously formed at the 85.90 level, reacted to it, and has now dropped back below the 70 zone.
💥 If the 85.90 zone on RSI is broken, we’ll likely see a very sharp and explosive bullish leg from Bitcoin. In that case, the next targets would be the 0.786 and 1 Fibonacci levels.
🔑 For opening a position now, we can enter on the break of 122512, and we could also use the price’s pullback to the SMA25 as an entry. For now, our triggers aren’t highly reliable, so positions should be based more on market momentum.
👑 BTC.D Analysis
Let’s move to Bitcoin Dominance. The dominance range box between the 64.44 and 64.82 is still ongoing, and dominance hasn’t broken out of this box yet.
⚡️ If the box breaks downward, a large amount of capital will flow into altcoins, and we could see major pumps in altcoins.
📅 Total2 Analysis
Moving on to Total2. Yesterday, the 1.3 top was broken and the price moved up toward 1.33 and has now reached that area.
I✨ f that resistance breaks, the next target will be 1.41. If a correction happens, 1.3 and 1.26 are the lower support zones.
📅 USDT.D Analysis
Now to Tether Dominance. A new bearish wave started yesterday and has continued down to 4.22.
🎲 If this zone breaks, the bearish leg can continue down to 4.08.
❌ Disclaimer ❌
Trading futures is highly risky and dangerous. If you're not an expert, these triggers may not be suitable for you. You should first learn risk and capital management. You can also use the educational content from this channel.
Finally, these triggers reflect my personal opinions on price action, and the market may move completely against this analysis. So, do your own research before opening any position.
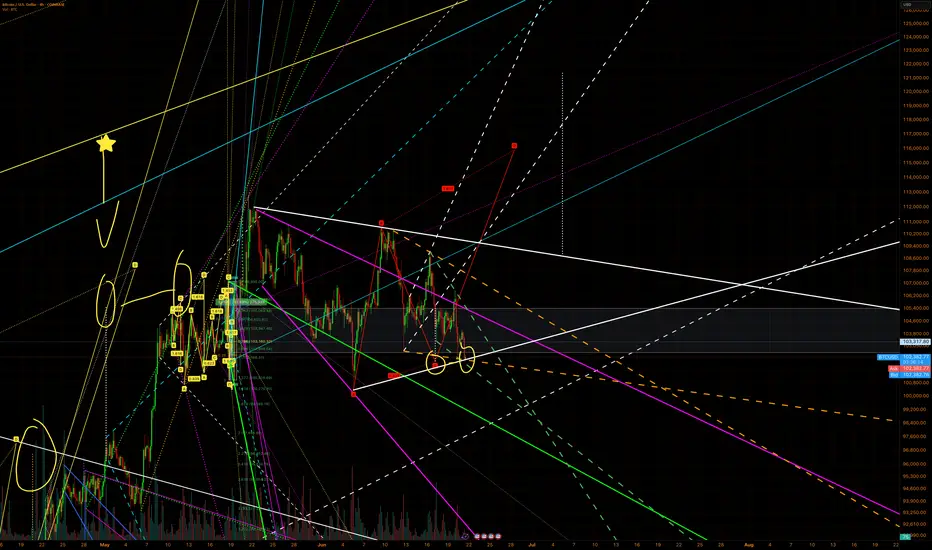
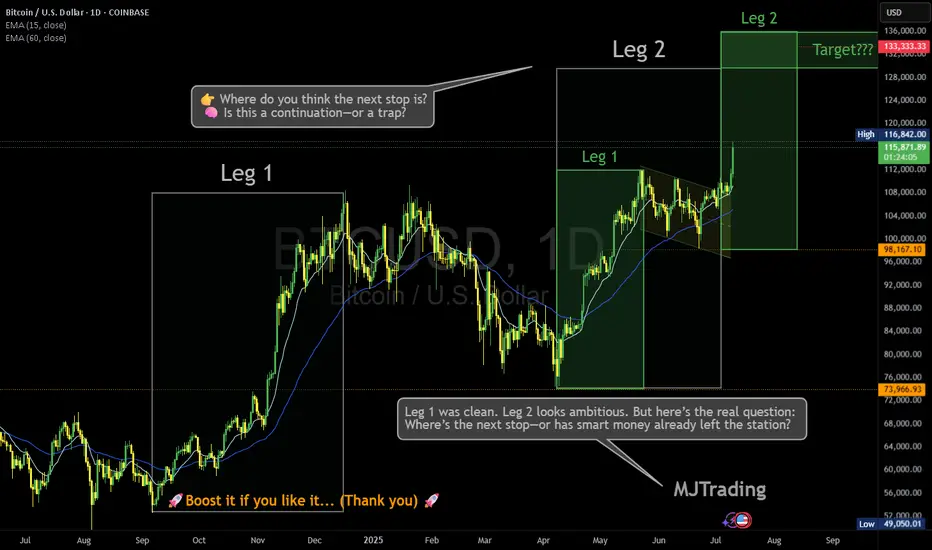
Where is the next stop? 133,333?Leg 1 was clean. Leg 2 looks ambitious. But here’s the real question: Where’s the next stop—or has smart money already left the station?
BTC just sliced through both EMAs with conviction, now hovering above $116K. Volume’s decent, sentiment’s euphoric… but is this rally genuine markup, or a cleverly disguised distribution phase?
🔍 Price targets like $133K are seductive—but what if consolidation isn’t horizontal anymore?
Vertical consolidation is real. And it’s where retail gets baited hardest.
📊 Leg 2 might still play out—but don’t ignore the possibility that this is the final markup before a liquidity sweep.
👉 Where do you think the next stop is? 🧠 Is this a continuation—or a trap?
Drop your guess...
Who has entered here:?
Who can let the winners run in this situation:
#MJTrading #ATH
#Bitcoin #BTC #CryptoTrading #SmartMoney #MarketStructure #WyckoffMethod #LiquiditySweep #DistributionPhase #TechnicalAnalysis #TradingView #CryptoChart #PriceAction #EMA #Consolidation #CryptoStrategy #TrendReversal #CryptoCommunity
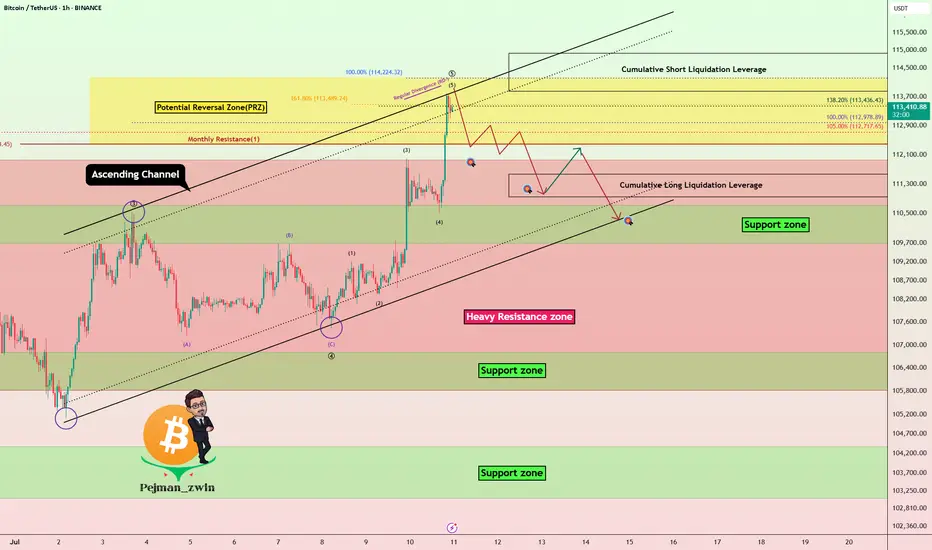
Bitcoin Hits New ATH – Is It Time to Short?Bitcoin ( BINANCE:BTCUSDT ) managed to form a new All-Time High(ATH) in the previous one-hour candles .
Do you think Bitcoin can create a new ATH in the coming hours?
Bitcoin is currently trying to break the Heavy Resistance zone($110,720-$105,820) . It has also penetrated the Potential Reversal Zone(PRZ) and Cumulative Short Liquidation Leverage($114,910-$113,850) .
In terms of Elliott wave theory , it seems that the 5 impulsive waves that Bitcoin started in the last 3 days can be completed above the ascending channel and PRZ .
Also, we can see the Regular Divergence(RD-) between Consecutive Peaks.
I expect Bitcoin to drop to at least Cumulative Long Liquidation Leverage($111,563-$110,947) . At least the price zone Bitcoin is in at the time of publishing this analysis is better for short positions , even if the Stop Loss(SL) is touched .
Note: Stop Loss(SL)= $115,023
Please respect each other's ideas and express them politely if you agree or disagree.
Bitcoin Analyze (BTCUSDT), 1-hour time frame.
Be sure to follow the updated ideas.
Do not forget to put a Stop loss for your positions (For every position you want to open).
Please follow your strategy and updates; this is just my Idea, and I will gladly see your ideas in this post.
Please do not forget the ✅' like '✅ button 🙏😊 & Share it with your friends; thanks, and Trade safe.
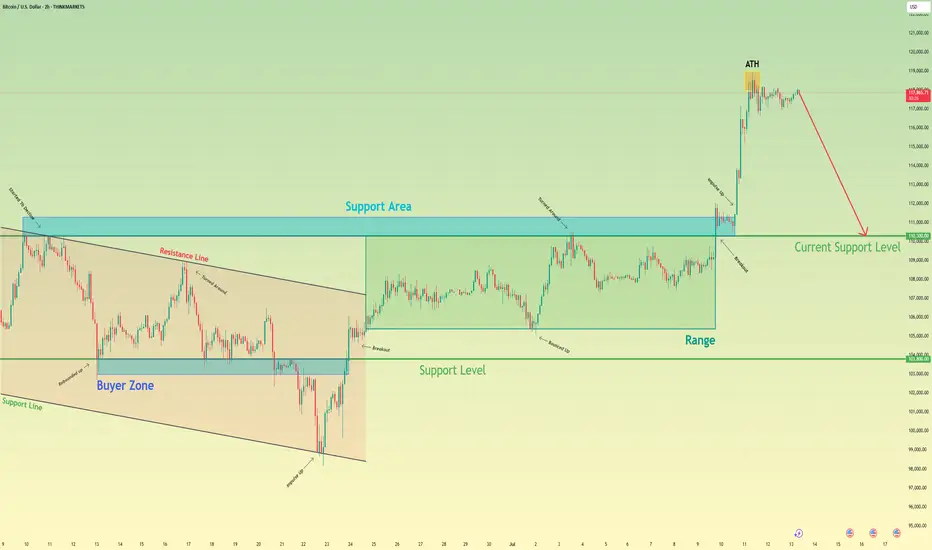
Bitcoin may make correction movement to support levelHello traders, I want share with you my opinion about Bitcoin. Price recently printed a new ATH at 118800 points and then began to show signs of correction. Before this breakout, the price was stuck in a long downward channel, where it bounced inside the buyer zone (103000–103800) several times and reversed upward. After the final breakout, BTC entered a range phase between the support level (103800) and the support area (110300–111300), building energy before the massive move. Once the price escaped this range, a strong impulse up followed, pushing BTC above all major levels and reaching a new high. However, after hitting the ATH, the price started to stall and consolidate. Currently, we can see signs of weakness at the top — the structure is forming lower highs and looks unstable, which may indicate a potential retracement. Now the price is trading above the support area, but I expect a corrective move back toward the current support level at 110300. This level aligns with the top of the previous range and now acts as strong demand. That’s why I’ve set my TP at 110300 level — right at the beginning of potential buyer interest. Please share this idea with your friends and click Boost 🚀
Disclaimer: As part of ThinkMarkets’ Influencer Program, I am sponsored to share and publish their charts in my analysis.
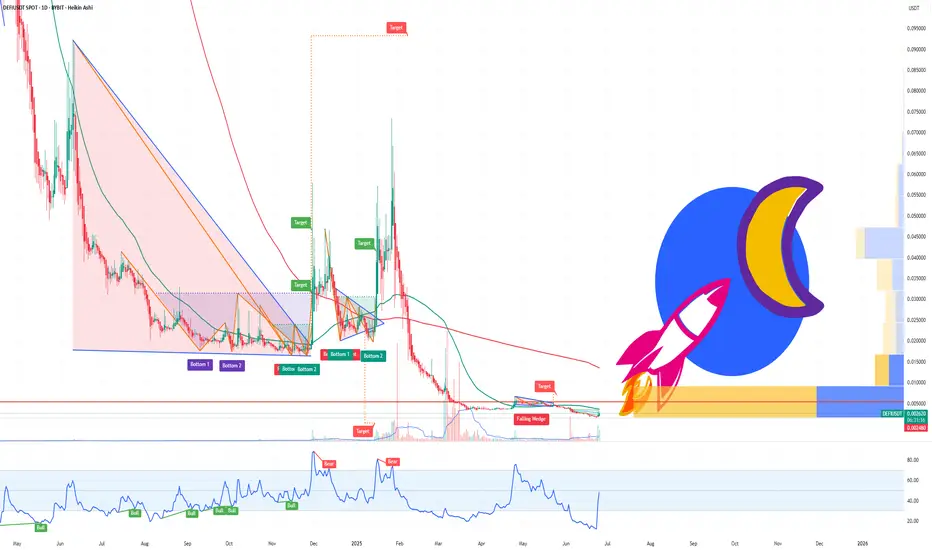
DEFI the Next Crypto Sleeper? Trump Jr. & O’Leary Back on Stage!Fundamental Bullish Case:
1. Huge Names Are Paying Attention
Earlier this year, De.Fi held a high-profile event attended by Donald Trump Jr. and Kevin O’Leary. Regardless of political views, this kind of exposure brings:
Mainstream visibility to a previously overlooked microcap.
Credibility among non-crypto retail investors.
The possibility of future partnerships or integrations with major capital players.
When figures like O’Leary (a former FTX critic turned crypto backer) show up, it means the project is on the radar.
2. De.Fi = A Web3 Security & Aggregator Suite
The DEFI token powers the De.Fi “super app”, which combines:
Smart contract security auditing (via their Scanner tool).
Cross-chain asset dashboard — track DeFi investments in one place.
Swap and bridge functionality — a unified DeFi experience.
In a post-FTX world, security + simplicity is the future of Web3 adoption — and De.Fi is positioning itself at that intersection.
3. Microcap with Moonshot Potential
Market cap under $3 million, fully diluted cap still under $30 million.
Token has already proven it can reach $1.00 — and even a partial recovery gives 100x potential from current prices.
Strong upside asymmetry compared to overbought majors.
4. 2025 = Altcoin Season Potential
As Bitcoin cools and liquidity rotates, microcaps historically outperform in the late-stage bull cycle. DEFI could ride this wave as attention flows from BTC to altcoins with good narratives and active dev teams.
Technical Analysis: Reversal in Progress?
All-Time Low was just 2 days ago ($0.0016).
Since then, price has jumped over 57%, showing early-stage accumulation and short-squeeze activity.
A move above $0.0030 could confirm a breakout from this capitulation bottom.
If momentum sustains, initial resistance targets are $0.006, $0.01, and $0.025 — still just a fraction of ATH.
Price Target Scenarios:
Target % Upside from $0.0026 Reasoning
$0.006 +130% Technical breakout level
$0.01 +280% Psychological + chart level
$0.10 +3,700% Mid-tier recovery, low float
$1.00 (ATH) +38,000% Full retrace (moonshot)
Final Thoughts:
DEFI is not a sure thing - it’s volatile, it’s tiny, and it was forgotten for months. But with renewed attention from major names, an actual working product in the DeFi space, and a chart that just bounced 50% off its lows, it may be gearing up for a new chapter.
If you're looking for an early-stage altcoin with real upside potential in this cycle, DEFI is one to watch.
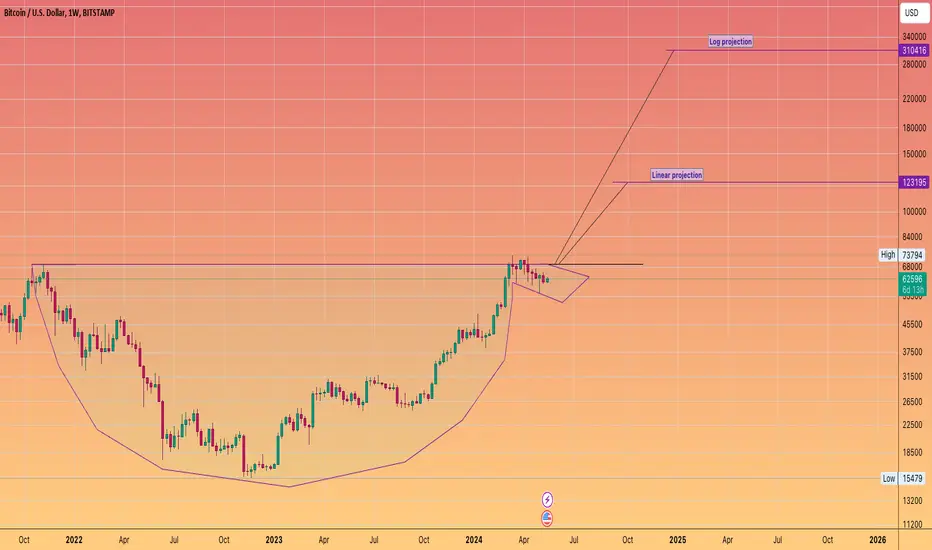
Balla is still Bullish on BITCOIN. Cup & Handle pattern. The trend is still our friend.
I still see bullish developments in the price action.
We must have patience.
Dips still must be bought.
The plan hasn't changed.
We still aiming for that time period of 9 -15 months post #BTC Halving.
We are only one month down :)
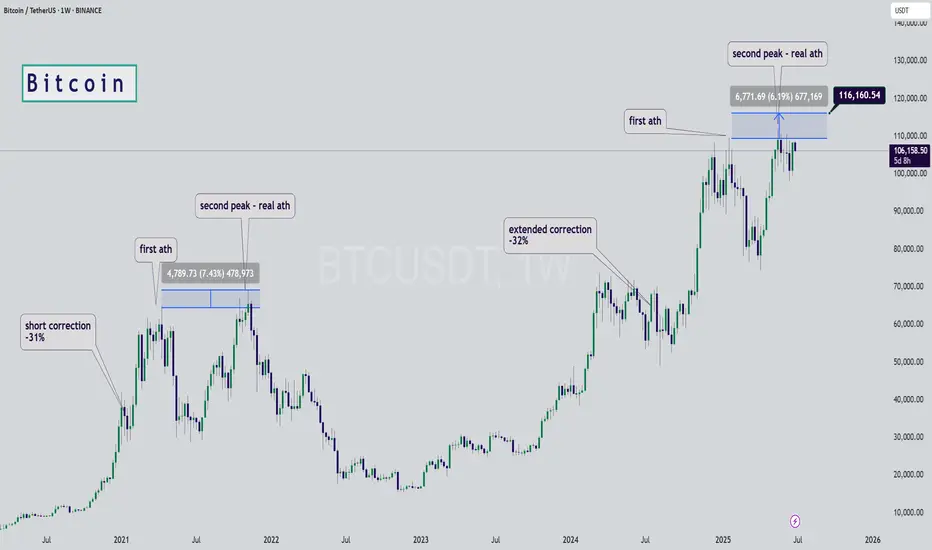
Bitcoin Fractal, increase to $116k Hi Everyone☕👋
BINANCE:BTCUSDT
Been such a long time since I posted. Today I'm looking at BTCUSDT, and I'm looking at the previous all time high cycle and what we were seeing (the pattern aka fractal).
Here's why we're likely going a little higher.
First correction of -32%
Followed by first peak, ATH
Correction, then the second peak and the REAL ath. Which is where we likely are:
Interesting to note that the previous time, the second ath was NOT THAT MUCH HIGHER. This should be considered to manage expectations in terms of how high we can go. Anything above +6% is a bonus.
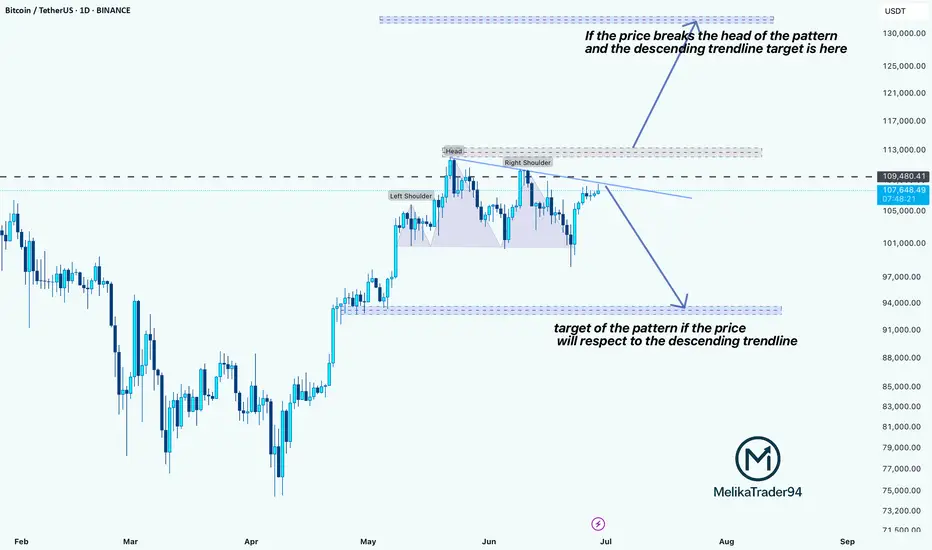
Bitcoin at a Crossroadshello guys!
In the current 1D chart of BTCUSDT, a Head & Shoulders pattern has formed, suggesting potential for significant price movement in the near term. The structure includes a defined left shoulder, head, and right shoulder, with a descending trendline acting as a critical resistance level.
🔹 Bearish Scenario:
If the price respects the descending trendline and fails to break above the neckline (around $109,480) , a bearish reversal is likely. In that case, the target based on the pattern lies near the $93,500–94,000 support zone. This level aligns with a previous consolidation area, making it a strong candidate for a reaction or bounce.
🔹 Bullish Scenario:
On the flip side, if the price breaks above the neckline and the descending trendline, invalidating the pattern, a strong bullish continuation could unfold. The potential breakout target would be around $127,000–130,000, in line with the projection from the head of the pattern.
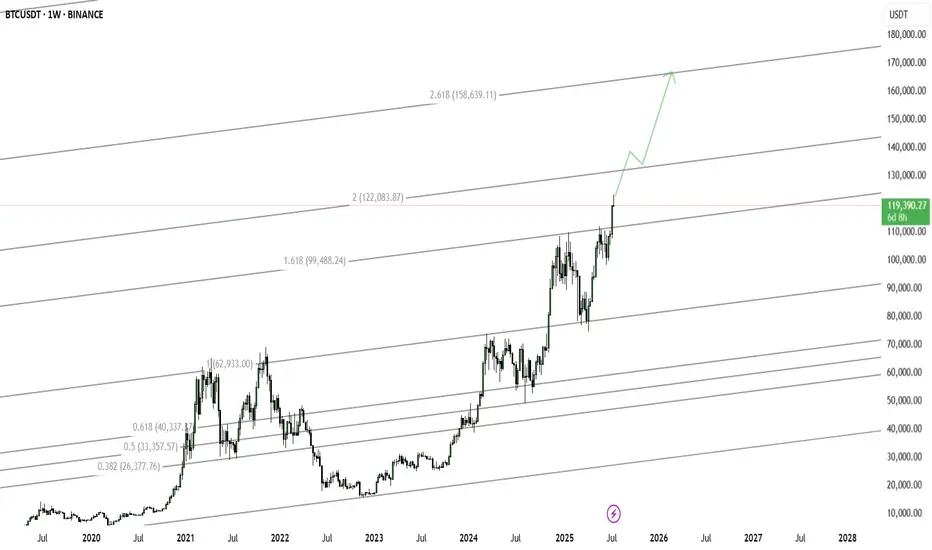
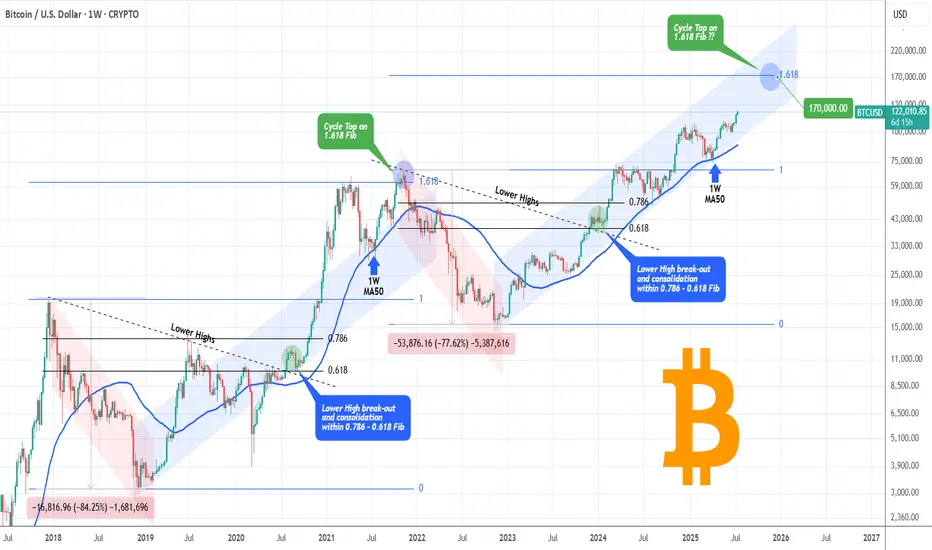
BITCOIN High after High going for the Cycle Top!Bitcoin (BTCUSD) made a new All Time High (ATH) today, just north of $123000 and shows absolutely no signs of stopping there!
The brilliantly structured 2.5-year Channel Up (blue) that has been dominating the entirety of the current Bull Cycle since the November 2022 market bottom, has been on its latest Bullish Leg since the April 07 2025 rebound on the 1W MA50 (blue trend-line).
The 1W MA50 has been the Cycle's natural Support level since the March 13 2023 bullish break-out, never broken after, just like it has been for the 2019 - 2021 Bull Cycle (excluding of course the Black Swan event of the March 2020 COVID crash).
In fact the similarities of the whole 2022 - 2025 Cycle are strong with the 2018 - 2021 Cycle. Similar Bear Cycles of -80% on average, followed by strong Lower Highs break-outs and subsequent consolidations within the 0.786 - 0.618 Fibonacci range, takes us to today with the April 2025 1W MA50 bounce resembling the July 2021 one.
Eventually, that Bullish Leg led to the Cycle's Top a little above the 1.618 Fibonacci extension. The market seems to be only one step away of completing that past pattern and if it does, BTC may hit $170000 before the Cycle peaks.
Do you think that is a likely scenario after today's new fresh ATH? Feel free to let us know in the comments section below!
-------------------------------------------------------------------------------
** Please LIKE 👍, FOLLOW ✅, SHARE 🙌 and COMMENT ✍ if you enjoy this idea! Also share your ideas and charts in the comments section below! This is best way to keep it relevant, support us, keep the content here free and allow the idea to reach as many people as possible. **
-------------------------------------------------------------------------------
💸💸💸💸💸💸
👇 👇 👇 👇 👇 👇
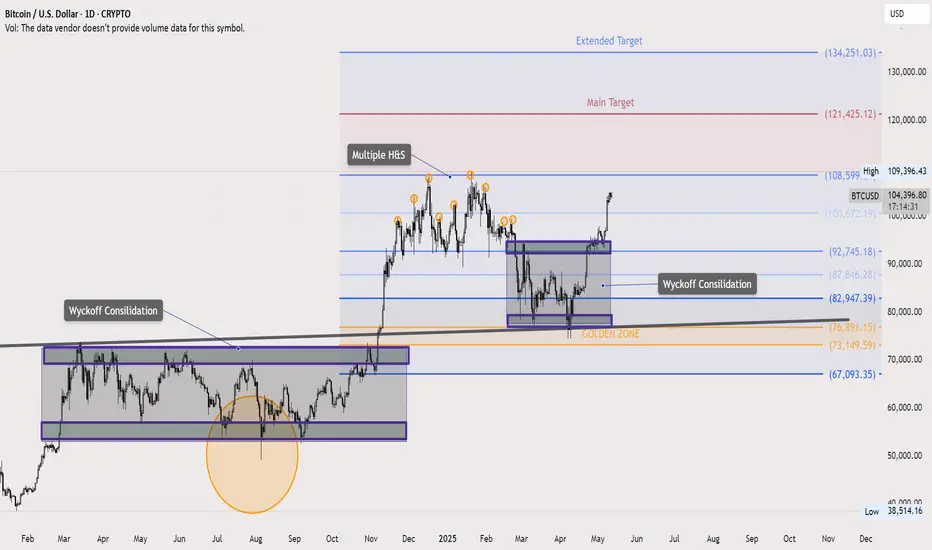
Bitcoin Update – Textbook Patterns Playing OutIn last week’s Bitcoin idea, I highlighted a key technical setup: price retested the neckline of a massive inverted Head & Shoulders pattern and launched a strong move upward. Let’s dive into what’s unfolding on the daily chart.
We’re seeing classic Wyckoff consolidation behavior—appearing right before the breakout and again after the neckline retest. Multiple smaller Head & Shoulders patterns have also formed and hit their targets cleanly.
The Volunacci pattern came alive after a precise bounce from the Golden Zone, adding more fuel to the bullish narrative.
Next major level in focus: $120K. Will Bitcoin reach it? Let the market decide.
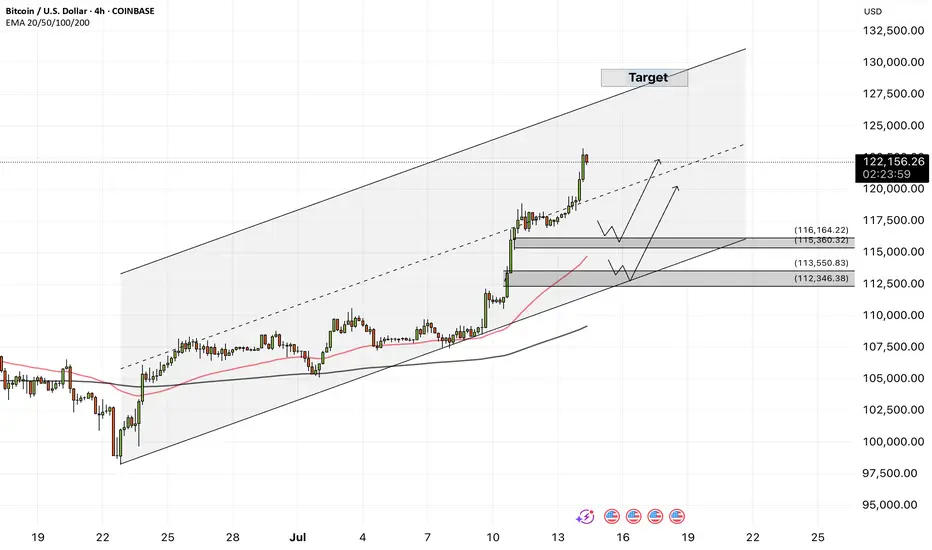
Bitcoin - Bitcoin, Unrivaled in the Market!Bitcoin is above the EMA50 and EMA200 on the four-hour timeframe and is in its ascending channel. Bitcoin’s current upward momentum has the potential to reach the target of $130,000. If it corrects, Bitcoin buying opportunities can be sought from the specified demand zones.
It should be noted that there is a possibility of heavy fluctuations and shadows due to the movement of whales in the market and compliance with capital management in the cryptocurrency market will be more important. If the downward trend continues, we can buy within the demand area.
In recent days, Bitcoin has managed to set a new historical high by crossing the $118,000 level; a jump that followed the strong accumulation of institutional capital, the upward trend of spot ETFs and the remarkable consolidation of such indices. This growth is not only the result of technical conditions or short-term market excitement, but is a clear reflection of the structural maturity of the Bitcoin ecosystem in the second half of 2025. A careful and comprehensive examination of the fundamental parameters shows that Bitcoin is moving differently than in the past: slower, but with much stronger support. On the other hand, more than $205 million in Bitcoin short selling positions have been liquidated following the jump in the price of Bitcoin and its crossing the $122,000 level.
First, the flow of investment from Bitcoin spot ETFs has broken records over the past week. In one day, more than $1.18 billion entered these funds, and the total annual inflow of these financial instruments has reached more than $51 billion. This is while ETFs such as IBIT (managed by BlackRock) and FBTC (managed by Fidelity) are attracting hundreds of Bitcoins daily, without causing any negative divergence in price indices. This phenomenon clearly shows that the participation of institutional investors through regulated channels is not only stable, but also accelerating. Along with this flow of capital, the parameters of the chain also paint a picture of a market with a balance of supply and demand. The MVRV ratio, an indicator for measuring market profitability, fluctuates between 2.2 and 2.34, meaning that the market is in a reasonably profitable state, but is still some way from the warning zone of profit saturation. Meanwhile, long-term holders (LTHs) are also continuing to accumulate. Long-term wallet holdings have reached a record high of 14.7 million BTC, representing nearly 70% of the total supply. In the last quarter alone, more than 13,000 BTC have been added to this group’s reserves.
On the other hand, the SOPR indicator, which measures realized profit ratio, shows that profit-taking is taking place at a gentle slope in the market, away from heavy selling pressure. This logical trend of profit-taking is a testament to mature investor behavior. Bitcoin flows to exchanges are also at very low levels; Bitcoin held on exchanges now account for just 1.25% of the total supply—the lowest level in over a decade. This significant reduction in potential selling pressure has kept Bitcoin’s price stable in the face of short-term volatility.
Behaviorally, the market is also showing signs of maturation. The number of daily active addresses has remained stable, but unlike during the buying frenzy, we are no longer seeing retail traders rushing into exchanges or mass wallet outflows. In other words, on-chain activity has stabilized, similar to the behavior of traditional mature markets—markets driven by data and structure, not emotion. From a macro perspective, the outlook for Bitcoin in the medium term is also positive. Many analysts and institutions, including Global X ETFs, see Bitcoin’s growth to $200,000 within the next 12 months as achievable. Technical analysis from some sources has also outlined the $140,000 range as the next price target in the next 100 days, provided that the VIX volatility index remains low and macroeconomic data maintains its current trajectory. However, a more conservative scenario sees a price consolidation in the $95,000-$100,000 range if geopolitical pressures increase or ETF inflows weaken.
Overall, Bitcoin is moving ahead in the summer of 2025 not only on the back of crypto market excitement, but also on the back of strong fundamentals and structured institutional capital inflows. Accumulation by long-term holders, a steady decline in supply on exchanges, a reasonable profit-taking balance, and a formal investment structure via ETFs have all combined to bring the market to a stable state and ready for further increases. If this trend holds, levels of $125,000-$140,000 in the short term, and a range of $180,000-$200,000 by the end of the year, are not far off!
On the other hand, BlackRock’s Bitcoin ETF (IBIT) managed to record the fastest growth in history among all ETFs, surpassing $80 billion in assets in just 374 days! For comparison, it should be noted that the S&P500 Index ETF needed about 5 times this time! BlackRock now holds about 706,000 Bitcoins (equivalent to 56% of the total ETF share).
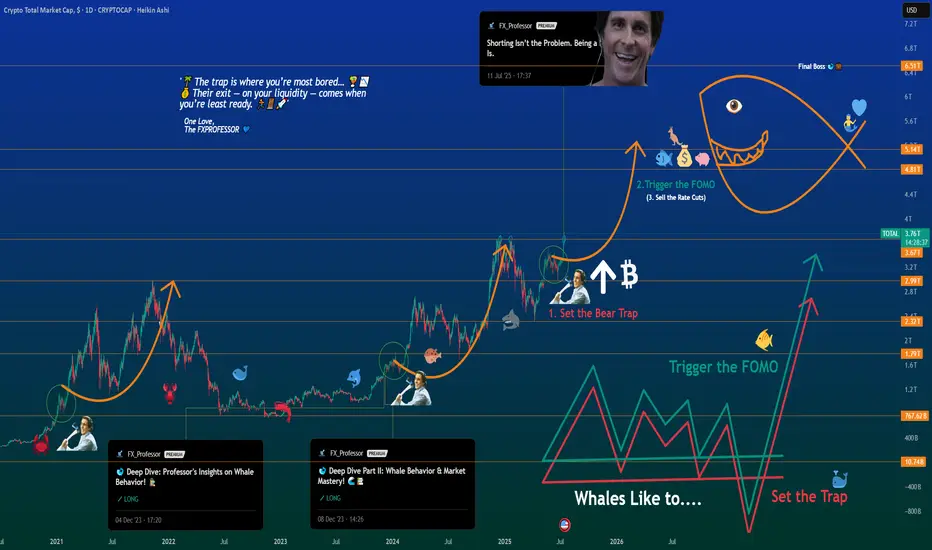
Deep Dive Part III – The Next BIG Whale Play UnfoldsDeep Dive Part III – The Next BIG Whale Play Unfolds
📍In Parts I & II of this Deep Dive, we broke down the psychology of whale behavior — from “Buy the Rumors, Sell the News” to the critical breakout zones that echoed historical patterns.
🐋 Back then, we spotted the whales' playbook early. The strategy was simple:
Buy the Rumors – Sell the News.
🧠 But now, the script has changed.
“The trap is where you’re most bored… 🌴📵
Their exit — on your liquidity — comes when you’re least ready. 💰🏄♂️💼”
Let’s break this moment down into what’s really unfolding.
We are officially entering the next stage of the cycle — not just in price, but in psychology.
This is no longer just about charts.
This is about human behavior on autopilot.
Here’s what I see happening right now — broken into three truths:
1️⃣ People Are On Holiday 🌞
From my community to the broader market, the energy is low.
People are either sunbathing on a beach or mentally checked out.
The focus is not there. The reflex to take action is dulled.
📉 The trap is where you’re most bored… 🌴📵
💰 Their exit — on your liquidity — comes when you’re least ready. 🏄♂️💼🚀
We’re seeing it unfold now:
1. Set the Bear Trap
2. Trigger the FOMO (will be down the road, yes)
3. Exit on Liquidity (the closing act of the play)
🕶️ But when everyone is away or asleep, that’s when the trap is laid.
It’s during these quiet, lazy days that the big moves get built.
2️⃣ This is a Disbelief Rally 🎢
The market trained everyone with a rhythm:
pump ➝ dump, pump ➝ dump, pump ➝ dump…
So what happens now?
People don’t trust the breakout. They’re frozen.
“We’ll dump again,” they say.
Except… what if this time, we don’t?
That disbelief becomes fuel.
It becomes hesitation — and hesitation becomes missed opportunity.
3️⃣ Bears Are Shorting Into Strength 🧨
This is key. While retail is confused, the bears are pressing in hard.
Their shorts are adding fuel to the pump they don’t see coming.
That’s why I posted recently:
“Shorting isn’t the problem. Being a psycho bear is.”
It’s not about being bullish or bearish —
It’s about timing , discipline , and narrative awareness .
Whales love this moment.
They lure in shorts, set the trap, then ignite the breakout straight into FOMO.
🧠 The Game:
Set the Trap → Trigger the FOMO → Exit on Liquidity 💥
This is what you’re seeing on the chart.
Not just price action — psychological choreography.
🕰️ In 2020–2021, we saw the exact same structure.
Part I warned about early accumulation and baiting behavior.
Part II showed how whales manipulated expectations with layered waves of doubt.
Now in Part III — the explosion few are ready for.
Zoom into the chart and it’s all there:
The curve, the trap, the trigger… and yes — the Final Boss.
🎯 The Final Boss: 6.51T
That’s the ultimate liquidity zone.
If this cycle plays out, we’re headed toward it.
“Sell the Rate Cuts” will be the new “Sell the News.”
It’s not the headlines that matter — it’s who’s left holding the bag.
🔚 Final Thought
The real exit — the one that traps most of retail — will come not when you’re euphoric,
but when you’re still saying:
“Surely we must dump now…”
So stay sharp.
Trade the chart — but don’t forget to read the behavior.
One Love,
The FXPROFESSOR 💙
Part1:
Part2:https://tradingview.sweetlogin.com/chart/idea/VgMBPsp3/
The Bear Trap:
Disclosure: I am happy to be part of the Trade Nation's Influencer program and receive a monthly fee for using their TradingView charts in my analysis. Awesome broker, where the trader really comes first! 🌟🤝📈
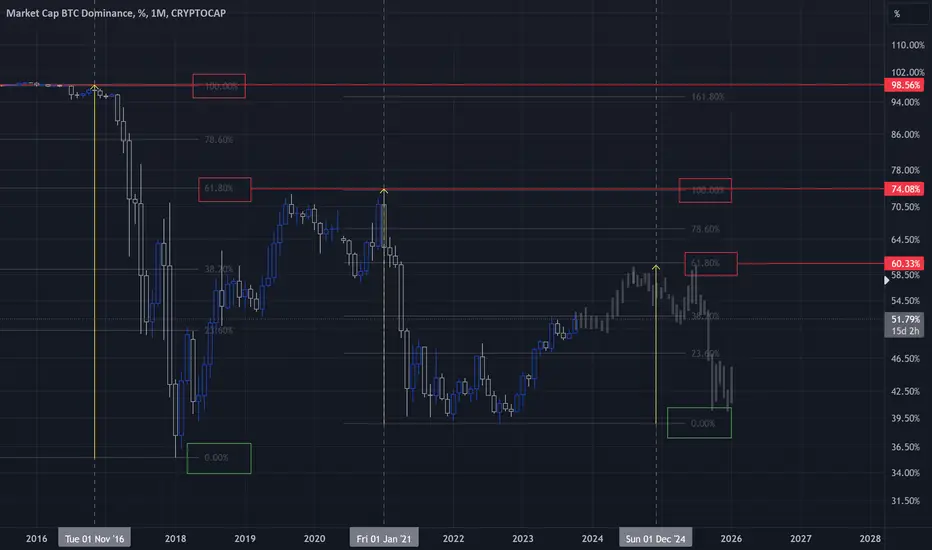
Dominance & Altcoins- This graph is purely based on fibonacci law.
- 61.8% is the core of the system ( check rectangles in graph to get it )
- Most of long term traders not even look at the price.
- they just wait the good time to buy using Fibo.
- in 2016 BTC was almost 100%. Altcoins were inexistant. (less than 2% of the market with ETH)
- in 2021 BTC Dominance pushed to 75% (altseason followed the push)
- in 2024 we could see BTC dominance knocks 60% ish ( Altseason will follow )
- BTC is maturing.
- Cryptos are growing.
- Don't look too much at your altcoin wallets.
- Most of the time the story repeats itself.
- Respect the cycle, be patient and eat noodles!
Happy Tr4Ding !
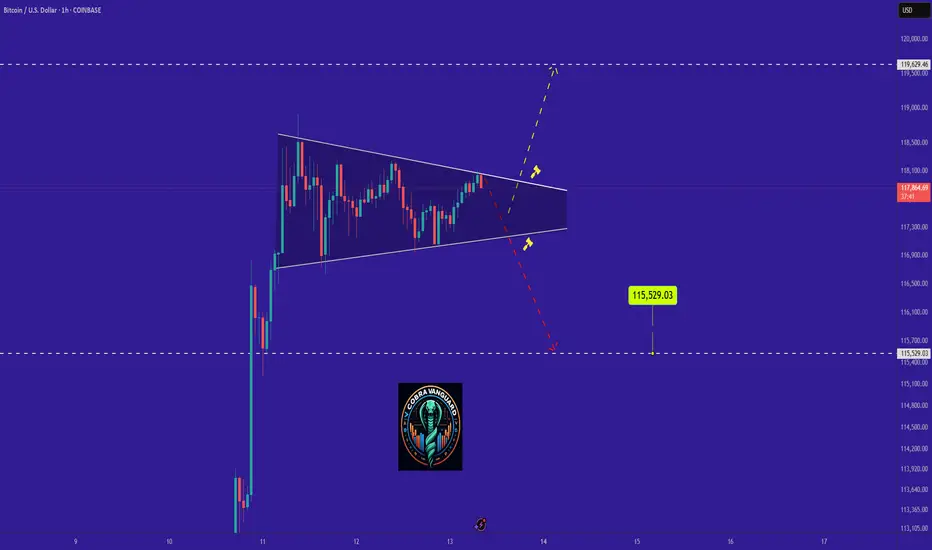
BITCOIN's Situation (1h) !!!The triangle pattern will break in the direction it is breached, and the price will move in that direction. In my opinion, the price could be corrective and may correct down to $115K.
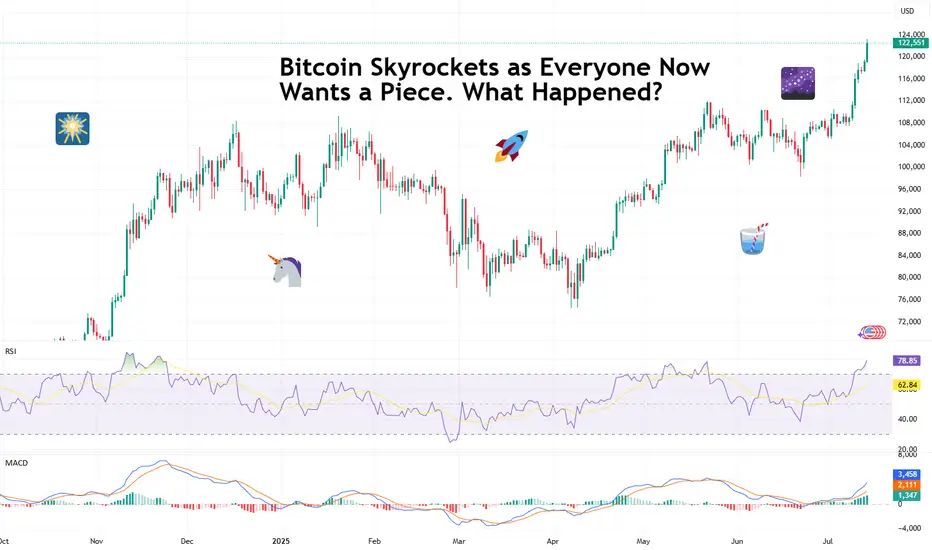
Bitcoin Skyrockets as Everyone Now Wants a Piece. What Happened?If you took a few days off last week and went to get coffee this morning, you likely missed Bitcoin torching its all-time high and soaring into the uncharted.
The world’s most popular digital asset took off in an unstoppable rocket ride, smashing records so fast that even the always-wired-in day traders couldn’t keep up.
Bitcoin BITSTAMP:BTCUSD blasted through $122,000 Monday morning after gobbling up sell walls at $120,000 and $121,000 in less than one hour. That’s not a typo.
That’s an actual snapshot of what happens when you mix onchain whale movements, fresh institutional FOMO, and traders rediscovering their appetite for risk. Billions upon billions swirled up and Bitcoin passed $2.3 trillion in market cap (ref: our Crypto Heatmap ).
🙌 Bow Down Before the King
Bitcoin has officially reminded every altcoin who wears the crown when markets go haywire. While some tiny tokens get to pump 100% on hype alone, Bitcoin does it with the weight of its market cap behind it — which now surpasses the GDP of entire countries.
Its dominance share has climbed back above 64%, a level we haven’t seen since the last time crypto Twitter argued whether “flippening” would happen by next Thursday (spoiler: it didn’t, and we mean 2021). And right now, all eyes are pinned on that round, meme-ready milestone: $125,000 or even $150,000.
Why these levels? Because traders love round numbers. They’re clean, symbolic, and if that next ceiling shatters, the chain reaction of liquidated shorts and new leveraged longs can turn an orderly bull run into pure market mayhem.
📈 Institutional Hoarding: The Secret Fuel
If you think this is just retail traders YOLO’ing in from their parents’ basement, think again. Onchain data showed earlier this month that this moon mission was being quietly underwritten by the big boys — institutional funds, overflowing Bitcoin ETFs , and corporate treasuries that once scoffed at Bitcoin as “magic internet money.”
Does this mean Bitcoin is becoming boring? Not quite. It means the foundation for this rally is sturdier than the TikTok-fueled moonshots of yesteryear. Think steady inflows, regulated vehicles, and balance sheets that no longer flinch when they see “digital assets” on a line item.
👀 So, Why Now?
Bitcoin doesn’t need much of a reason to get volatile — you know that. But a few more stars than usual aligned to give this surge its lift-off moment.
First, the macro backdrop: US inflation is at 2.4% (next ECONOMICS:USCPI report coming Wednesday, pay attention to the Economic Calendar ), which makes a Fed rate cut more likely later this year.
Lower rates mean cheaper dollars, weaker bond yields, and renewed appetite for risk assets. Oh, and don’t forget about gold OANDA:XAUUSD — the OG “no yield, no problem” hedge.
Second, corporate treasuries are all-in on Bitcoin again. If Michael Saylor’s Strategy NASDAQ:MSTR (formerly MicroStrategy — we all know what business they’re really in) keeps adding coins and onboarding new public companies like GameStop NYSE:GME , you know the institutions smell long-term value. Add Trump’s full-throated crypto endorsement and you’ve got a narrative tailwind no trader wants to miss.
🥂 Record Highs Everywhere — COINcidence?
Now let’s go back to those aligning stars. Bitcoin’s fresh all-time high didn’t happen in a vacuum. The S&P 500 SP:SPX , the Nasdaq Composite NASDAQ:IXIC , and Nvidia NASDAQ:NVDA — the world’s most expensive company — all clocked record closing highs last week.
So, is this a “rising tide lifts all boats” moment? Or are we partying on borrowed time? Equities are riding a wave of hope that the Fed will start easing soon, and any whiff of a rate cut is pure oxygen for risk assets.
But seasoned traders know that record highs can sometimes be the most dangerous places to FOMO in. Ask anyone who went all-in on dot-com stocks in 1999.
🏹 Eyes on the Big 120K — Will It Hold the Line?
Short-term, the $120,000 milestone is the line in the sand everyone’s watching. Break it decisively, see if it holds above it for a week or so, and the floodgates of speculative capital might open for another leg higher. Stall out below it? You could see a healthy round of profit-taking and some bruised egos during quiet dinners.
Macro factors will loom large: the Fed’s policy meeting, surprise tariff talks from the White House, or an unexpected bout of inflation could swing sentiment overnight. But for now, the mood is simple: bullish, frothy, and more than a little bit greedy.
💭 Final Take: From Moonshots to Maturity?
The shift from whales to suits means fewer wild swings but steadier institutional demand. The days of “Lambo tomorrow” might be giving way to “slow grind higher for the next 5 years.” For the retirement portfolio, that’s not the worst outcome.
For the traders who crave the adrenaline, there’s still plenty of room to catch the waves — just don’t expect them to come as easily or as frequently as they did in the wild west days.
📢 Your Turn: Moon or Swoon?
Over to you: is Bitcoin ready to break out above $125,000 and send shorts scrambling for cover? Or is this just another overbought stall before a healthy pullback?
Either way, grab your popcorn — and your stop-loss — because if there’s one thing crypto never does, it’s sit still for long. Drop your hot take below — and may your diamond hands be stronger than your coffee.