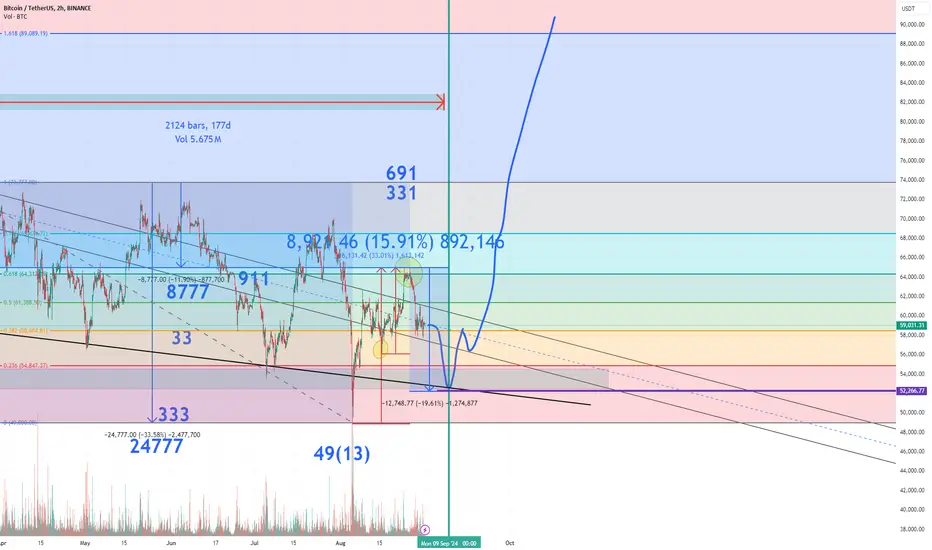
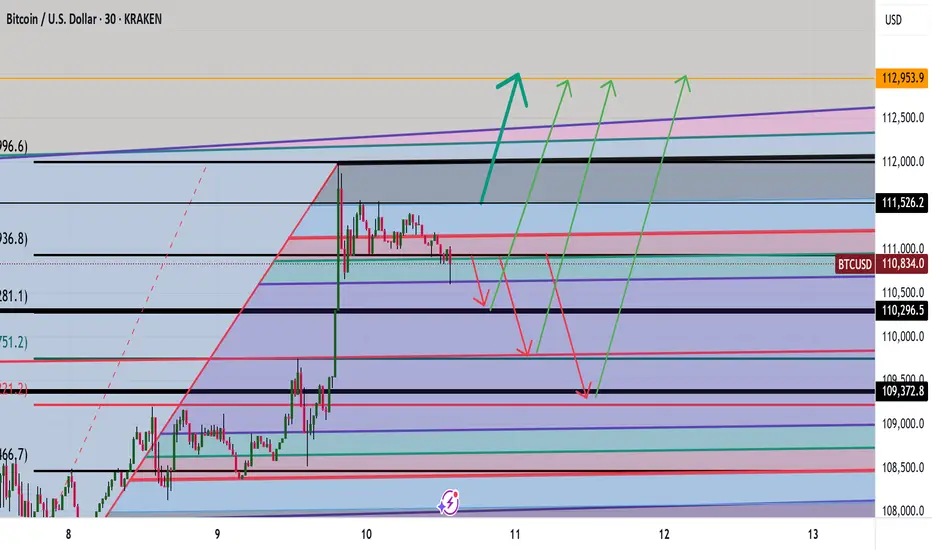
BTCUSDT - going to 113866.19$My analysis is based on numerology, all the numbers you see on the chart are from the same place. There is a certain numerological symbolism, which tells me that the price has already put the bottom 49(13) and will make a reversal from the zone 52260+- and then will fly strongly upwards with the target first 89k bucks, and after 113k. It's time to look for a good entry point.
Bitcoin (Cryptocurrency)
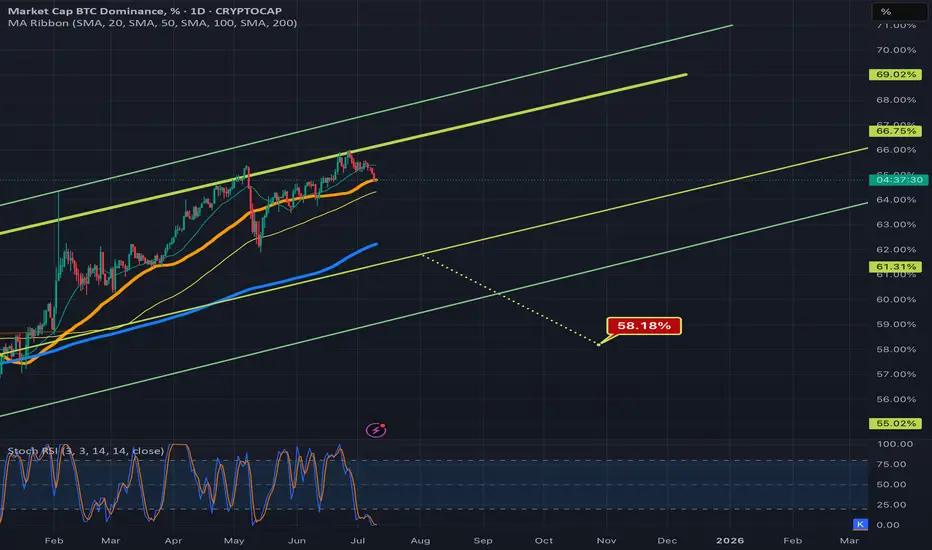
Bitcoin dominance chart ready to dump?Bitcoin dominance aka the btc.d chart has been in these 2 rising channels now for a long long tie, after ust recently being rejected down fro the top trendline of the neon yellow channel, there seems to be an opportunity here for it to potentially head down to retest the bottom trendline of that channel as well. If this occurs this could lead to an altcoin season. Price is right now combating the 50ma(in orange) and trying to maintain it as support. If this moving average flips to solidified resistance that greatly increases the chances of price going down to retest that bottom yellow trendline. Being that both of these channels are rising channels probability favors price action eventually breaking down from them instead of up so I have arbitrarily placed the measure move break down target of the yellow channel in a random spot below roughly where price could break down from the channel were it to be rejected strongly enough here by the 50ma. It’s retested this bottom trendline multiple times in the past and has always found away to avoid the breakdown thus far though so a breakdown there is definitely not guaranteed if it does retest the trendline, but even heading back down to retest the trendline in the first place may provide enough momentum for an alt season *not financial advice*
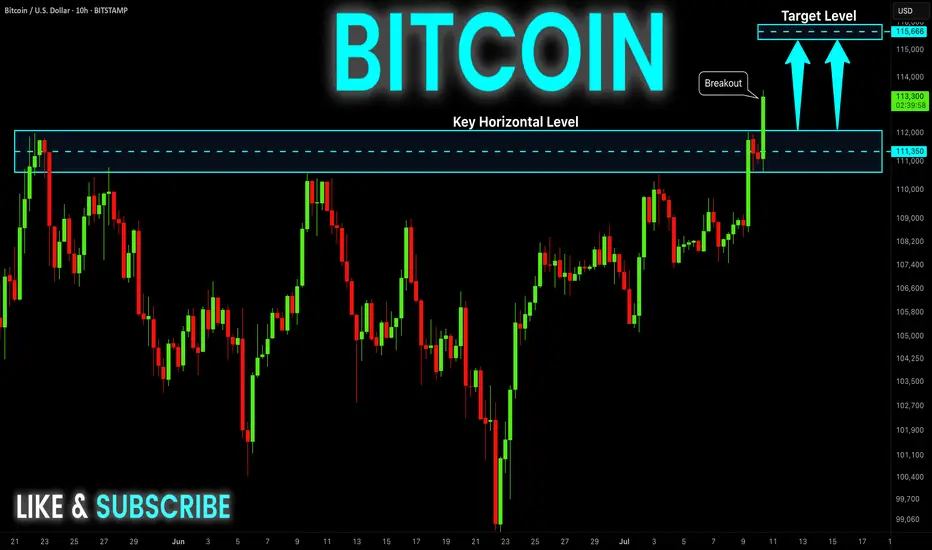
Bitcoin Breaks Out – The Final Test Has Begun 🚀🔥 Bitcoin Breaks Out – The Final Test Has Begun 💥📈
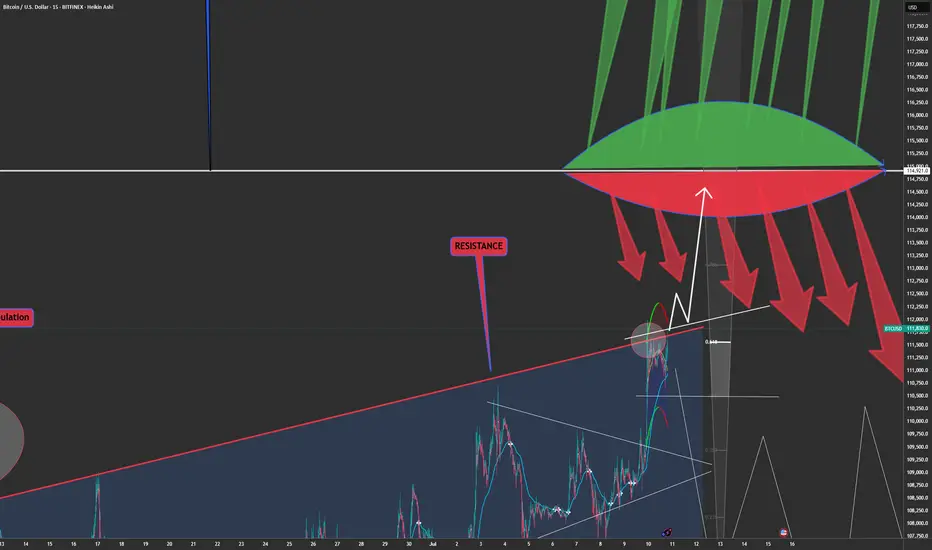
Boom! The breakout is here. After days of grinding under resistance, BTC has finally burst out of the channel — and all eyes are now on the monster level at $114,900.
📊 We spoke about this level again and again — the third macro test, the “HUGE-est Level EVER,” the battleground between Ultimate FOMO and End of Cycle.
⚠️ This breakout could lead to:
✔️ Acceleration to retest 114,900
✔️ A potential 3rd attempt to break the golden structure
✔️ Euphoria or exhaustion — no middle ground
🧠 Smart traders will remember:
– 8+ divergences still exist on higher timeframes
– The risk of failed breakout traps is high
– But this is what we’ve been waiting for: confirmation + continuation
🎯 If momentum holds, we may be on our way to test the upper macro structure. This is not the time to hesitate — it’s time to manage risk like a pro and track the flow.
💡 Catch up on the setup:
👉 Where Can Bitcoin Go? Part 8
👉 July 10th Market Outlook – Uncharted Waters
🗣️ It’s not about prediction — it’s about preparation.
We were ready. Are you?
One Love,
The FXPROFESSOR 💙
Disclosure: I am happy to be part of the Trade Nation's Influencer program and receive a monthly fee for using their TradingView charts in my analysis. Awesome broker, where the trader really comes first! 🌟🤝📈
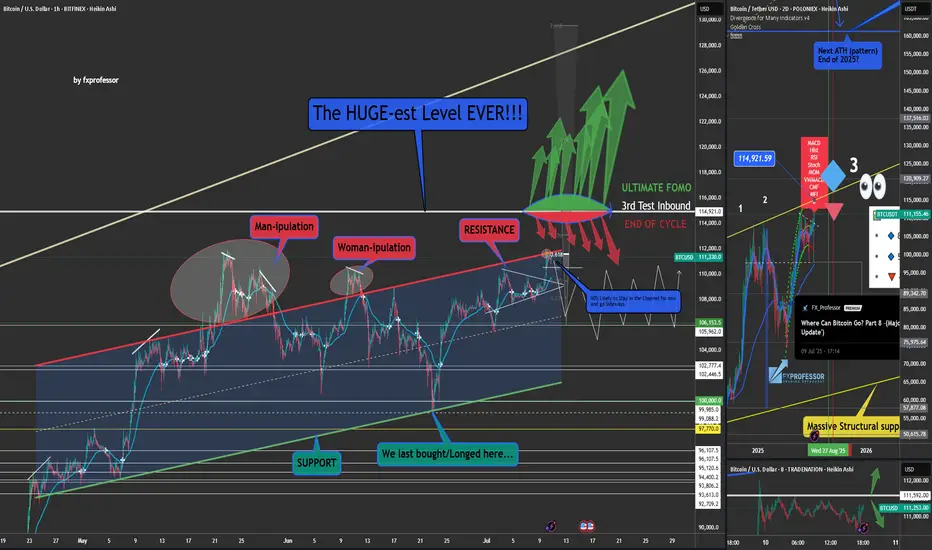
Where Can Bitcoin Go? Part 8 –(Major Chart Update')First of all guys – I made the video! 🎥🔥 Watch the full breakdown before diving into the details below.
It explains everything visually, level by level. Don't miss it.
Now let’s get into the core of the analysis...
🚀📊 Where Can Bitcoin Go? Part 8 – The Final Test is Near! 🔥🔍
Welcome to Part 8 of “Where Can Bitcoin Go?” – the update of this long-running series. Since mid-2023, not much has changed in the structure. That’s the power of solid technical analysis – levels don’t lie.
🟨 The Setup
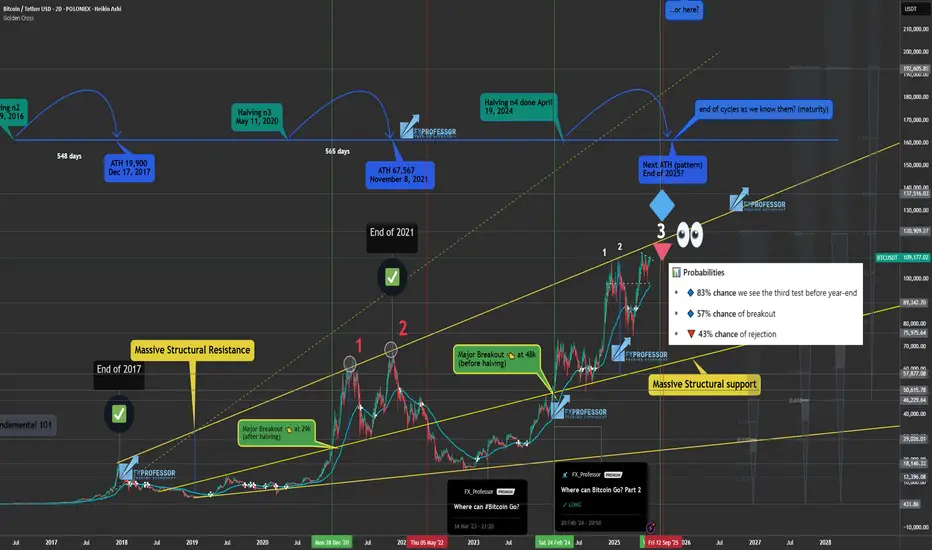
Bitcoin is now approaching a third test of a major structural resistance. If you’ve followed my 1-2-3 strategy, you know this is where decisions are made:
✅ Test 1: Rejection
✅ Test 2: Rejection
⏳ Test 3: Now pending… the TERMINAL and DECISIVE 'Breakout or Rejection', and this will change everything.
But here’s the deeper layer:
We’re not just testing one sequence. We now have two separate sets of 1-2 rejections —
🔹 One set from 2021 (the Red 1 and 2)
🔹 And a recent one in 2025 (the white 1 and 2)
This upcoming test is the third rejection attempt on both timeframes, making it a rare and extremely significant technical moment.
📐 Price is now near a critical ascending trendline around $115K–$116K, which has been the gatekeeper to parabolic moves in previous cycles.
🔄 Based on historical halving cycles:
548 days post-halving in 2016 → ATH 2017
565 days post-halving in 2020 → ATH 2021
Halving #4 was in April 2024 → 👀 Could this point to a new ATH by end of 2025?
📊 Probabilities
🔹 83% chance we see the third test before year-end
🔹 57% chance of breakout
🔻 43% chance of rejection
⚠️ And here’s the reality check:
If we see that breakout — the market unleashes itself. We’re talking major pumps, potential follow-through moves, and price discovery into untouched zones like $188K, $197K, and beyond.
But... if we get rejected, it won’t be pretty. We could retest major levels like $66K or worse, and lose momentum that took years to build.
And unfortunately — this isn’t like 18K, or 40K, or even the 79K retest.
Things are much more complicated now.
The sentiment, the structure, the risk profile — they’ve all evolved. We cannot afford to have the same blind bullishness we had in those earlier phases. This is a mature part of the cycle, and it demands discipline over emotion.
💬 What’s your take?
Will Bitcoin finally break through?
Is this just another fakeout in disguise?
Are you feeling this same tension in the market?
Let’s talk structure. Let’s talk price. Let’s talk reality.
One Love,
The FXPROFESSOR 💙
Disclosure: I am happy to be part of the Trade Nation's Influencer program and receive a monthly fee for using their TradingView charts in my analysis. Awesome broker, where the trader really comes first! 🌟🤝📈
July 10th Market Outlook –Charted Waters & Uncertain Momentum🗓️📊 July 10th Market Outlook – Charted Waters & Uncertain Momentum 🌊⚠️
Today’s breakdown is a reality check for traders navigating a market full of setups but short on clarity. Resistance is stacking across the board, but that doesn’t mean we can’t break through — it just means we need to stay sharp and keep our charts close.
🔎 Highlights from the 19-minute video:
Bitcoin is approaching a third and crucial resistance test. A breakout could trigger ultra-FOMO, but failure here could send us lower.
Ethereum is in a pressure zone — the "Symplegades" setup from Greek mythology reflects today’s narrow trading path.
Bitcoin Dominance is clinging to support — if it breaks, altseason could be on. If it holds, alts may stay sidelined.
NASDAQ & Nvidia have delivered massive runs, but signs of exhaustion and reversal risk are showing.
Dollar Index (DXY) showing a Golden Cross, but unresolved rate expectations could catch markets off guard.
💬 I also speak candidly about market manipulation, being someone else’s exit liquidity, and why we might be heading toward a formative trap before any true breakout.
🎥 Watch the full video to catch all the details — from long-term setups to real-time chart reactions.
📌 Stay tuned for detailed updates today on Bitcoin, Ethereum, Bitcoin Dominance, NASDAQ and more.
One Love,
The FXPROFESSOR 💙
Disclosure: I am happy to be part of the Trade Nation's Influencer program and receive a monthly fee for using their TradingView charts in my analysis. Awesome broker, where the trader really comes first! 🌟🤝📈

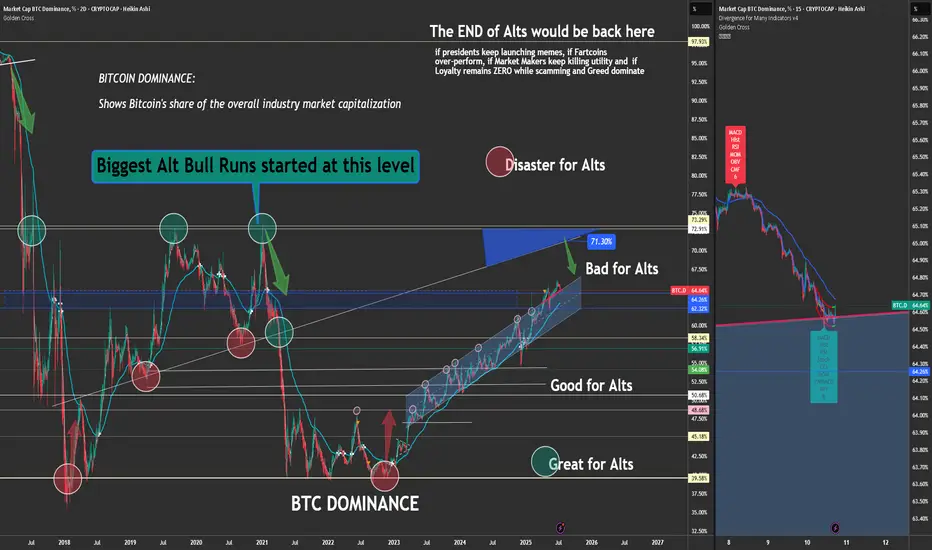
Bitcoin Dominance Rebounds – Bad News for Altcoins??📊⚠️ Bitcoin Dominance Rebounds – Bad News for Altcoins? 🧨💣
Today’s chart says it clearly: Bitcoin Dominance is bouncing off support at the edge of its ascending channel. This rebound zone around 64.58–64.64% has been critical — and the move up confirms it’s holding… for now.
❗ With Bitcoin itself facing heavy resistance, this dominance bounce is not good news for altcoins. In fact, it's a classic setup for capital rotating into BTC and out of alts — not the other way around.
📌 Chart Breakdown:
Biggest alt bull runs have started when BTC.D failed here — not when it rebounded
Breakout above 71.3% = serious risk of altcoin extinction
Breakdown below 62.3% = green light for altseason
🧠 As I’ve written on the chart: the END of alts comes not just from price — but from meme culture, utility decay, and market maker manipulation. That zone? 97% BTC.D. We’re not there, but we’re not heading toward freedom yet either.
🎥 Want to see how this fits into the full market picture? Watch the July 10th macro update:
👉 July 10th Market Outlook – Uncharted Waters, Uncertain Momentum
The market’s pressure is rising.
No good news from BTC.D today.
One Love,
The FXPROFESSOR 💙
Disclosure: I am happy to be part of the Trade Nation's Influencer program and receive a monthly fee for using their TradingView charts in my analysis. Awesome broker, where the trader really comes first! 🌟🤝📈
BITCOIN Epic Breakout! Buy!
Hello,Traders!
BITCOIN is trading in an
Uptrend and the coin made
An epic bullish breakout
Of an ATH level of 112k$
Which reinforces our bullish
Bias and we will be expecting
A further bullish move up
Buy!
Comment and subscribe to help us grow!
Check out other forecasts below too!
Disclosure: I am part of Trade Nation's Influencer program and receive a monthly fee for using their TradingView charts in my analysis.
Bitcoin Breaks All-Time High: What’s Next?Bitcoin (BTC) has once again captured the world’s attention by smashing through its previous all-time high (ATH). This milestone has sparked excitement and speculation across the crypto community and beyond. But the key question remains: Will BTC continue its upward trajectory, or is a correction on the horizon?
Long-Term Outlook: The Bullish Case
In the long run, the fundamentals for Bitcoin remain strong. Several factors support a positive outlook:
Institutional Adoption: More institutional investors are entering the market, providing greater liquidity and legitimacy.
Scarcity and Halving Cycles: Bitcoin’s fixed supply and periodic halving events historically drive long-term price appreciation.
Macro Trends: Ongoing concerns about inflation and fiat currency devaluation continue to make BTC an attractive hedge.
Given these dynamics, we believe Bitcoin’s long-term trajectory remains upward.
Short-Term Caution: A Correction May Be Coming
While the long-term view is optimistic, the short-term picture may be less rosy:
Overheated Market Indicators: Rapid price surges often lead to overbought conditions, increasing the likelihood of a pullback.
Profit-Taking: After breaking ATH, some investors may lock in gains, adding selling pressure.
Technical Resistance: Historical patterns suggest that corrections often follow major breakouts.
We anticipate a potential correction, possibly pulling BTC back to the $90,000 range. This adjustment could unfold in the coming week or weeks as the market digests recent gains.
What Should Investors Do?
Stay Calm: Volatility is part of the crypto landscape. Corrections are healthy for sustainable growth.
Focus on Fundamentals: Remember why you invested in BTC in the first place.
Consider Dollar-Cost Averaging: Spreading out purchases can help mitigate the impact of short-term swings.
Conclusion
Bitcoin’s break above its all-time high is a testament to its enduring appeal and the growing confidence of investors. While a short-term correction may be likely, the long-term case for BTC remains compelling. As always, prudent risk management and a focus on fundamentals are key to navigating the exciting—and sometimes turbulent—world of crypto.
Do not consider it as investment advice.
#crypto #bitcoin #analysis
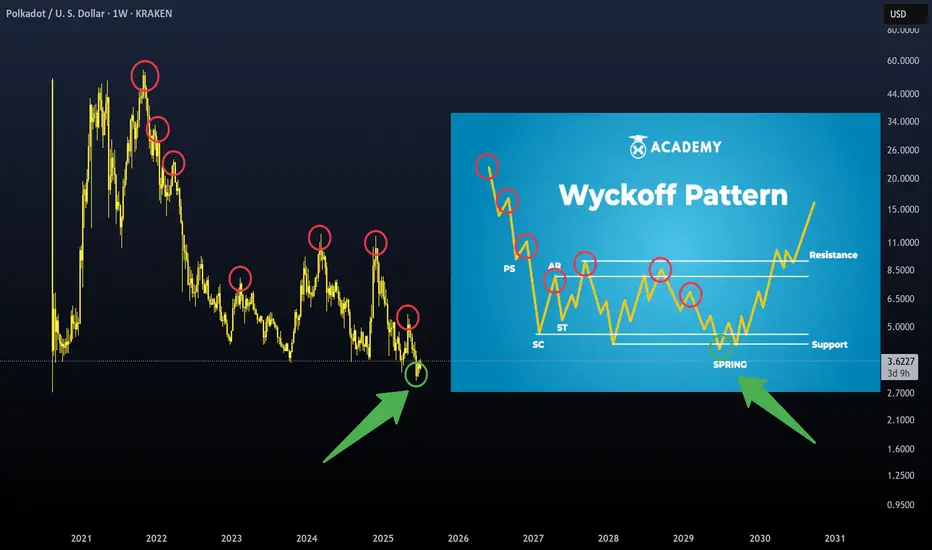
Wyckoff Pattern- To understand trading at its core, you need to understand the Wyckoff Theory.
- Everything you need is in the chart and yes, it's simple and might look like copy-paste, but it's pure Wyckoff.
- Remember this post i made in 2021 ? check it again :
Remember, trading is like a washing machine, it shakes you up, spins you around, and pressures you to sell when you should be buying or Holding.
Not a price prediction, just a smarter way to level up your strategy.
Happy Tr4Ding !
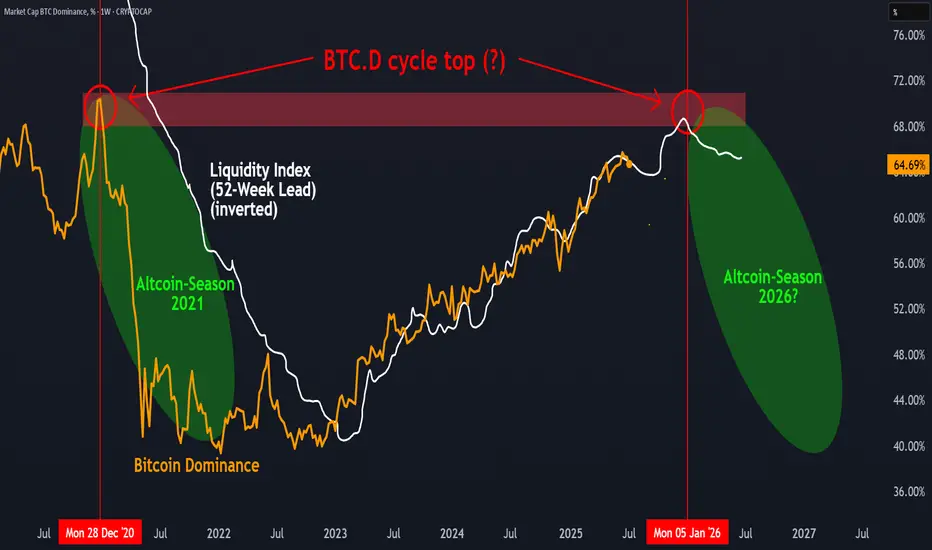
BTC.D Cycle top in?There are signs that Bitcoin Dominance (BTC.D) could be leaving a cyclical top, similar to what we saw in late 2020. When overlaid with the Global Liquidity Index (inverted and leading by 52 weeks), a potential correlation appears: previous peaks in liquidity were followed by turning points in BTC.D about a year later.
If this pattern repeats, a shift in market dynamics — possibly in favor of altcoins — could unfold over the coming year. However, this remains a hypothesis rather than a confirmed signal. The relationship between macro liquidity and crypto sector rotation is worth watching, but it’s not guaranteed to play out the same way again.
What’s your take: Altcoin Season loading or not yet?
Bitcoin Rejected at Resistance – Sideways Trap Now Likely⚠️🚫 Bitcoin Rejected at $111,592 – Smart Money Took Profits, Not FOMO 💰📉
We called it yesterday. I urgently posted about the $111,592 level — one of the most important resistance zones in this structure. And right on schedule… Bitcoin tagged it and got rejected.
📍 This isn’t just luck. It’s structure + timing + discipline.
🔄 While many were eyeing a breakout, we were preparing for the expected rejection — and we took profits after long entries from just under $100K (as shown). This wasn’t the time to FOMO. This was the time to cash in.
🔎 Key Points from Today’s Market View:
We’re still inside the ascending channel, but testing the upper end
Multiple divergences on the 2-day chart are still active (8 counted). Many more across big timeframes.
The third macro resistance test is inbound — watch the 'where can Bitcoin go post below'
Current outlook favors a sideways chop — the classic liquidation zone where longs and shorts alike get punished
We might still get the breakout to $114,900 — but if that happens, it’ll come after more pain, not from clean momentum.
🧠 Bigger Picture:
If you missed the major chart update, watch:
👉 Where Can Bitcoin Go? Part 8
And if you want today’s broader outlook (including ETH, BTC.D, NASDAQ), catch the July 10th video:
👉 July 10th Market Outlook – Uncharted Waters
🗣️ Final Word:
What we’re seeing is not a breakout. Not yet.
This is a trap zone.
Discipline > Emotion.
Structure > Hope.
Profits > FOMO.
Welcome to day trading.
💬 Peanut butter Street Talk:
Presidents are out here launching meme coins. The insiders already made their billions — and they’re calling it “peanuts.”
But we don’t want to be their peanut butter.
That’s what happens when we become the exit liquidity.
They dump while we FOMO. They wait while we panic.
So don’t feed the trap. Keep your edge sharp, your charts tighter, and your emotions in check.
I prefer to buy over 115k, over resistance or lower at support.
Not today,
The FXPROFESSOR 💙
Disclosure: I am happy to be part of the Trade Nation's Influencer program and receive a monthly fee for using their TradingView charts in my analysis. Awesome broker, where the trader really comes first! 🌟🤝📈
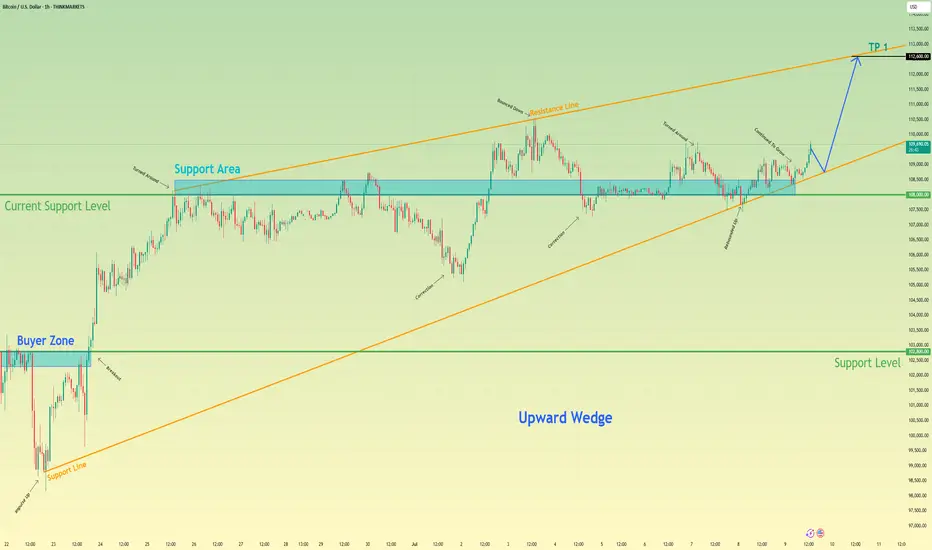
Bitcoin can rebound up from support line of upward wedgeHello traders, I want share with you my opinion about Bitcoin. In this chart, we can see how the price dropped from the 102800 support level, which coincided with the buyer zone, and later entered to wedge upward. In this pattern, price made an impulse up from the support line of the wedge pattern and broke the 102800 support level, after making a retest, and continued to move up. Bitcoin rose to the current support level, which coincided with a support area and even entered this area, but soon turned around and fell below. Next, price rose to this area again and then made a correction movement, after which it turned around and made an impulse up to the resistance line of the wedge, breaking the 108000 level. After this movement, the price bounced from this line and fell back to the current support level, where it some time traded in the support area. Later price rebounded and continued to move up. Now, I expect that BTC can correct to support line of the wedge and then rise to the resistance line of this pattern. That's why I set my TP at the 112600 points, which coincided with this line. Please share this idea with your friends and click Boost 🚀
Disclaimer: As part of ThinkMarkets’ Influencer Program, I am sponsored to share and publish their charts in my analysis.
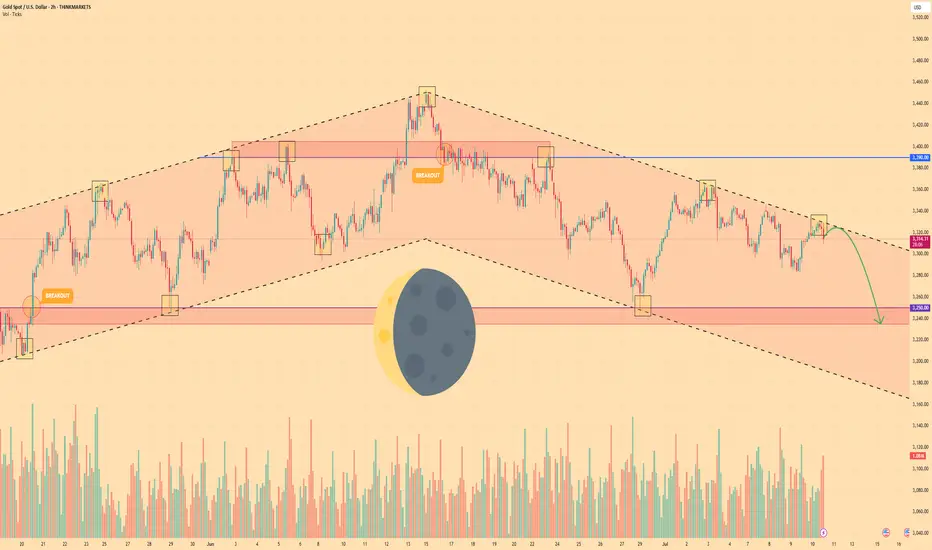
GOLD - Price can bounce down from resistance line of channelHi guys, this is my overview for XAUUSD, feel free to check it and write your feedback in comments👊
Gold broke out of its long-term rising channel and hit $3390 resistance level before momentum definitively stalled.
That failure marked a shift in control, as sellers forced price into a falling channel, establishing lower highs and lower lows.
Price fell to support level, after whcih it turned around and bounced up to resistance line of falling channel.
Now, Gold tests the upper boundary of the falling channel near $3318, where each bounce has been capped by declining volume.
Key support lies in the $3250 - $3235 area, aligned with multiple prior demand tests and the former rising-channel floor.
I expect Gold to reverse from the channel resistance and slide toward $3235, decisively breaking below the $3250 level.
If this post is useful to you, you can support me with like/boost and advice in comments❤️
Disclaimer: As part of ThinkMarkets’ Influencer Program, I am sponsored to share and publish their charts in my analysis.
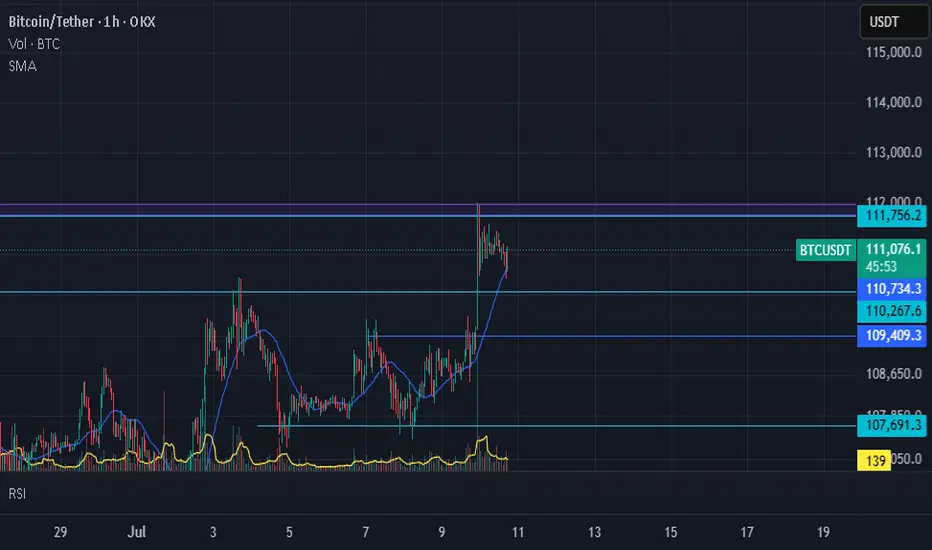
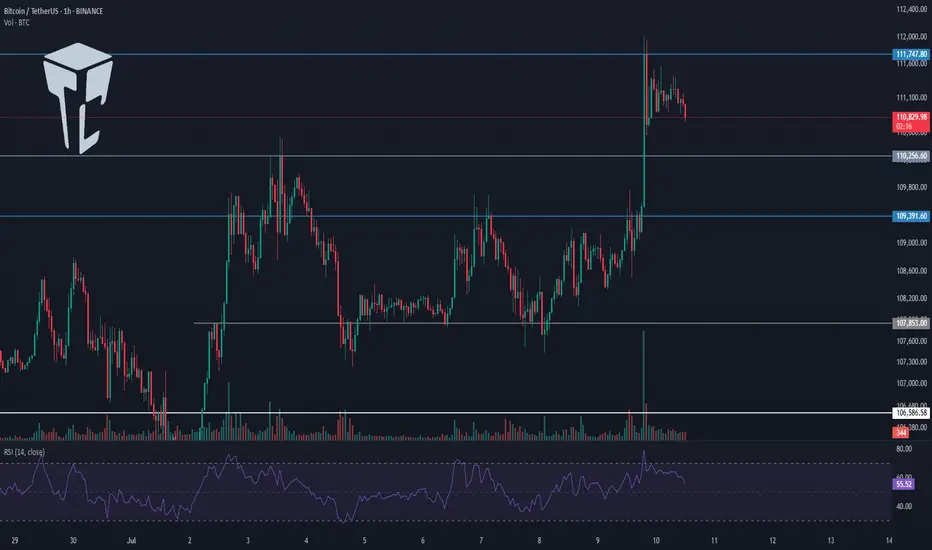
You Haven’t Missed It**⏰ Timeframe: 1H**
**🛠 Tools Used: Dow Theory, Support & Resistance, Volume, RSI**
**📈 Market Overview**
Bitcoin BINANCE:BTCUSDT is currently trading at **110,982**. After hitting a new all-time high at **12K**, the price is undergoing a mild correction. Despite the retracement, price remains supported by both volume and the 25-period moving average.
Yesterday, BTC broke through the **110,267** resistance level with a strong bullish candle, but encountered aggressive selling from market makers and is now consolidating with weak candles below the **12K** mark.
Typically, in such market phases, it’s advisable to close previous positions and consider new entries. However, given the likelihood of **interest rate cuts** and the fact that price is holding near its ATH, keeping previous **long positions** open may be wise, as a **strong upward move** is still on the table.
**⚙️ Technical Analysis**
Yesterday’s breakout above **110,267** was met with seller pressure near **12K**, leading to a shallow correction.
**BTC Dominance (BTC.D)** has broken above **65.04** and **64.69**, moving toward **64.51** resistance. However, a weakening candle structure is visible on both **4H and 1H** timeframes. This indicates that while long opportunities on bullish **BTC pairs** may still exist, we might see a lower high forming above **64.51** and below **64.69**, followed by another move back toward **64.51**.
Meanwhile, **USDT Dominance (USDT.D)** broke below the **4.75** support with a strong candle and is now ranging above **4.63**, suggesting a possible pause or rest phase here.
The **Total Market Cap** shows a similar pattern to **BTCUSDT**, reflecting consolidation with slight bullish bias.
The **Others** chart (excluding BTC & ETH) shows a healthy uptrend and is now facing resistance at **248.68**. A breakout above this level could pave the way for stronger performance among altcoins with bullish BTC pairs.
**🧭 Potential Scenarios**
📗 **Bullish Scenario:**
If BTC forms a **higher low above 110,654**, an entry could be considered above **12,000**, with a stop-loss placed below the higher low (based on the 1H timeframe). Volume confirmation is necessary to support the move.
📕 **Bearish Scenario:**
As long as the price remains **above 109,409**, **short positions are not recommended**.
**💡 Conclusion, Warnings & General Suggestion**
Bitcoin is currently in a **healthy bullish phase**.
The **key resistance at 111K** has been broken, and price is pulling back toward that level.
The structure remains bullish, supported by **sufficient volume** and **no clear bearish divergence**.
If current support holds, there’s potential for continuation toward the **113,500–114,000** range.
⚠️ **Warnings:**
* If the pullback turns into a breakdown (falling below **110,200**, then **109,000**), it would signal **buyer weakness**, and strategy must be reconsidered.
* Watch for **RSI divergences** or **declining volume** during further rallies—they may indicate caution.
* Prolonged consolidation **below broken resistance** could also indicate market weakness.
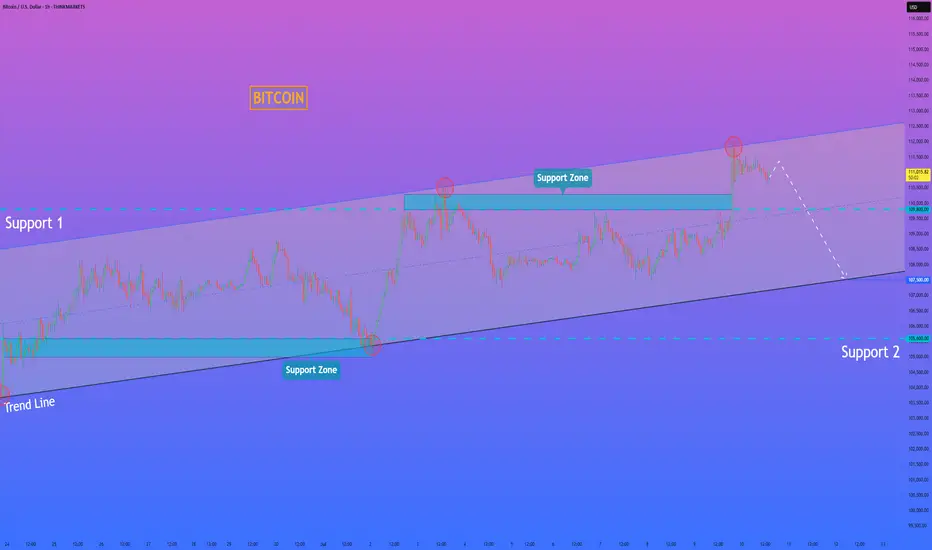
HelenP. I Bitcoin can continue to fall and break support levelHi folks today I'm prepared for you Bitcoin analytics. If we look at the chart, we can see that Bitcoin has been trading inside a well-defined upward channel. The price recently touched the upper boundary of this channel for the second time and formed a clear reaction, indicating strong resistance. After this, BTCUSD started to pull back from the resistance zone around 110300 - 109800 points. At the moment, it is trading slightly above this support area, but momentum is already shifting downward. Given this structure, I believe Bitcoin is likely to continue its decline and break below the support zone. The previous upward impulse has already lost steam, and there are no signs of strong buying activity around the current levels. The next logical target in this scenario is the lower boundary of the channel, near the 107500 level, where the trend line acts as dynamic support. This level has historically served as a rebound point, and I expect it to do so again. My current idea is short, aiming for a move down toward the trend line. If BTCUSD breaks through the first support and confirms the weakness, the price could fall quickly and test the next support area around 105600 - 105000 points. But for now, I will be watching the 107500 level closely. If you like my analytics you may support me with your like/comment ❤️
Disclaimer: As part of ThinkMarkets’ Influencer Program, I am sponsored to share and publish their charts in my analysis.
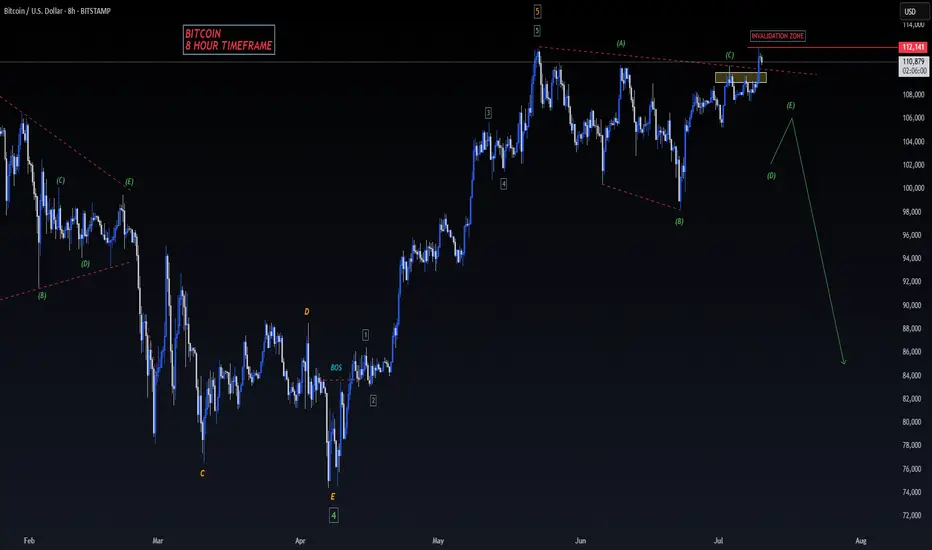
BITCOIN - SELL TO $86,000 (8H UPDATE)Bitcoin spiked up last night, but just about missed our 'Invalidation Zone' of $112,140 by a few pips. As long as this level can hold & sellers move back down, this sell analysis is still valid.
A lot of whipsaw price action in the markets right now, so use stick risk management.
BTC Analysis TO 112,981 LEVELS AND BEYOND ? Good morning folks
BTC analysis with a little correction down to 110,300- 109,300 levels then a drive up to 112-113K levels
Let me know what you think
Kris/Mindbloome Exchange
Trade Smarter Live Better
TradeCityPro | Bitcoin Daily Analysis #124👋 Welcome to TradeCity Pro!
Let’s dive into the analysis of Bitcoin and key crypto indicators. As usual, I’ll review the futures triggers for the New York session.
⏳ 1-Hour Timeframe
On the 1-hour timeframe, as you can see, Bitcoin made a bullish move yesterday after stabilizing above the 109391 level and managed to register a new ATH around the 112000 level.
⭐ The resistance at 111747 has effectively held back further price increases, and the price has reacted to it and entered a corrective phase.
✔️ I believe the correction could continue down to 110256. The next lower support levels are 109391 and 107853.
📈 If you already have a long position open, I recommend holding it. If the 111747 resistance breaks, a strong bullish trend could begin, and having an open position from earlier could have a big positive impact on your account.
🔼 If 111747 is broken, we can consider opening new long positions. If this level breaks, I’ll post a higher timeframe analysis to identify the next major resistance levels.
💥 RSI entering the Overbuy zone and rising volume would provide strong confirmation for this position.
👑 BTC.D Analysis
Bitcoin Dominance is still dropping. Yesterday, after breaking 64.81, it continued its downward move and is now approaching the 64.49 level.
🔍 If this level breaks, the drop could continue further, but in my opinion, after the recent drop, it's time for BTC.D to enter a correction phase.
📅 Total2 Analysis
Total2 has also had a bullish move, breaking through the 1.18 and 1.2 levels, and continues to rise.
🎲 The next resistance is at 1.24, which the price may target. However, I think there’s a high chance of a correction or consolidation phase starting soon.
📅 USDT.D Analysis
Looking at Tether Dominance, after the recent drop and the break of 4.72, it reached the 4.63 level and has formed a base there.
✨ If 4.63 breaks, USDT.D could head toward 4.56. In case of a pullback, the first level to watch is 4.72.
❌ Disclaimer ❌
Trading futures is highly risky and dangerous. If you're not an expert, these triggers may not be suitable for you. You should first learn risk and capital management. You can also use the educational content from this channel.
Finally, these triggers reflect my personal opinions on price action, and the market may move completely against this analysis. So, do your own research before opening any position.
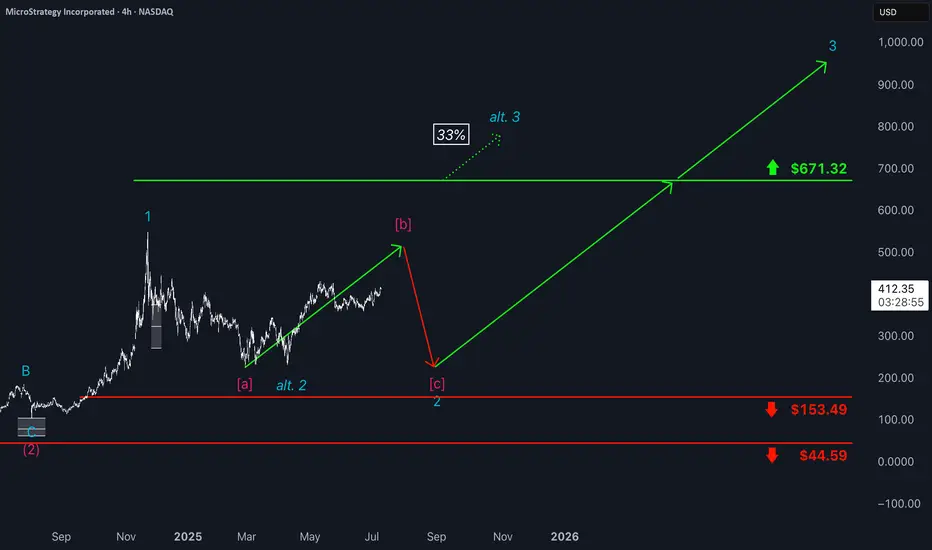
Microstrategy: Renewed Upside MicroStrategy has continued to face downward pressure recently but is now showing more decisive signs of an upward move. We still see greater upside potential in the current magenta wave , though we expect the peak to form below resistance at $671.32. Afterward, the bearish wave should complete turquoise wave 2—while still holding above support at $153.49. Wave 3 should then usher in a longer upward phase, with momentum likely to ease only well above the $671.32 level. At the same time, there remains a 33% probability that the stock has already entered this upward phase. In that scenario, turquoise wave alt. 2 would already be complete, and the price would move directly above $671.32 as part of wave alt. 3.
📈 Over 190 precise analyses, clear entry points, and defined Target Zones - that's what we do.
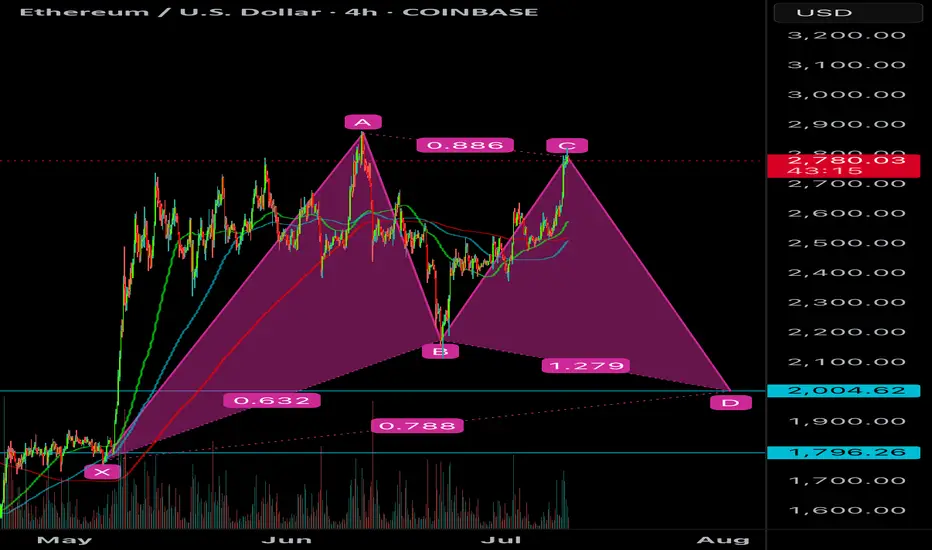
ETH POTENTIAL BULLISH GARTLEY Seeing a potential bullish gartley forming on ETH if it is unable to break above the .886 of the AB wave. Targets would be $2004 to $1786 for the .786 or 1.618 of the BC leg
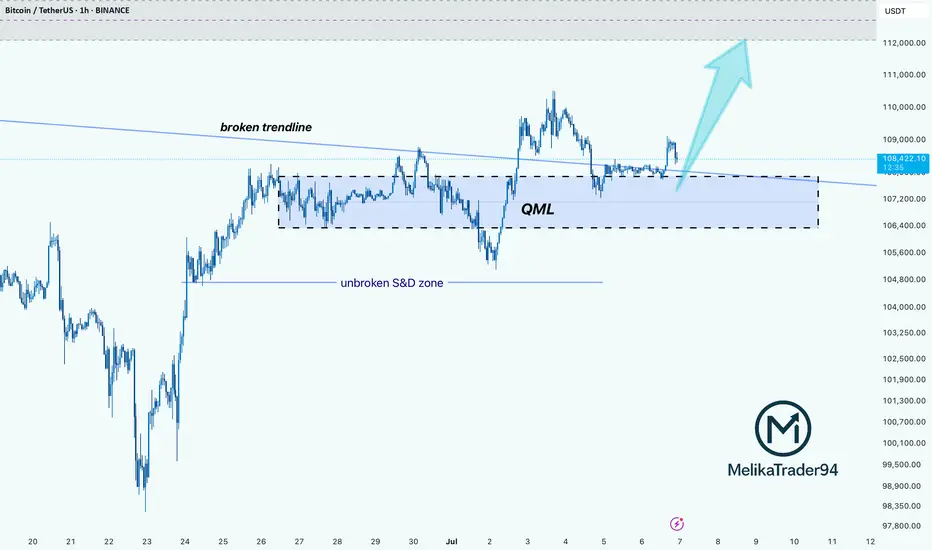
BTC: Demand Zone + QML + Trendline Flip = Perfect SETUPHello guys!
BTC is showing signs of a potential bullish reversal, forming a Quasimodo Level (QML) setup inside a valid S&D zone that remains unbroken despite multiple tests.
The downward trendline has been broken and is now acting as support, aligning perfectly with the QML and demand zone. giving us a solid confluence area.
Important to watch:
Rejection wicks and volume building at $106.6K–$107.4K zone show strong buyer interest.
If price can reclaim $109K and consolidate above, we could see a move toward $112K and higher.
Invalidation below $106.4K suggests the demand has failed, and bears may regain control.
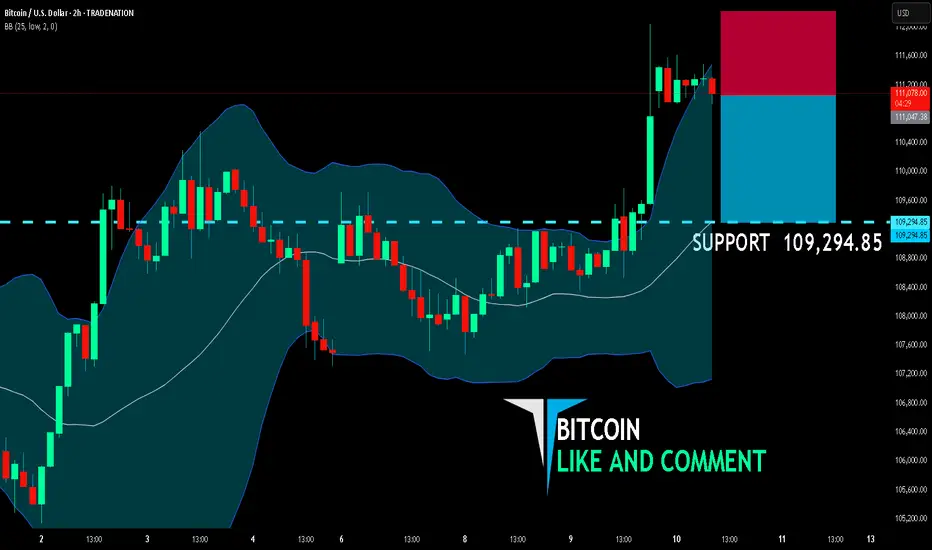
BITCOIN BEARS WILL DOMINATE THE MARKET|SHORT
BITCOIN SIGNAL
Trade Direction: short
Entry Level: 111,047.38
Target Level: 109,294.85
Stop Loss: 112,211.89
RISK PROFILE
Risk level: medium
Suggested risk: 1%
Timeframe: 2h
Disclosure: I am part of Trade Nation's Influencer program and receive a monthly fee for using their TradingView charts in my analysis.
✅LIKE AND COMMENT MY IDEAS✅
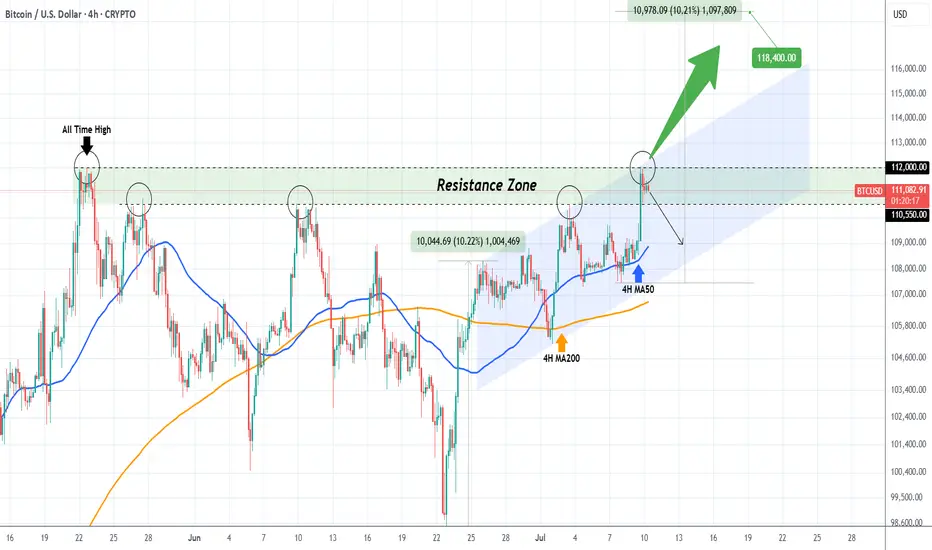
BITCOIN facing the most important Roadblock of the Cycle.Bitcoin (BTCUSD) reached $112000 yesterday, testing the May 22 2025 All Time High (ATH) and immediately got rejected. This ATH rejection is key to the continuation of the bullish trend as the entirety of the ATH Resistance Zone is perhaps the last (and most important) Roadblock before the final rally of the Cycle that could potentially price the new Top.
You can see that this Resistance Zone already had 3 rejections previous on its bottom and yesterday was the first one on its top.
A break above it can target $118400 at least within days, in anticipation of a +10.20% Bullish Leg, similar to the one following the June 22 Low.
If the rejection prevails however, we may see a pull-back that will test the bottom of the (blue) Channel Up.
Which scenario do you think will prevail? Feel free to let us know in the comments section below!
-------------------------------------------------------------------------------
** Please LIKE 👍, FOLLOW ✅, SHARE 🙌 and COMMENT ✍ if you enjoy this idea! Also share your ideas and charts in the comments section below! This is best way to keep it relevant, support us, keep the content here free and allow the idea to reach as many people as possible. **
-------------------------------------------------------------------------------
💸💸💸💸💸💸
👇 👇 👇 👇 👇 👇