Bitcoin to revisit $100k | Summer price target = $120kGeopolitical tension is causing fear in the markets. Today, Bitcoin fell from $107.7k to current price $105k with no sign of buyer support whatsoever, printing 11 consecutive H1 red candles intraday. Like a hot knife through butter.
At $105k, there is very little support. Sell volume absolutely overshadowed the tiny buy volume. Bulls have yet to close a green candle. I believe in the next few hours Bitcoin will be trading at $104k, followed by the first stop $102k.
$102k can serve as an entry point, depending on how price reacts. $100k is the optimal entry point for maximum profit, after mass liquidations. Retail traders are confident that the liquidity hunt is over after the initial tap, placing stops and liquidation levels at $100k.
Invalidation level will be beyond the 200SMA. The 200SMA have historically proven itself time and time again as a safe zone during rallies after golden crosses.
Bitcoin (Cryptocurrency)
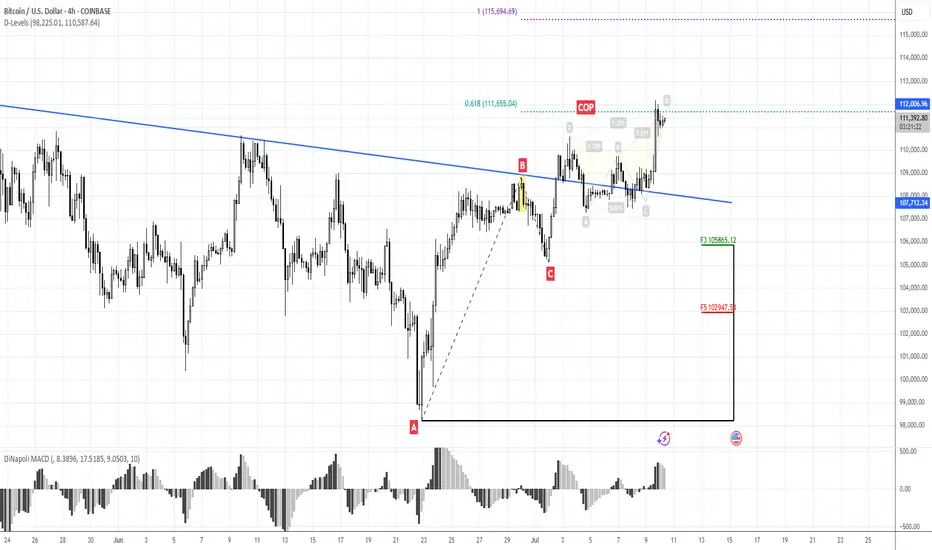
115.70K is the next one, 107K - RiskMorning folks,
Just to keep it short... our butterfly worked perfect, we've got our 111.65K target. Overall sentiment stands bullish. But - we do not want to see just stops grabbing around the top (aka Wash&Rinse). We want stable standing above broken daily trendline out of the flag consolidation .
So BTC has to stay above 107K lows to keep bullish context valid. That's why, if you plan to buy - you do not need to consider too far standing levels and lows for stop placement.
If, still, BTC drops under 107K, we suggest deeper retracement, under 100K level.
Conversely, if everything goes as we plan, next upside target is 115.70K.
So, if you plan to Buy: use local deeps on 1H chart and control 107K lows. This is your invalidation point.
If you want to sell: watch for clear signs of W&R of the top - engulfing patterns, spikes etc and following reversal patterns on 1h chart. Say, H&S, or any other.
For now I mark this setup as bullish.
$CLSK Resistance Ready to break?NASDAQ:CLSK is attempting to push above the resistance at $12.4 continuing the path from the recent analysis.
A breakthrough could push it rapidly to the High Volume Node resistance at $18.
Safe trading

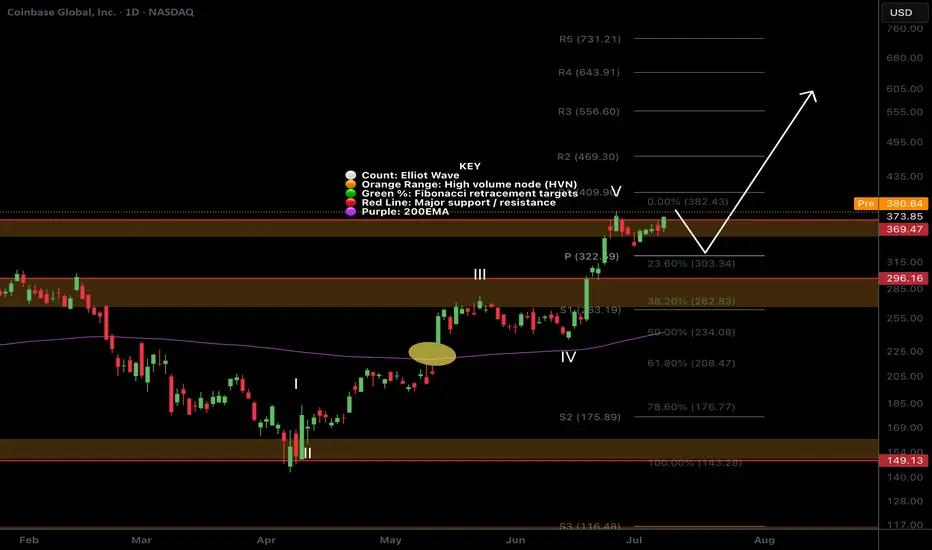
$COIN Price discovery?I was looking for a deeper pullback on NASDAQ:COIN but it appears to be heading into price discovery!
The pivot at $322 was my target but sentiment must be bullish if investors are impatient! Still... i wouldn't count out another sell off as a bear trap on a poke above the swing high.
Safe trading
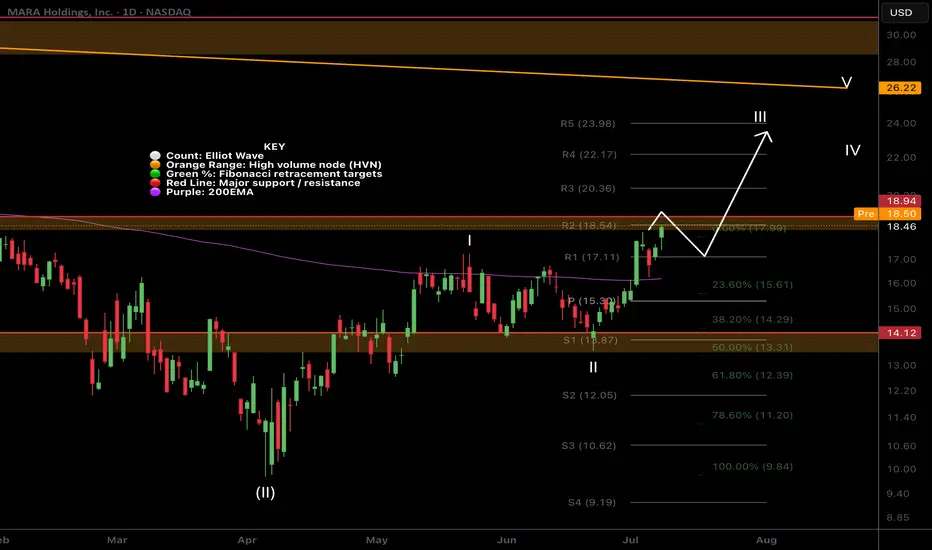
$MARA at Resistance!NASDAQ:MARA continues its rally and has come into the High Volume Node resistance target and R2 daily pivot.
Daily 200EMA was tested as support after price smashed through. I expect continuation to the upside $24 target at the R5 daily pivot after some consolidation at this resistance.
Analysis is invalidated way below wave 2 at $13
Safe trading
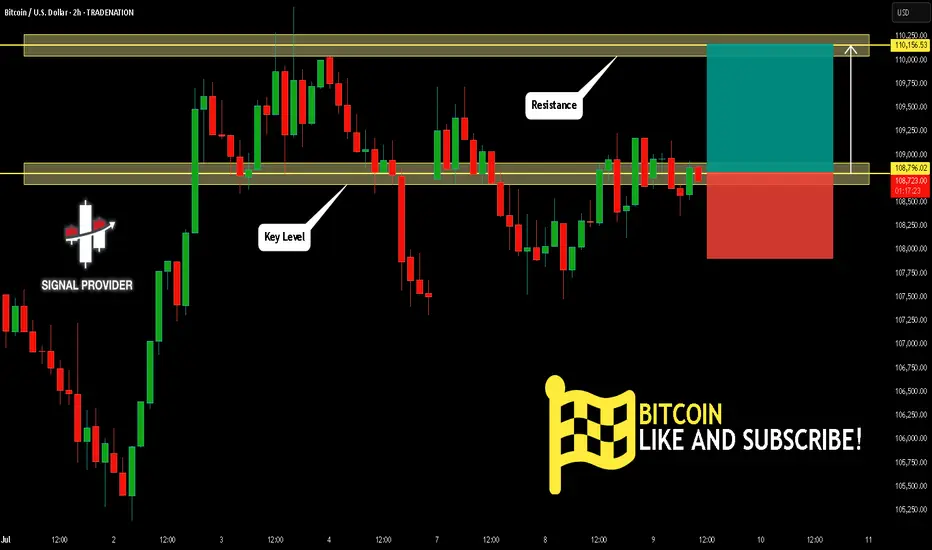
BITCOIN Will Go Up From Support! Buy!
Take a look at our analysis for BITCOIN.
Time Frame: 2h
Current Trend: Bullish
Sentiment: Oversold (based on 7-period RSI)
Forecast: Bullish
The market is testing a major horizontal structure 108,796.02.
Taking into consideration the structure & trend analysis, I believe that the market will reach 110,156.53 level soon.
P.S
Please, note that an oversold/overbought condition can last for a long time, and therefore being oversold/overbought doesn't mean a price rally will come soon, or at all.
Disclosure: I am part of Trade Nation's Influencer program and receive a monthly fee for using their TradingView charts in my analysis.
Like and subscribe and comment my ideas if you enjoy them!
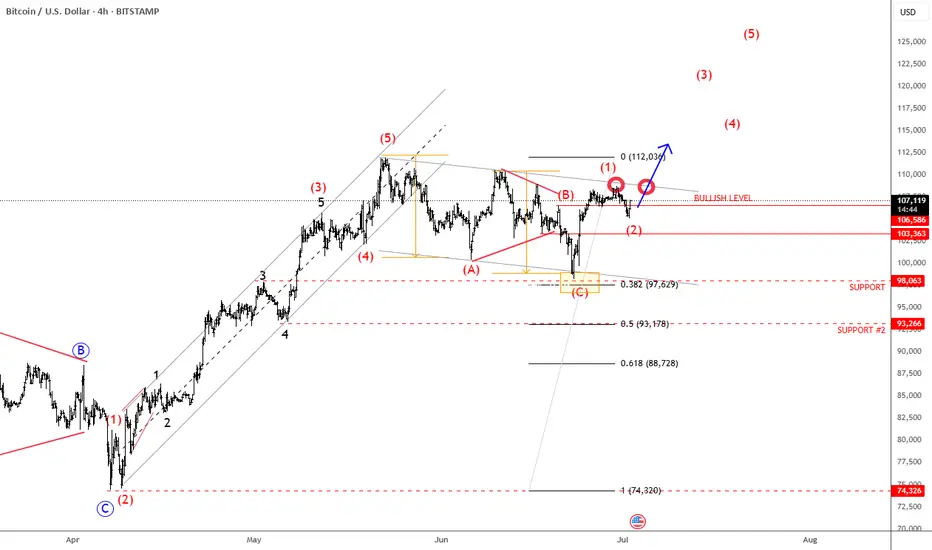
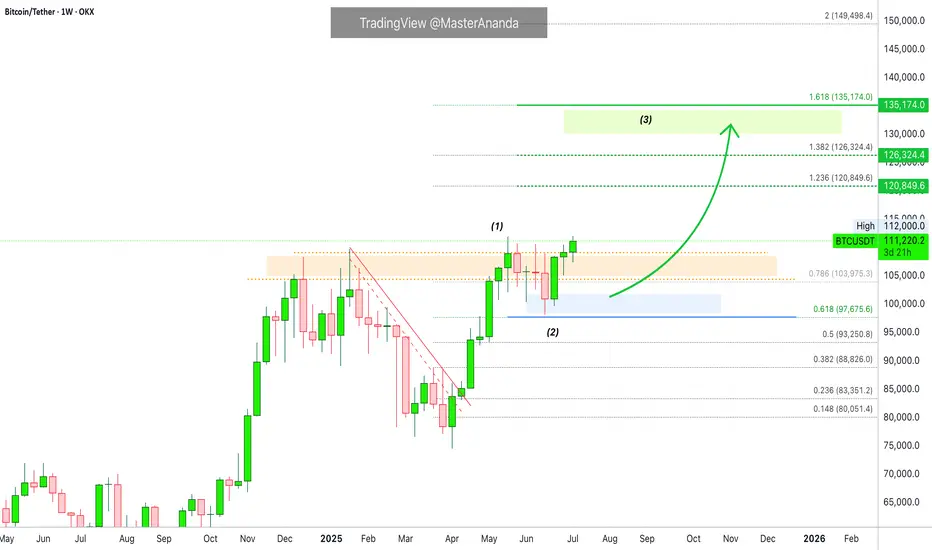
Bitcoin Is Looking For A Bullish ContinuationMorning all! Bitcoin has impulsive characteristics on 4h time frame, and we can clearly see five waves up that can send the price even higher after recent projected ABC correction. With the current impulsive recovery back above 106k area, it confirms that bulls are still here and we should be aware of further rally in July, especially if breaks above channel resistance line near 110k area. Seems like it's in wave (1) of a new five-wave bullish impulse, so after current wave (2) pullback, we can expect more gains within wave (3).
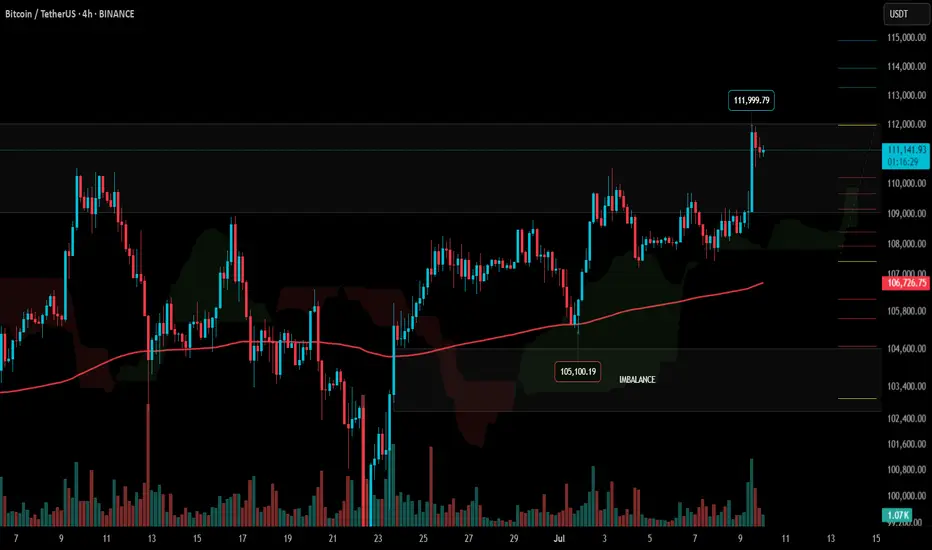
#BTC Update #5 – July 10, 2025🟠 #BTC Update #5 – July 10, 2025
Bitcoin is currently trading inside a supply zone and seems to be preparing for a corrective move after its impulsive rally — but the first clear step of that correction has yet to appear. At the same time, USDT Dominance is hovering near a support zone. If it bounces from here, Bitcoin’s pullback could accelerate.
Additionally, BTC has approached a previous resistance level, making it an uncertain area for new entries. At this stage, I don’t find it logical to open either a Long or Short position. Once the correction completes, the first major target is likely the 123,250 zone.
For now, I’m just monitoring. No trade recommendation at this time.
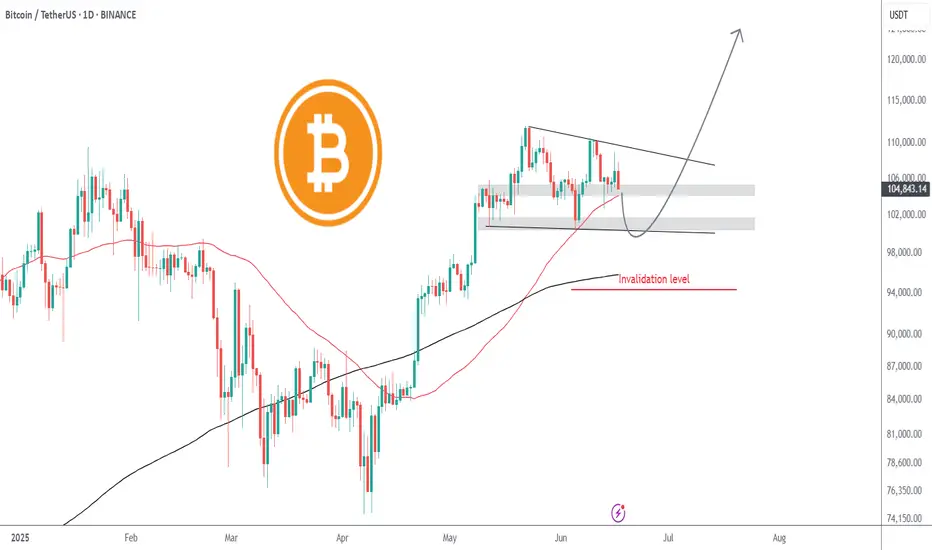
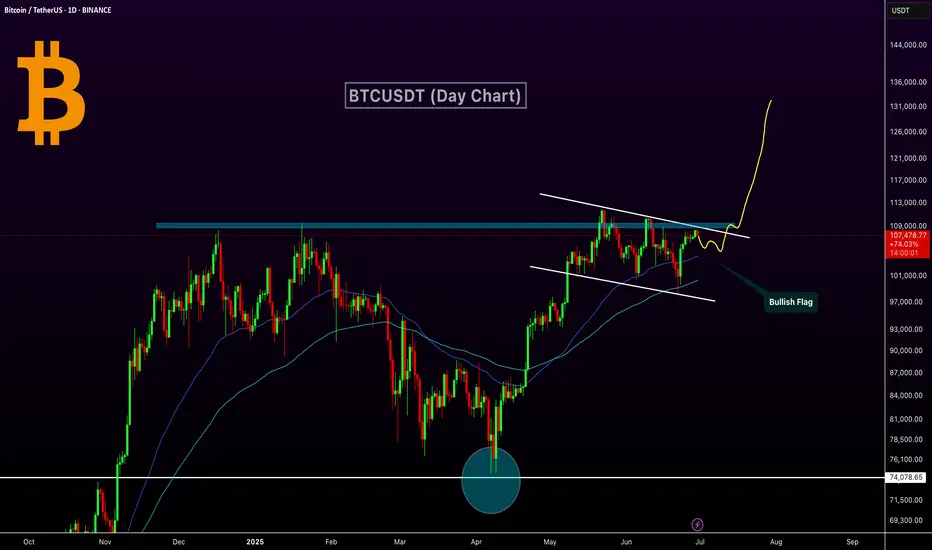
Bitcoin Bullish Flag Breakout Incoming?MARKETSCOM:BITCOIN is currently consolidating within a bullish flag pattern on the daily chart, following a strong impulse move from the $74,000 support zone marked in April. The price is hovering near a critical horizontal resistance zone ($ 108,000–$ 109,000), which has historically acted as a major barrier to further gains.
Technical Highlights:
Bullish Flag Pattern: Clear flag formation after a strong uptrend, suggesting continuation potential.
Strong Support Rebound: April's bounce from the ~$74K support zone marked a key higher low.
EMA: Price is currently trading above both the 50-day and 100-day EMAs — a bullish sign of momentum.
Breakout Potential: A confirmed breakout above the flag resistance (~$109K) could ignite a strong rally toward $130K+.
Breakout Move: If the flag pattern plays out, CRYPTOCAP:BTC could target the $125K–$135K zone in the coming weeks.
Buy Entry: Once the day candle closes above the flag resistance line
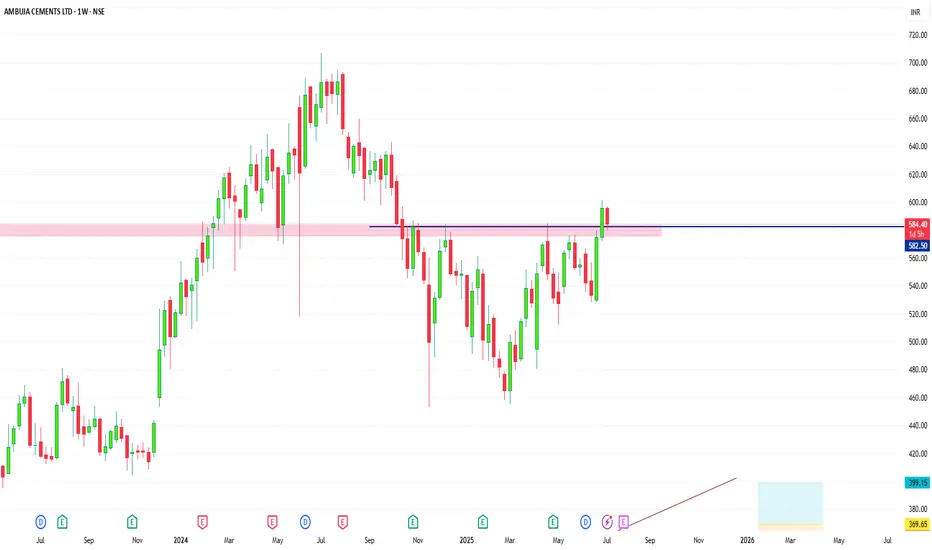
AMBUJA CEMENT FOR SWINGA Good opportunity in Ambuja Cement for swing trade, weekly resistance break and retesting, so add in your watchlist.
Bitcoin's New All-Time High = Altcoins Market Bull MarketThe shy new all-time high is in and it is good to be Bitcoin today. It is good to be Bitcoin, to be in Bitcoin and profit while trading Bitcoin but the bears got rekt and that's oookkkk. We accept their loss and it is their loss they earned it by being short when the market is good, bullish and strong. Who would short Bitcoin right before a new all-time high? I don't know.
A new all-time high was hit today, the price $112,000 but this is not the end. Not even close. This is the beginning of the next bullish wave.
I know what you are thinking, or might be thinking; Wait, but what about a drop? What about the correction? Will it go lower? Can I buy Bitcoin at 90K? I told you to buy when prices were low... "You would look like a genius for buying below 80K," 100K is already gone. No, no correction! Bitcoin is going up.
When resistance breaks it means higher. When prices move higher it means higher. When a new all-time high hits it means the bulls win. Now that the bulls won, the battle for the rise or the drop, we can expect higher prices. If you have any doubts, look at the altcoins. The altcoins market says we are entering a period of long-term growth.
Bitcoin will continue to hold strong. It will continue to rise surely, slowly, or fast, but long-term. It doesn't matter the speed; Bitcoin for the whales, altcoins for retail.
A small capital will grow faster with the altcoins because they have higher room for growth. The projects being smaller, more volatile makes for a good trading experience. Higher risk but also a higher opportunity to grow in the short- and mid-term. Bitcoin is good to retire now. Bitcoin is great to hold value, to support the market as it continues to grow.
For me and for you, welcome to the altcoins market bull market.
Thanks a lot for your continued support.
Namaste.
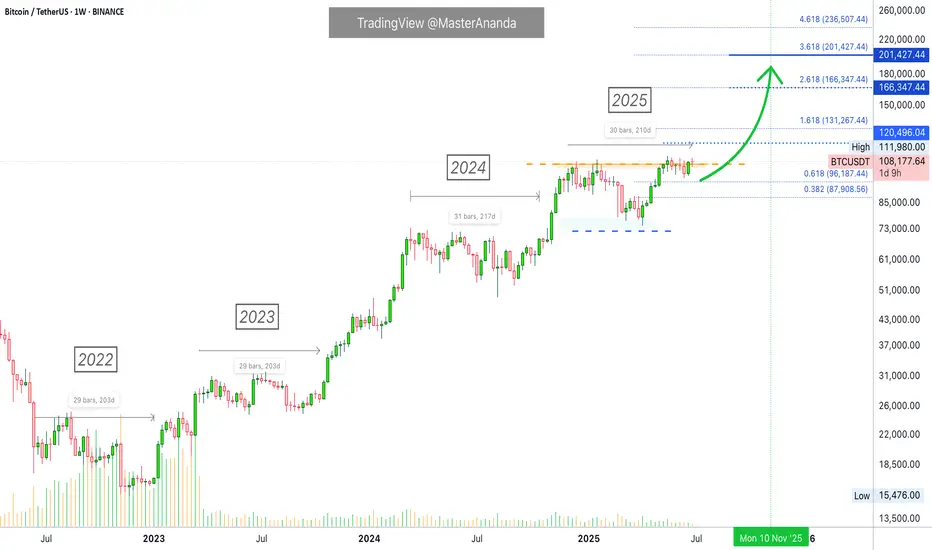
Bitcoin's Consolidation Almost Over —200-220 DaysBitcoin's consolidation period before a bullish breakout tends to last some 200-220 days on average. We have four instances of this pattern since the 2022 bear market counting 2025. Let's look at those. This proves that Bitcoin is set to grow in a matter of days. Continue reading below and make sure to boost. When you reach the end of the article leave a comment with your opinion about this issue. Do you agree? Do you disagree? Can you see what I mean?
» Back in 2022 Bitcoin consolidated for 203 days before a bullish breakout.
» Back in 2023 Bitcoin consolidated for 203 days before a bullish breakout.
» Back in 2024, last year, Bitcoin consolidated for 217 days before a bullish breakout.
It really depends on where you start counting for the total days but it all adds up to 200-220 days. With 220 being the maximum.
» Currently, in 2025, Bitcoin has been consolidating for 210 days. Looking at previous patterns, this means that only a few days are left before Bitcoin produces a bullish continuation.
We also saw that once Bitcoin breaks out of a this long-term consolidation range/period/phase, it never moves back to the lows of the consolidation range. That is, Bitcoin will never trade below 80K nor 90K once it resumes growing.
I am estimating that the next jump can start as early as next week. The entire move can take months to develop. After a peak is reached, Bitcoin will then start a new consolidation phase with a bearish bias first. This bearish bias produces a low after several months yet a strong higher low compared to the previous consolidation period which is current prices. After this low, more consolidation and then a new bullish jump.
If we take into consideration a bear market, then the dynamics can be different. Bear markets only happen once every four years. Seeing how different market conditions are now, the next bear market will be interesting because it won't be anything like the bear markets of the past. Bitcoin will remain much stronger but that is an analysis for another time.
Summary
Bitcoin is going up. It is very close now. When Bitcoin breaks up and hits a new all-time high, just to continue growing, the altcoins market will explode. You've been warned.
Now you can leave your comment.
Share your opinion on the comments section below. I know you have something to say. You've been trading Cryptocurrencies for years, buying and selling, making profits so... Are you ready for the 2025 bull market?
Thank you for reading.
Namaste.
$BTC Tapping ATH - Is this REAL!?YUUUGE Daily Close today for CRYPTOCAP:BTC
Bullish cross on the 20/50MA.
Appears to have broken out of a bull flag.
Need PA to stay within this POI in order to confirm another leg up.
₿itcoin: ATHBitcoin recently marked a new all time high. Our primary expectation is for an even bigger breakout to the upside, allowing green wave B to reach its peak within the upper blue Target Zone between $117,553 and $130,891. After this corrective high, we anticipate a sharp sell-off during green wave C, which should drive Bitcoin down into the lower blue Target Zone between $62,395 and $51,323—where we also expect the low of the larger orange wave a. This move should, for now, signal the start of another corrective rally along orange wave b, with a retest of the freshly marked all-time high well within reach. Once this countertrend move concludes, another significant decline should follow as orange wave c develops, targeting the low of the higher-level blue wave (ii). Alternatively, there remains a 30% chance that the preceding wave alt.(i) is still in progress, which could result in a direct breakout above resistance at $130,891.
📈 Over 190 precise analyses, clear entry points, and defined Target Zones - that's what we do.

BTC Live: Resistance 111592/ Breakout soon or 109440 first?In this short video breakdown, we reviewed some key structural levels. We've identified a resistance at 111.592, which is critical for near-term price action. However, zooming out to the bigger picture, the major resistance to watch sits at 114.921 — this is a level we’ve respected many times before and could act as the next big test if momentum continues upward.
On the support side, we've previously leaned on 109.079, and we're now observing strong confluence zones thanks to our Fibonacci pull — notably around 110.505, lining up with the 0.61 and 0.5 retracement levels.
What we’re seeing is an ascending channel in play. If we break and hold above 111.592, that opens the door to challenge the 114.900 level. Until then, price might need to consolidate or retest some of these key supports.
Always worth checking past ideas to see how significant some of these zones have been historically. This wasn’t a fakeout — just part of the bigger structure.
Are you watching the same levels? Let me know your setups — it's always great to see different perspectives in the community.
One Love,
The FXPROFESSOR 💙
Disclosure: I am happy to be part of the Trade Nation's Influencer program and receive a monthly fee for using their TradingView charts in my analysis. Awesome broker, where the trader really comes first! 🌟🤝📈

BTC makes new all time highs!Crypto has been soaring today.
Ethereum and BTC pumping liquidity!
Fed minutes came out today around 2pm, indicating rate cuts at next meeting and throughout the rest of the year and crypto absolutely loved that.
Crypto thrives in a cheap liquidity environment, rallying in potential rate cuts.
We took profits on IBIT calls - still holding longs in the BTC market expecting higher price.

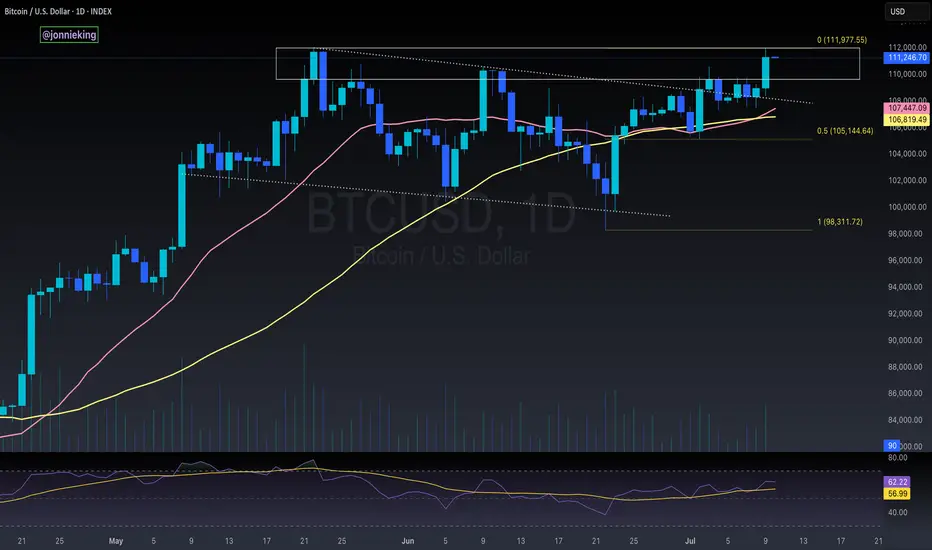
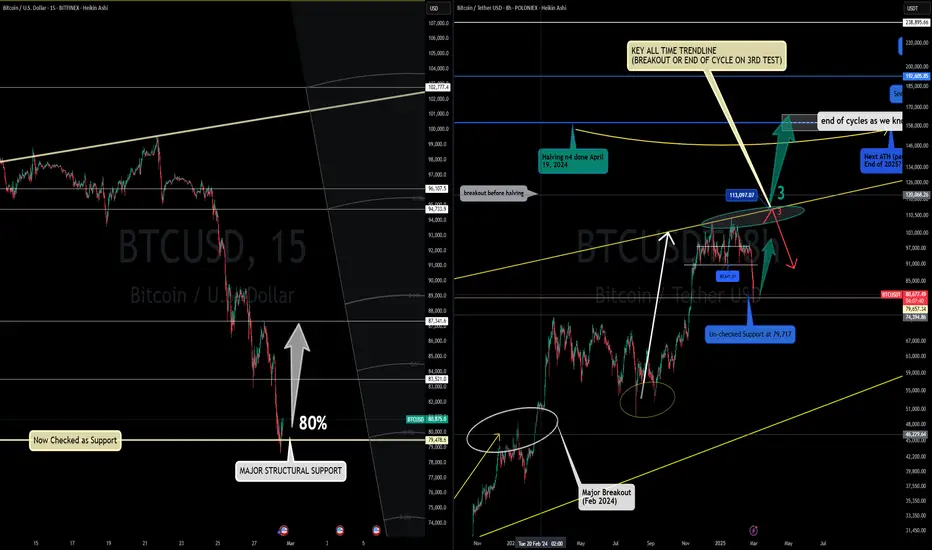
Delayed Cycle Kicks Off This March? (Chart)🚀📈 Delayed Cycle Kicks Off This March? 🔥💡
March has (almost) arrived, and Bitcoin has officially confirmed $79,478 as major structural support—a critical level that had to be checked before the next move. This aligns perfectly with my previous idea of a delayed cycle playing out.
📌 Long above 79K
📌 Short below 79K
📌 Short-term target: GETTEX:87K+
With this structural support holding, I expect Bitcoin to push toward the next major test: $113,800. This is the all-time trendline, a level of historical significance.
🔑 What happens at 113K?
This is where Bitcoin’s fate for this cycle will be decided:
✅ A breakout above 113K could unlock a run to 150K - 200K, a true extension of this cycle.
❌ A terminal rejection at 113K could mark the end of this cycle, signaling a broader correction phase.
At the moment, the probabilities lean toward further upside, with an 80% chance of continuation. The 20% downside risk remains for a dip to FWB:65K-66K, but as long as Bitcoin stays above 79K, the bullish thesis remains intact.
💡 March looks strong, and I’m stepping on the gas today.
Let’s make it a powerful month! 🚀
One Love,
The FXPROFESSOR 💙
video:
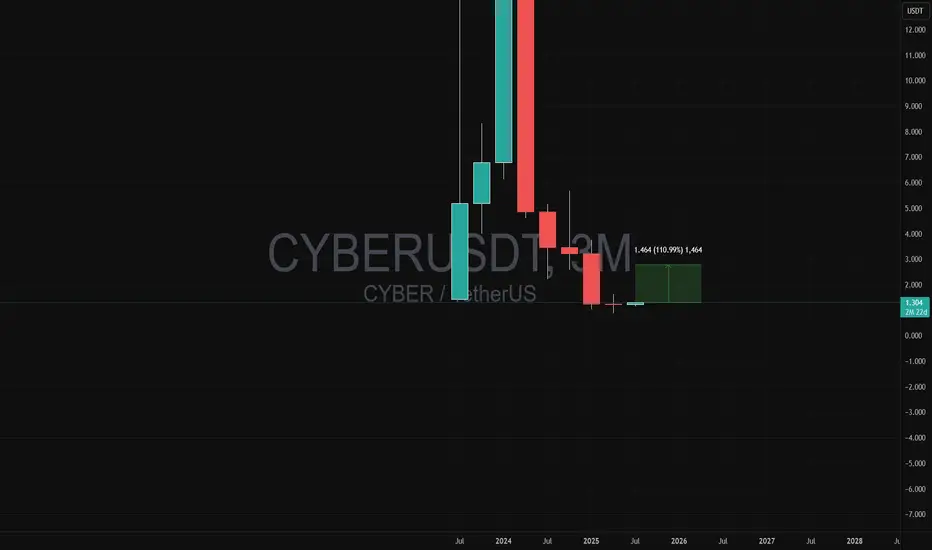
CYBER is ready to move higherAfter big dump, bottoming pattern formed succesfully and CYBER can go easily to the upside.
Expecting targets 40-110% in the mid term.
THIS IS NOT A FINANCIAL ADVICE
MANAGE YOUR RISK AND SET STOPLOSS ALWAYS
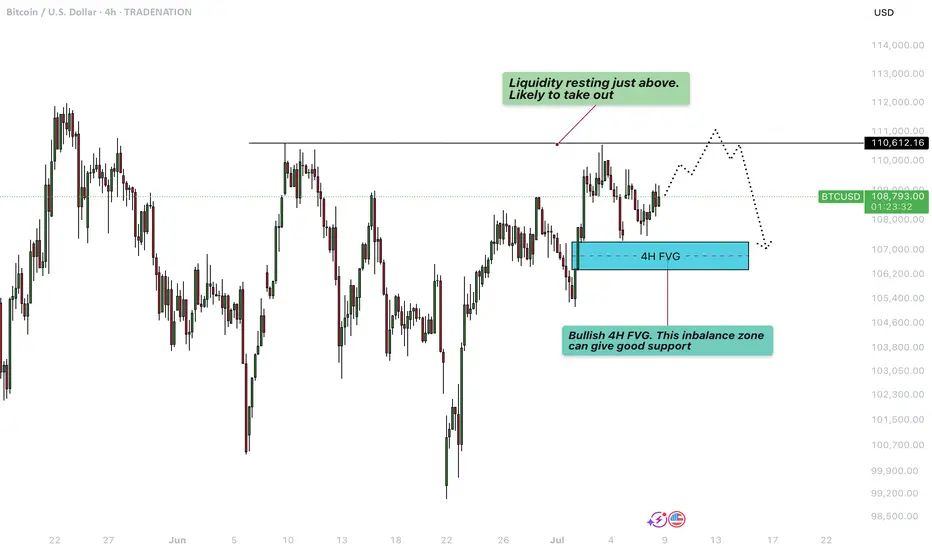
Bitcoin - Liquidity grab at $111.000?This 4-hour BTCUSD chart illustrates a potential short-term bullish continuation scenario followed by a deeper retracement, highlighting key liquidity levels and an important Fair Value Gap (FVG) support zone.
Liquidity sweep
At the top of the current price action, just above the $110,612.16 level, there is a clear area of resting liquidity. This zone has likely accumulated a significant number of stop-loss orders from traders who are shorting the market or who went long earlier and are protecting profits below previous highs. The market tends to seek liquidity to fill institutional orders, making this zone a high-probability target for a sweep. As a result, price is likely to take out these resting stop orders in a quick upward move, often referred to as a "liquidity grab" or "stop hunt", before potentially reversing or consolidating.
Bullish 4H FVG
Following this liquidity sweep, the chart suggests a retracement into a bullish 4-hour Fair Value Gap (FVG) located around the $106,600 to $107,400 region. This imbalance zone was formed during an impulsive move up, leaving behind a gap between the wicks of consecutive candles. Such gaps represent areas where demand previously overwhelmed supply, and they often act as strong support on a retest. If price revisits this zone, it is expected to offer support and could serve as a base for another upward push, assuming bullish momentum remains intact.
Downside risk
However, if the bullish FVG fails to hold as support and price breaks down through this imbalance zone, it would signal a weakening of bullish structure. In that case, the breakdown would likely lead to a deeper correction or even a trend reversal, with price seeking lower levels of support further down the chart. This would invalidate the short-term bullish scenario and suggest that sellers are gaining control, possibly triggering further liquidations and more aggressive selling pressure.
Conclusion
Overall, the chart is currently leaning bullish, anticipating a liquidity sweep to the upside followed by a potential pullback into the FVG. The reaction at the FVG will be critical in determining whether the market can continue higher or if it shifts into a deeper bearish correction.
Disclosure: I am part of Trade Nation's Influencer program and receive a monthly fee for using their TradingView charts in my analysis.
Thanks for your support.
- Make sure to follow me so you don't miss out on the next analysis!
- Drop a like and leave a comment!
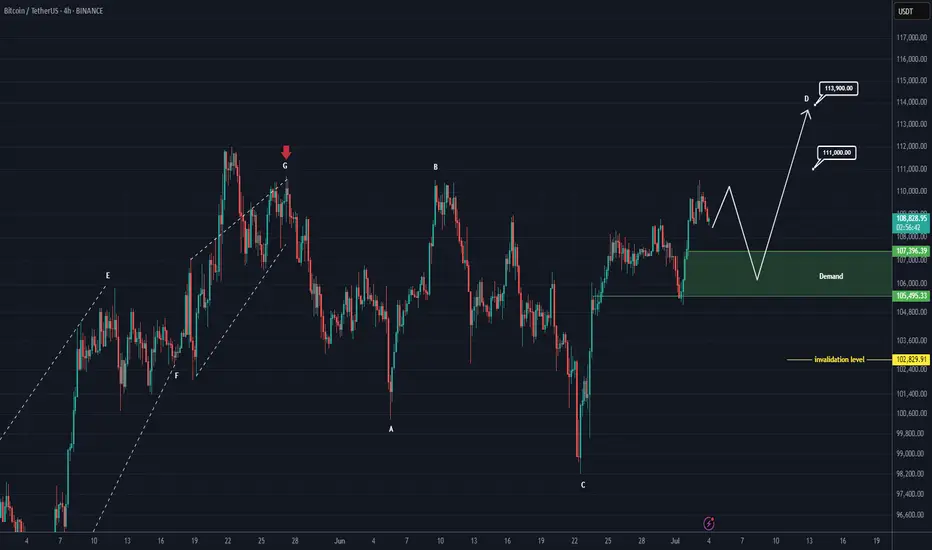
Bitcoin New Update (4H)This analysis is an update of the analysis you see in the "Related publications" section
If we were to publish an update for Bitcoin, wave D could move toward higher levels.
After hitting the green zone and gaining momentum, it could once again move upward to liquidate short positions.
In this update, we've naturally raised and revised the invalidation level.
The new targets have been marked on the chart.
A daily candle closing below the invalidation level would invalidate this analysis.
For risk management, please don't forget stop loss and capital management
Comment if you have any questions
Thank You
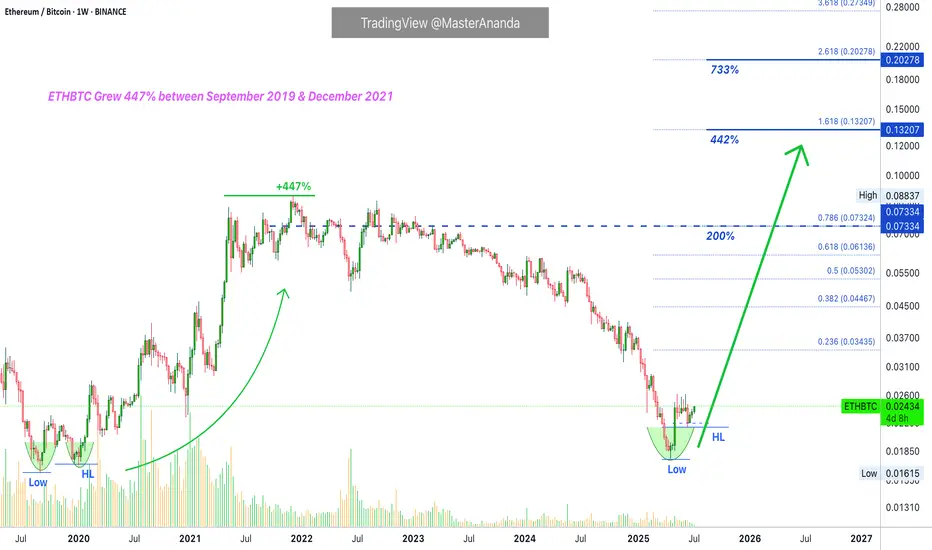
ETHBTC Opportunity Buy: Major 2025 AltcoinSeason & Bull MarketThis is the big one and the good one. ETHBTC was bearish since December 2021 but this cycle finally came to an end in April this year. After the initial bullish breakout and higher low we can clearly see some bullish action developing; three consecutive weeks green. The bullish bias is now confirmed. It is still early.
We are looking at 200% potential. The "back to baseline" target. This is a price range where ETHBTC traded sideways as part of a distribution phase for more than two years. This is a must-to-be-tested resistance zone and thus opens up a sure 200% profits potential for this newly developing bullish wave.
Ethereum's ETFs are coming, Bitcoin already has its ETFs. This can mean Ethereum outperforming Bitcoin, and many altcoins, in so many ways. This also opens up the potential for a new all-time high on this pair.
The same sequence of 'low-higher low' happened in the last bull market. ETHBTC hit bottom in September 2019 then produced a higher low and this signaled the start of a major, long-term 447% rise. The conditions are similar now but the rise will be faster.
We have two main targets for the all-time high in late 2025 or early 2026.
1) 0.13207. With 442% profits potential from current price.
2) 0.20278. With 733% profits potential.
The entire bullish cycle for this pair can unravel within 4-6 months. If it becomes extended, it can last one year or longer. Both scenarios are possible.
It is 100% certain that ETHBTC will go on a major bullish cycle together with the rest of the altcoins market. Bitcoin will also grow.
Thanks a lot for your continued support.
If you are bullish on Crypto, comment below.
Namaste.
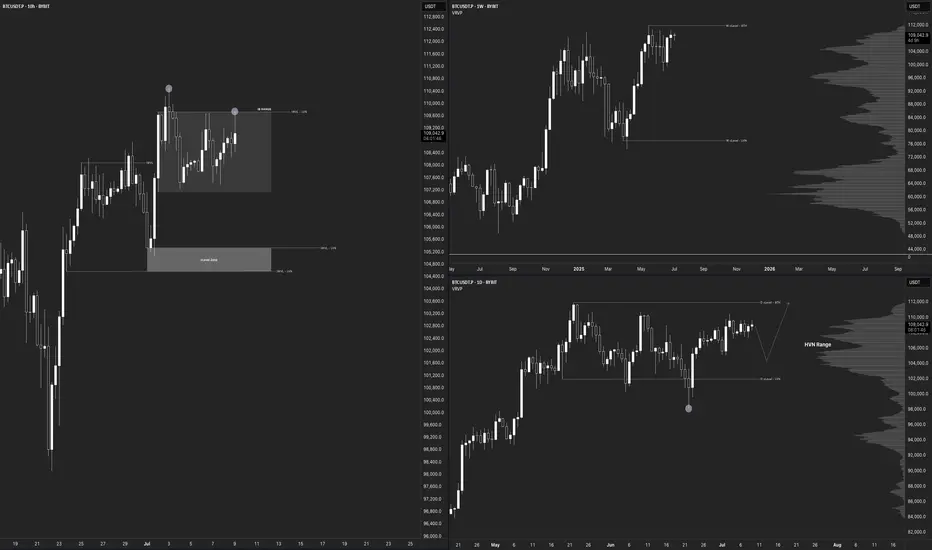
$BTC Daily Outlook BYBIT:BTCUSDT.P
Macro Picture
Weekly Chart
Both Bias & Momentum aligned bullish
Moving towards 111968.0 vLevel (HH) - ATH
Be careful with Weekly FA from that Level
More upside room from here
vLevels Range between 111968.0 - 77083.5
Daily Chart
Both Bias & Momentum aligned Bullish
Failed Auction at 102000.0
Validated from Volume Footprint Charts - Selling Delta trapped on this Failed Auction - POC & Value Area at Wick Lows
vLevels Range between 111968.0 - 102000.0
More Upside room from here, but overall consolidation for now as we are inside a High Volume Node
A pullback would be ideal to look for entries
10-Hour Chart
Price is currently inside an Inside Bar Range between 109740.9 - 107134.7
Overall momentum from the Intraweek Chart (10-Hour) is bearish due to a Failed Auction around 109740.9
Need to wait for confirmation for New Failed Auction Today.
vLevels zone around 105335.0 - 104567.0
Would be nice to have a pullback towards this zone, in which we can start looking for rejections for Intra-Week Longs
Nice zone to look for longs is also IB Range Low 107134.7
Intraday Picture
1-Hour Chart
No outlook for now, waiting for Intra-Week Chart Confirmation
No shorts from here, as HTF bias & momentum remain bullish
Patience - Overall range, don't want to get chopped here.
10-Minute Chart
No Outlook for now, waiting for MTFs and HTFs confirmation
Bitcoin Outlook — Narrative Recap
On the higher time-frames the picture is straightforward: both weekly and daily bias and momentum are in sync to the upside. Price is grinding toward the prior all-time high vLevel at 111 968 USD. Treat that level with respect, if a weekly failed auction (FA) forms there, it could mark the next inflection, but for now there is still air between price and that resistance. The broader weekly value range spans from 111 968 USD down to 77 083 USD.
The daily chart reinforces the bullish thesis. A failed auction printed at 102 000 USD, and volume-footprint data show sell-side delta trapped at those wick lows; the point of control and value area also sit there. 102 k is now strong support. Price is chopping inside a high-volume node, so a healthy pullback toward 102 k (or at least into value) would be the ideal place to reload longs before the next push higher.
Drop to the 10-hour “intra-week” view and momentum tilts short-term bearish. Price is boxed inside an inside-bar range between 109 741 USD and 107 135 USD after a failed auction at the range high. The preferred play is patience: let price drift into either the IB low at 107 135 USD or, even better, the deeper vLevel cluster at 105 335 USD – 104 567 USD. There we’ll watch for a fresh failed auction or obvious seller exhaustion to trigger new longs targeting the ATH zone.
On the 1-hour and 10-minute intraday charts there is no edge yet, conditions are choppy and hostage to the intra-week setup to align with the Higher Timeframes. With higher-time-frame bias still firmly bullish, fading strength makes little sense; stand aside until the 10-hour chart confirms a pullback and reversal.
Bottom line: stay bullish, stalk a pullback, and look to join strength from 107 k or 105–104 k. A decisive daily close back below 102 k would force a rethink; until then, patience is the edge.
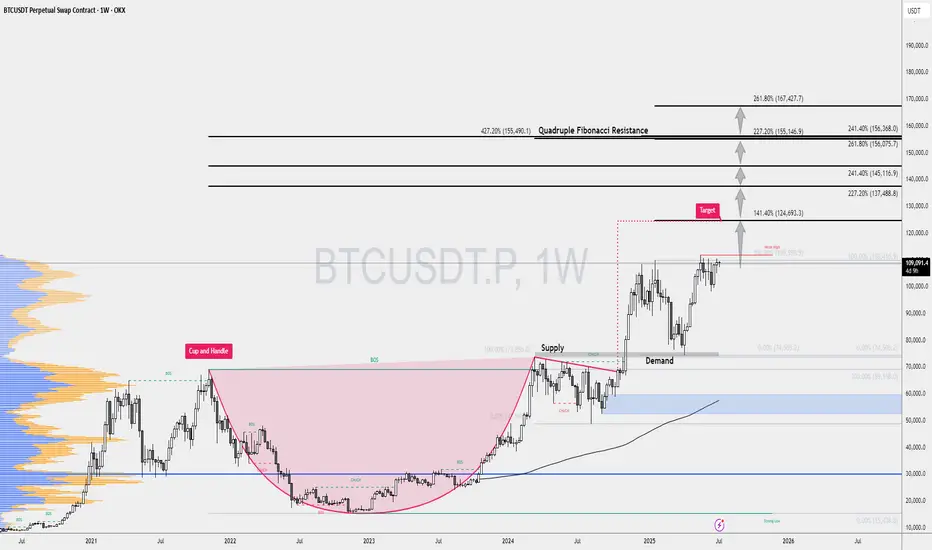
BTC Bulls, this one is for you ;)As most of you know, I’ve been bullish on Bitcoin for quite a while now. And today, I want to show you exactly which resistance levels I’m watching if the breakout continues.
On the weekly BTC/USDT chart, I’ve marked out five key upside targets, all based on Fibonacci extension levels — not just random lines, but technical zones that often attract serious reaction from the market.
Let’s break them down:
🔸 Target 1 — $124K
This lines up with the 141.4% Fibonacci extension and also happens to match the projected move of a textbook Cup & Handle pattern. It’s the first big checkpoint.
🔸 Target 2 — $137K
Here we’ve got the 227.2% Fib level — a classic continuation zone if momentum remains strong.
🔸 Target 3 — $145K
Next up is the 241.4% extension, where we could see some heavier resistance and price interaction.
🔸 Target 4 — $155K
One of the strongest zones on the map. Why? Because it merges four separate Fibonacci extensions in one cluster. A real decision point.
🔸 Target 5 — $167K
And the final target (for now) — the 261.8% extension. If BTC gets here, it’ll be a major event.
🎯 My View:
This isn’t hopium. These levels are based on market structure, Fibonacci math, and historical behavior. As always, I’ll adjust based on price action, but these are the areas I’m preparing for.