TradeCityPro | Bitcoin Daily Analysis #122👋 Welcome to TradeCity Pro!
Let’s dive into the latest analysis of Bitcoin and major crypto indicators. As usual, this update will focus on potential triggers for the New York futures session.
⌛️ 1-Hour Timeframe
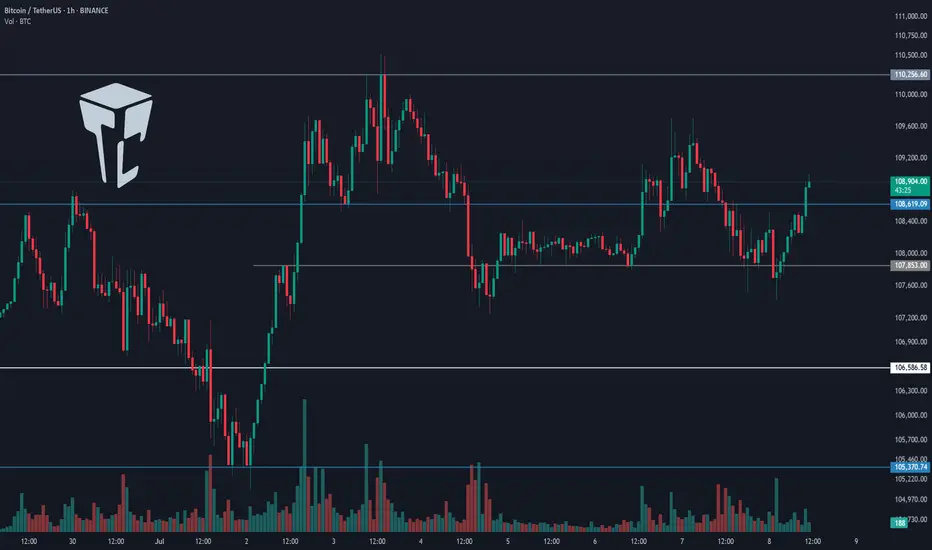
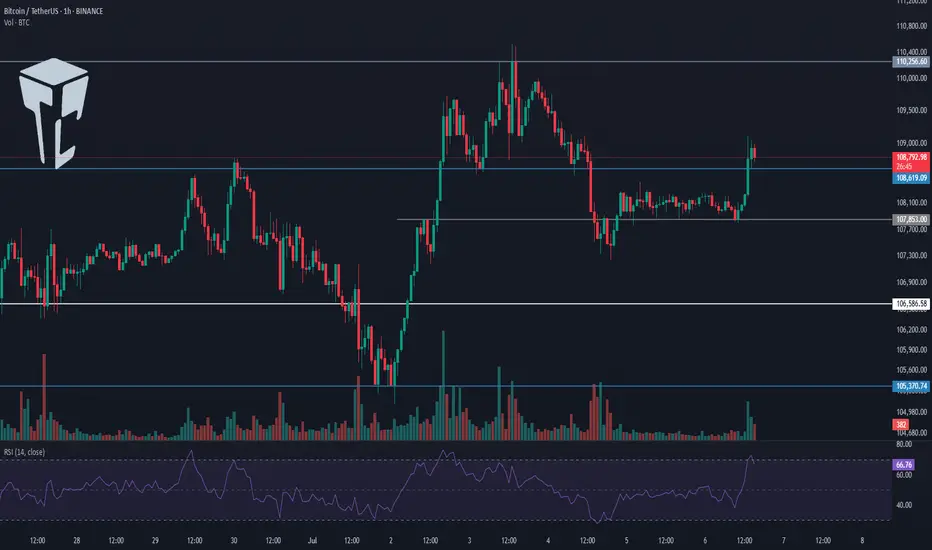
On the 1-hour chart, Bitcoin is once again ranging between the 107,853 and 108,619 levels.
✔️ Last night, Bitcoin briefly faked out below the bottom of this range, so we now need to wait and see how the price reacts upon revisiting this area.
💫 I believe it’s best to hold off on entering a short position until we identify the precise location of the support line. As price retests this area, we can pinpoint the true support level.
✨ Once that level is confirmed, and if it breaks, a short position could be considered. The next support zones would be at 106,586 and 105,370.
📊 Make sure to watch the volume closely for this trade, and I strongly recommend waiting for a volume confirmation before entering.
📈 As for a long position, if 108,619 breaks to the upside, we could consider going long. The buying volume in the current upward leg is increasing, and if this trend continues, a breakout above 108,619 would make a long position reasonable.
👑 BTC.D Analysis
Moving on to Bitcoin dominance — it has once again reached its trendline and is currently being rejected from it. If this rejection continues, BTC.D could decline toward 65.04.
🔍 However, if the trendline breaks, the 65.31 level will be the bullish confirmation trigger.
📅 Total2 Analysis
Now on to the Total2 index (altcoin market cap excluding BTC), it has bounced from the 1.14 support and is moving toward 1.16.
🔑 A breakout above 1.16 would serve as a bullish confirmation for long positions, with 1.17 acting as the main breakout trigger.
📅 USDT.D Analysis
USDT dominance is also moving downward and has reached the 4.78 support zone.
💥 A breakdown below this level would confirm a bearish continuation toward the 4.72 level..
❌ Disclaimer ❌
Trading futures is highly risky and dangerous. If you're not an expert, these triggers may not be suitable for you. You should first learn risk and capital management. You can also use the educational content from this channel.
Finally, these triggers reflect my personal opinions on price action, and the market may move completely against this analysis. So, do your own research before opening any position.
Bitcoin (Cryptocurrency)
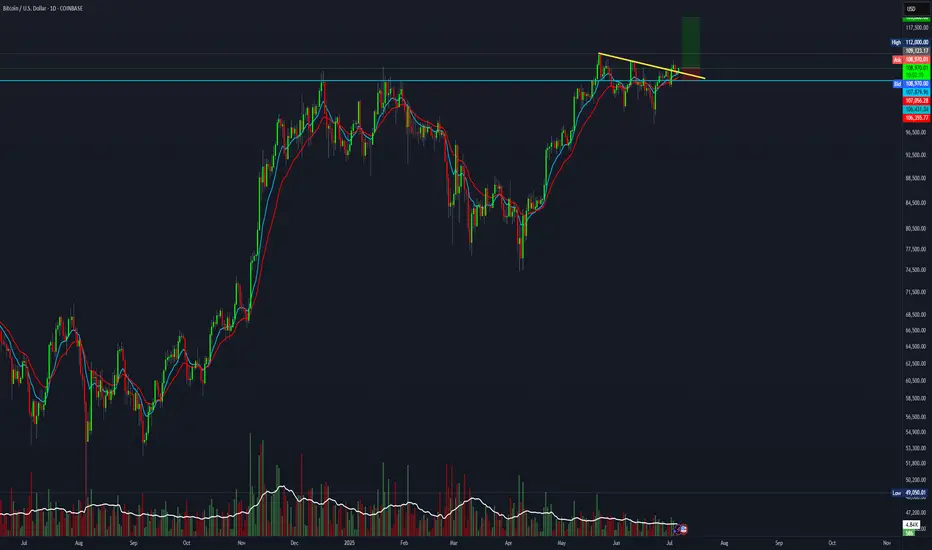
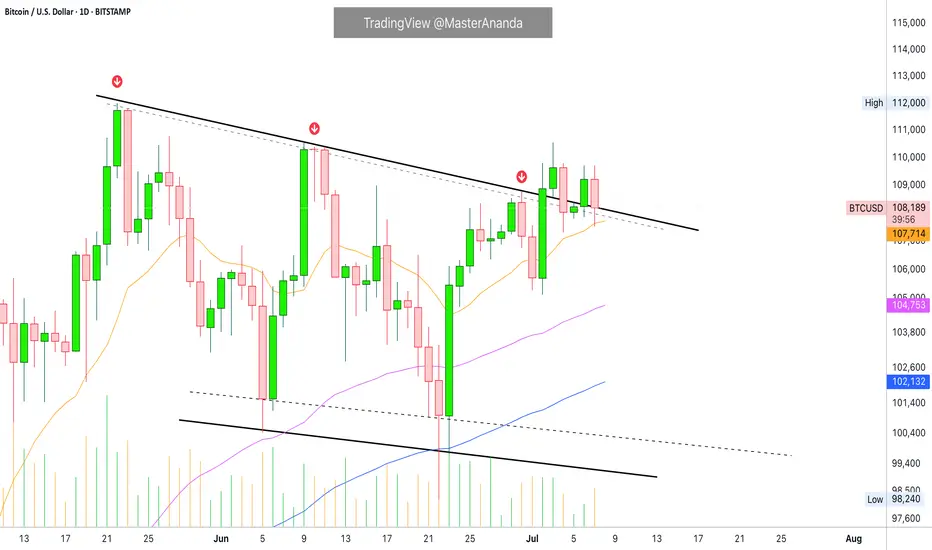
BTC/USD SCENARIO Bitcoin is trying to break out of the 110,000
If we break out we will see a new high
If we don’t break it we could see 105k possibly 100k

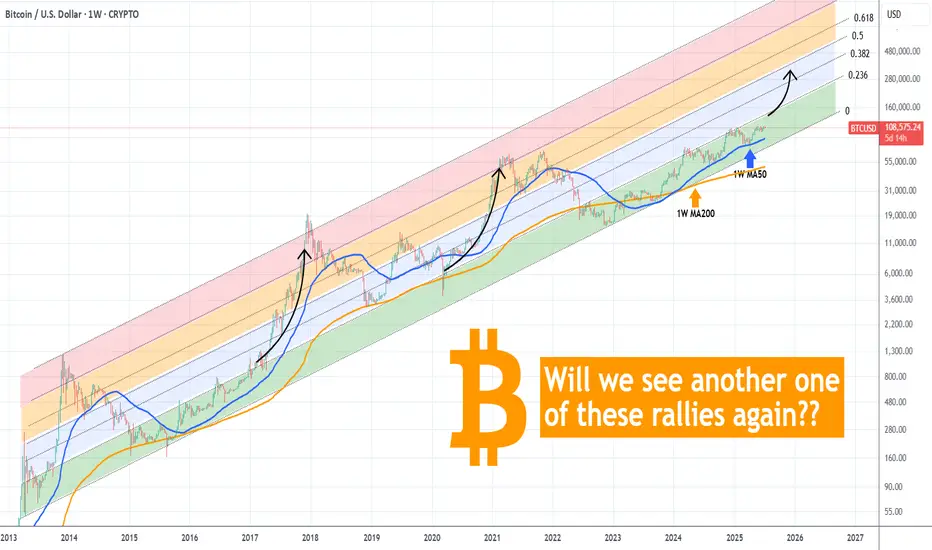
BITCOIN Is there enough time for another parabolic rally?Bitcoin (BTCUSD) is practically consolidating on the short-term, having just recently been rejected off its new All Time High (ATH). Despite the short-term volatility, the long-term outlook is still a very strong, structured uptrend, a Channel Up pattern that is now technically aiming for its next Higher High.
Incredibly enough, this Channel Up since the November 2022 market bottom, has been almost entirely within the Buy Zone (green) of the Fibonacci Channel Up going back all the way to April 2013!
As you can see during the previous two Cycles, every time BTC got above that Buy Zone, it started a parabolic rally. So far, we haven't got such rally on the current Cycle and with time running out (assuming the 4-year Cycle model continues to hold), do you think we will get one this time around?
Feel free to let us know in the comments section below!
-------------------------------------------------------------------------------
** Please LIKE 👍, FOLLOW ✅, SHARE 🙌 and COMMENT ✍ if you enjoy this idea! Also share your ideas and charts in the comments section below! This is best way to keep it relevant, support us, keep the content here free and allow the idea to reach as many people as possible. **
-------------------------------------------------------------------------------
💸💸💸💸💸💸
👇 👇 👇 👇 👇 👇
BTC setup with a 3.9 risk-to-reward ratio.Is BTC beginning a bullish move toward 120K?
This setup offers a 3.9 R:R with an
Entry at 109,000
Stop loss at 106,355
Target 120,000
Not financial advice.
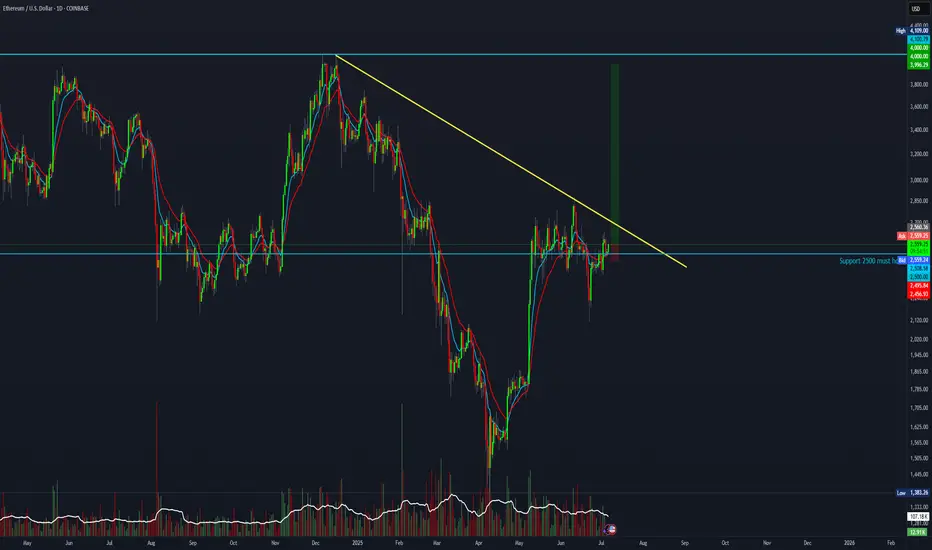
Ethereum setup with a 14 R:R.Let’s see if this time marks the beginning of bullish momentum.
This setup offers a 14:1 risk-to-reward ratio
Entry at 2560
Stop loss 2457
Target at 4000.
Bitcoin Daily, Mixed Situation · Bitcoin vs Altcoins · Not MixedI came with the intention of doing an update on the weekly timeframe, the chart doesn't look great.
Here we are looking at Bitcoin daily and once more the situation is mixed to say the least. It is hard to predict with exactitude with such a chart. In this case, we have to look for clues in other places. The altcoins.
But before we go there let's consider a few of the actualities that are present on the Bitcoin chart.
Bitcoin price action
Mixed or not mixed, the action continues to happen at resistance against all odds; this is bullish.
Bitcoin is trading safely above $106-$107,000 daily, and this is also bullish.
Bitcoin is trading above all moving averages we track and nothing is more bullish than that. MA200 sits around $96,000. EMA55 at $104,700 and EMA13 at $107,700.
Bitcoin will be bullish regardless as long as it trades above these levels and at a such strong price. So the mixed part is only psychological. It is mixed because people are afraid of a drop or want to see it drop. It is bullish based on the actual numbers and the chart.
The altcoins market vs Bitcoin
Some altcoins are breaking up today two to three digits green. Those good old reputable projects. This wouldn't be happening preceding a major bearish wave. Such strong action on the altcoins tends to precede a major bull market. Last week there were other pairs breaking really strong, the previous week another group, this week a new group and so on. Slowly but surely the low prices are disappearing but this isn't still a marketwide occurrence, we can see/say that the market is in no hurry.
Another relationship between Bitcoin and the altcoins relates to how many are behaving; when Bitcoin is about to crash, the altcoins tend to crash really strong and fast. The altcoins don't wait and just go down and continue diving deep if Bitcoin is about to produce a major crash. But this isn't the case, many altcoins are already at bottom prices but not based on a crash but a very slow and drawn out retrace. From these lows they are recovering strong.
When Bitcoin is bullish, sideways with a strong price within a bull market, the altcoins tend to grow. It is the same signal looked at from a different perspective. These altcoins are telling us that behind the scenes Bitcoin is bullish and we know Bitcoin is bullish because it is trading above $107,000. A bullish continuation is the next logical step.
Thank you for reading.
Boost if you agree.
Namaste.
TradeCityPro | Bitcoin Daily Analysis #121👋 Welcome to TradeCity Pro!
Let’s dive into the Bitcoin analysis and key crypto indicators. As usual, I’ll walk you through the triggers for the New York futures session.
⏳ 1-Hour Timeframe
As you can see on the 1-hour timeframe, the upward move Bitcoin made yesterday turned out to be a fakeout, and the price is now heading downward.
⚡️ I’m not moving the 108619 line for now. I’ll wait to see if the price reacts to it again in the future, then decide whether to adjust it.
✅ Currently, if the 107853 level breaks, we can enter a short position. We already have volume confirmation, and if this increase in volume continues, we could see a sharp downward move.
📈 Next support levels for Bitcoin in this timeframe are 106586 and 105370, which can be used as targets.
✨ If Bitcoin starts moving upward again, the long trigger remains the 110256 level. A breakout here would mark the beginning of a true uptrend.
👑 BTC.D Analysis
Bitcoin dominance continued its downward move today, dropping close to the 65.04 level.
🔼 We’re currently seeing a reaction at this level, suggesting some support. A break below 65.04 could trigger a strong downtrend.
📅 Total2 Analysis
This index is still in an uptrend but showing significant weakness. It’s currently sitting on key support at 1.15.
⚡️ A break below this level could give us a short position. Additional support levels are 1.14 and 1.13. For a long position, the only trigger we have right now is 1.17.
📅 USDT.D Analysis
Looking at Tether dominance, it’s still hovering around the 4.78 level. After a brief fakeout below, it has returned above that zone.
📊 If this level breaks again, Tether dominance could move down toward 4.72.
❌ Disclaimer ❌
Trading futures is highly risky and dangerous. If you're not an expert, these triggers may not be suitable for you. You should first learn risk and capital management. You can also use the educational content from this channel.
Finally, these triggers reflect my personal opinions on price action, and the market may move completely against this analysis. So, do your own research before opening any position.
Bitcoin - The ultimate breakdown for 2025/2026Welcome to my channel and this analysis. In this analysis I will dive deep in the current Bitcoin’s bullmarket. I will examine charts from the monthly, weekly, daily and 4H charts, and also on chain data. This will be a complete insight in Bitcoin’s price.
------------------------
Monthly timeframe
Logarithmic BTC chart
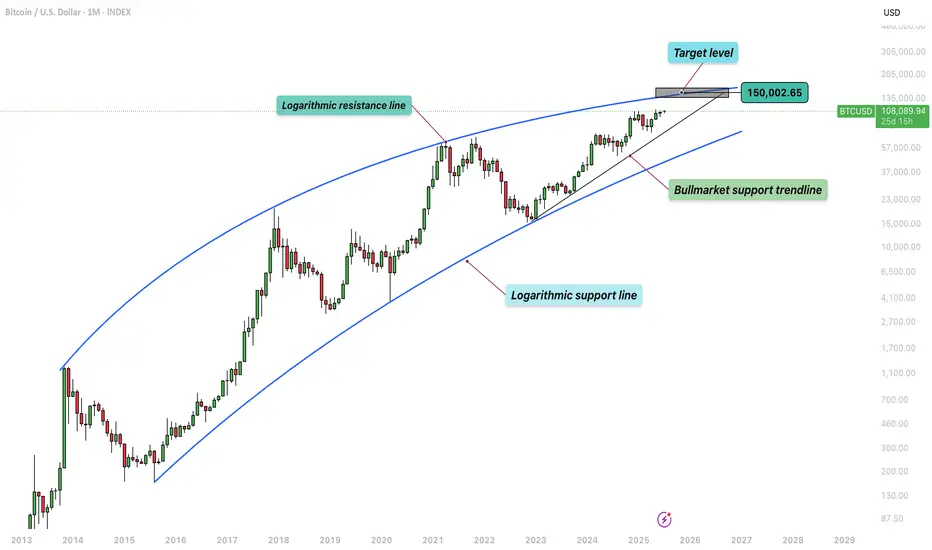
This chart presents a long-term logarithmic analysis of Bitcoin using monthly candles, covering the period from around 2013 to mid-2025. The structure is defined by two major curved lines representing a logarithmic resistance and support channel, which frames Bitcoin's price movement over more than a decade. These lines form a dynamic, upward-sloping price corridor, capturing Bitcoin's historically exponential price behavior and cyclical nature. The vertical axis uses a logarithmic scale to better reflect percentage-based changes, which is critical when analyzing an asset like Bitcoin that has grown from under $100 to over $100,000 in just a few years.
The chart displays clear multi-year cycles. The first notable cycle begins in 2013, followed by a significant correction in 2014–2015. A new bullish phase emerges between 2016 and 2018, peaking near $20,000. This is followed by a crash into 2018. A longer accumulation period precedes the 2020–2021 rally, which reaches a high around $69,000 before another sharp decline. From the bottom in late 2022 or early 2023, Bitcoin begins another uptrend, forming a steep rise along a newly established bullmarket support trendline. This trendline represents a more aggressive, linear support structure within the broader logarithmic curve, showing the strong momentum driving the current bull phase.
By July 2025, Bitcoin is trading around $108,000, advancing steadily toward the upper boundary of the long-term logarithmic resistance. A key element of this chart is the target level marked at approximately $150,000, which aligns closely with the point where the current trajectory intersects the upper logarithmic resistance. This zone has been highlighted as a likely area of interest, possibly signaling a market top or at least significant resistance, based on Bitcoin's past behavior. Historically, Bitcoin has tended to reverse sharply or consolidate after reaching this upper boundary, making the target zone an area of potential distribution or heightened volatility.
The bullmarket support trendline serves as a short- to medium-term structure within the larger logarithmic channel. As long as price holds above this line, the current bullish structure remains intact. A breakdown below this trendline could indicate a loss of momentum and trigger a broader correction.
The use of logarithmic trendlines underscores Bitcoin’s tendency to move in exponential growth cycles, shaped by macroeconomic trends, halving events, and adoption waves. The resistance and support boundaries function as dynamic guides for long-term expectations rather than rigid barriers.
The stoch RSI crosses
This chart provides a technical overview of Bitcoin on a monthly timeframe using candlestick analysis and the Stochastic RSI (Stoch RSI) oscillator to distinguish between bull and bear market phases. The Stochastic RSI, shown at the bottom of the chart, is a momentum oscillator derived from the RSI rather than price directly, making it particularly useful for identifying overbought and oversold conditions in trending markets. The key thresholds are the 80 level at the top and the 20 level at the bottom, which respectively indicate overbought and oversold zones.
The chart spans from 2017 to mid-2025, clearly separating bull and bear markets using vertical red lines and labeled annotations. Each major cycle aligns with movements in the Stoch RSI indicator. Notably, crosses above the 80 line (into overbought territory) are often associated with late-stage bull market tops or strong bullish continuations. Crosses below the 20 line (into oversold territory) typically align with bear market bottoms or the start of new accumulation phases.
Starting with the December 2017 peak, the Stoch RSI crossed above the 80 level, reaching extreme overbought territory. This cross occurred at the height of that bull cycle, signaling a likely exhaustion of momentum. Not long after this peak, the market entered a bear phase, confirmed by the downward cross of the Stoch RSI below the 80 level, and eventually below 20, leading into the 2018–2019 bear market.
By August 2019, the Stoch RSI crossed below the 20 level, signaling oversold conditions. Although this did not immediately launch a new bull market, it did suggest the market was bottoming out. This was followed by a gradual recovery and another decisive upward cross above 80 around April 2021, right in the midst of the strong 2020–2021 bull run. That cross confirmed the continuation of upward momentum and coincided with Bitcoin reaching new all-time highs.
As the price peaked in late 2021 and early 2022, the Stoch RSI again turned downward and dropped below the 20 threshold, marking another prolonged bear market. This downtrend was confirmed as the oscillator remained suppressed in the oversold zone for most of 2022.
The Stoch RSI is now moving again towards the overbought territory. This means that bulls have the control in the market and likely to push higher.
RSI with the consolidation and resistance trendline
This chart presents a broader monthly view of Bitcoin's price action alongside the Relative Strength Index (RSI), revealing a compelling structural alignment between price momentum and long-term resistance dynamics.
At the top of the chart, the candlestick pattern shows a clear upward trend spanning across multiple market cycles. A long-term resistance trendline has been drawn that connects the major highs from the two previous bull markets, specifically the peaks in late 2017 and late 2021. This resistance line acts as an upper boundary to the macro trend and, so far, the current price action in 2025 has not yet tested this long-term resistance. In fact, while Bitcoin has recently reached above $100,000, it remains below the ascending resistance trendline, suggesting that there could still be room for price to move higher before encountering the next major overhead challenge. The structure implies a potential upward continuation if momentum sustains, and the price may attempt to test this historical trendline in the near future.
Below the price chart, the RSI indicator offers additional insight into the underlying strength of this move. A descending RSI trendline connects the previous overbought peaks from 2017 and 2021, forming a macro resistance trendline in momentum that mirrors the structure seen in price. This declining RSI resistance has not yet been reached in the current cycle, implying that momentum still has space to grow before hitting a potential exhaustion point. The RSI is currently capped within a relatively tight consolidation box, with values fluctuating between the mid-60s and low-70s.
200W SMA crosses above the previous ATH
This chart illustrates the long-term price action of Bitcoin, focusing on the relationship between the 200-week simple moving average (SMA) and previous all-time highs (ATHs). Historically, when the 200-week SMA crosses above the previous cycle’s ATH, it has coincided with periods near the cycle tops. For example, in December 2017 and January 2022, the 200-week SMA moved above the prior ATH, which closely aligned with significant market peaks.
In the current cycle, however, the 200-week SMA has not yet crossed above the previous ATH from 2021, which is around $68,889.04. This is notable because, in past cycles, this crossover has typically marked the later stages of a bull run. The fact that this crossover has not yet occurred suggests that Bitcoin may still have room to move higher before reaching a new cycle top. However, it is important to recognize that this does not guarantee further upward movement. Even if Bitcoin’s price consolidates or moves sideways for an extended period, the 200-week SMA will gradually rise due to its lagging nature and could eventually cross above the previous ATH without a significant price rally.
Lets now move to the weekly charts and analyse where we are.
------------------------
Weekly timeframe
Support and resistance trendlines
This chart shows Bitcoin’s price action on a weekly timeframe, highlighting three key trendlines. Two resistance trendlines are drawn from the peaks of the last two major cycles, forming an upper boundary for price action. These lines act as potential resistance zones, indicating areas where previous rallies have topped out and where the current price could face selling pressure if it approaches these levels again.
Additionally, there is a clearly defined rising trendline that serves as bull market support. This trendline has been respected throughout the current cycle, connecting the higher lows since the market bottomed out in late 2022. As long as Bitcoin’s price continues to hold above this bull market support trendline, the overall bullish structure remains intact. This suggests that the uptrend is still healthy and that corrections or pullbacks, as long as they stay above this line, are part of a normal, sustainable bull market. If the price were to break below this support, it could signal a shift in market sentiment and potentially a deeper correction. For now, maintaining support on this trendline is a positive sign for the ongoing bull market.
Bearish divergence
The chart shows that Bitcoin has formed three consecutive price peaks, with each new high surpassing the previous one. This indicates that, from a price perspective, the market has maintained its upward momentum over this period. However, when looking at the Relative Strength Index (RSI) below the price chart, a different pattern emerges. Each time the price has made a new high, the RSI has registered a lower high, resulting in a clear bearish divergence. This is visually reinforced by the downsloping trendline that can be drawn across the RSI highs, in contrast to the uptrend in price.
Bearish divergence between price and RSI, as seen here, often signals underlying weakness in the buying momentum, even as price continues to rise. It suggests that each successive rally is being driven by less enthusiasm or participation from buyers. Given this setup, it is possible that the RSI could revisit the downsloping trendline in the near future. If this occurs, the price might make a marginally higher high, potentially forming a third peak slightly above the current level. This would maintain the divergence and could act as a warning sign for traders to be cautious about the sustainability of the current uptrend.
Stoch RSI
This chart presents the weekly price action of Bitcoin alongside the Stochastic RSI indicator. What stands out is the clear cyclical pattern in the Stoch RSI, where it tends to reach oversold levels roughly once every half year. These oversold readings have historically aligned with significant local bottoms in the price, signaling favorable buying opportunities for traders and investors. After reaching these low points, the Stoch RSI typically trends upward, eventually entering the overbought zone.
When the Stoch RSI enters overbought territory, as it does several times on this chart, it often coincides with local price peaks. These moments serve as warnings that the market may be overheated in the short term, and traders should be cautious about opening new long positions. The overbought readings suggest that a pullback or period of consolidation could be imminent, as the market works off excess bullish momentum.
Currently, the Stoch RSI is once again in the overbought zone. This suggests that Bitcoin may be vulnerable to a further pullback or at least a pause in its upward movement. While this does not guarantee an immediate reversal, it does mean that risk is elevated.
Failed breakout/liquidity grab
This weekly Bitcoin chart illustrates a strong and consistent uptrend that has been developing since late 2023. Each major move begins with a clear breakout above previous consolidation zones, followed by a retest of the broken resistance, which then acts as support, confirming the trend's strength. These retests tend to hold well, setting up for new bullish impulses.
In the earlier stages, we see BTC breaking out of a range around the $48,851 support level. After a successful retest of that zone, the price surged and entered a new consolidation phase just below $73,643. A second breakout occurred from this level, again followed by a retest that confirmed it as a new support level. This pattern reflects textbook bullish market structure: breakout, retest, and continuation.
However, the current price action shows something different. BTC has returned to its previous high around the $109,301 resistance level. Unlike the previous times, where strong bullish candles closed above resistance, this attempt has only pierced above the level with a wick, indicating potential exhaustion or hesitation. The highlighted label "Failed breakouts / Liquidity grab" suggests that these wick movements may have been attempts to trigger stop orders and gather liquidity before a possible retracement.
Now we will dive deep into the daily timeframe.
------------------------
Daily timeframe
Resistance, bullflag and Stoch RSI
This daily chart of Bitcoin reveals a period of consolidation just below a key resistance zone, which aligns with the previous all-time high area. BTC has been ranging within this red-marked resistance block, showing clear hesitation from buyers to push beyond it with conviction.
During this consolidation, a well-formed bull flag structure appeared, a bullish continuation pattern, signaling potential for further upside. The breakout from this bull flag occurred earlier this week, providing initial bullish confirmation as price pushed briefly above the upper boundary of the flag. However, the breakout lacked follow-through. Instead of sustaining momentum and closing decisively above resistance, BTC appears to have experienced a fake-out, with price now retracing back inside the prior range.
This failed breakout is particularly notable given the context of the Stochastic RSI indicator, which is currently in the overbought zone.
------------------------
4H timeframe
4H FVG and liquidity grab
This 4-hour chart of Bitcoin shows a clear structure where price has recently formed an equal high around the $110,612 level. Equal highs are often seen as zones where liquidity builds up, since many stop-loss orders from short positions typically rest just above them. This makes the area particularly attractive for a potential liquidity grab.
At the moment, BTC appears to be in a short-term retracement phase after rejecting from this equal high region. During this move, price left behind a bullish Fair Value Gap (FVG), which is a zone of inefficiency where price moved too quickly to fill orders. This FVG is now acting as a potential support zone. The chart suggests that BTC may revisit this FVG to rebalance before making another attempt to break through the equal highs.
If BTC can hold the FVG and generate upward momentum, a move above the equal highs becomes more likely. In that case, the resting liquidity just above those highs could be targeted, leading to a quick wick or breakout move before price potentially reverses again.
------------------------
Liquidation heatmap
1 month
This Binance BTC/USDT liquidation heatmap clearly shows that the majority of the liquidity is stacked to the upside. The bright yellow and green bands, which represent areas of high liquidation potential and leverage exposure, are heavily concentrated just above the current price levels, especially around the $111,000 to $114,000 zone. This indicates that many traders have short positions with stop-losses placed above these highs, making them prime targets for potential liquidation events.
As price moves closer to these high-liquidity zones, the probability increases that market participants, particularly larger players or algorithms, may push BTC upwards to trigger those stops and liquidate those positions.
1 week
The current price is hovering around the $108,000 range, with clear liquidity clusters forming both below and above this level. What stands out is the dense liquidation zone just below the current price, this suggests that many traders have placed long positions with stop-losses slightly under this support range. These positions create an opportunity for a liquidity sweep, where price briefly dips down to trigger liquidations, fill larger buy orders, and shake out weaker hands.
After such a sweep, the heatmap shows an even larger cluster of liquidation liquidity sitting just above the highs, especially around the $110,000 to $114,000 region. This is likely composed of stop-losses from short positions and breakout traders who entered too early. The concentration of liquidity here creates a strong incentive for price to target this zone after clearing the downside liquidity.
------------------------
Fear and greed index
Today
The Fear and greed today is at 66, meaning greed. This level suggests that market sentiment is optimistic, but not yet euphoric or irrational. In practice, it often means buyers are confident, and there’s still room for price continuation before we enter extreme greed territory
1 year chart
This chart displays the Crypto Fear & Greed Index over time, offering a visual representation of sentiment cycles in the Bitcoin market.
When examining the past year, you can see how sentiment has recovered significantly from the fear zone (below 30), especially from late 2024 into early 2025. This shift in sentiment aligned with BTC's price climbing back toward previous highs, indicating that sentiment is responding directly to price structure and bullish momentum.
------------------------
BTC exchange reserve
This chart, sourced from CryptoQuant, provides a clear visualization of the relationship between Bitcoin’s exchange reserves (blue line) and BTC price (white line), over a multi-year period. The key insight is the rapid and consistent decline in Bitcoin held on exchanges, especially noticeable from mid-2023 onward.
From around 2022, the amount of BTC on exchanges remained relatively stable. However, beginning in late 2022 and accelerating through 2023 into 2025, we see a shart and uninterrupted drop in exchange reserves.
This ongoing withdrawal trend typically signals accumulation behavior by investors. When BTC is withdrawn from exchanges and moved into cold storage or long-term wallets, it often reflects growing conviction among holders that price will rise and they don’t intend to sell in the short term.
------------------------
Final thoughts
This is a complete Bitcoin analysis for the community with a top-down analysis!
I have worked out a complete insight in the Bitcoin price with different analysis and on-chain data.
I would be excited if you boost, comment and share the analysis with your friends for the work that I have put in this analysis for everyone.
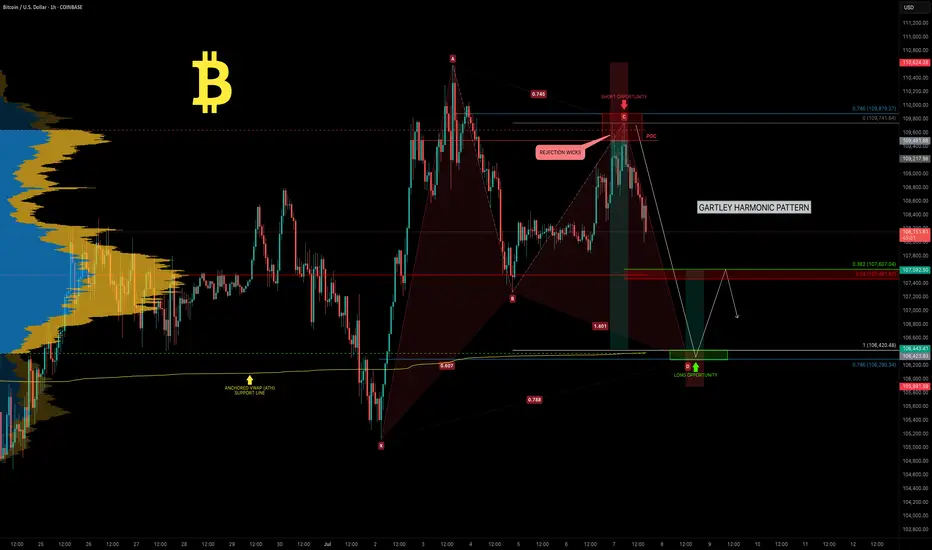
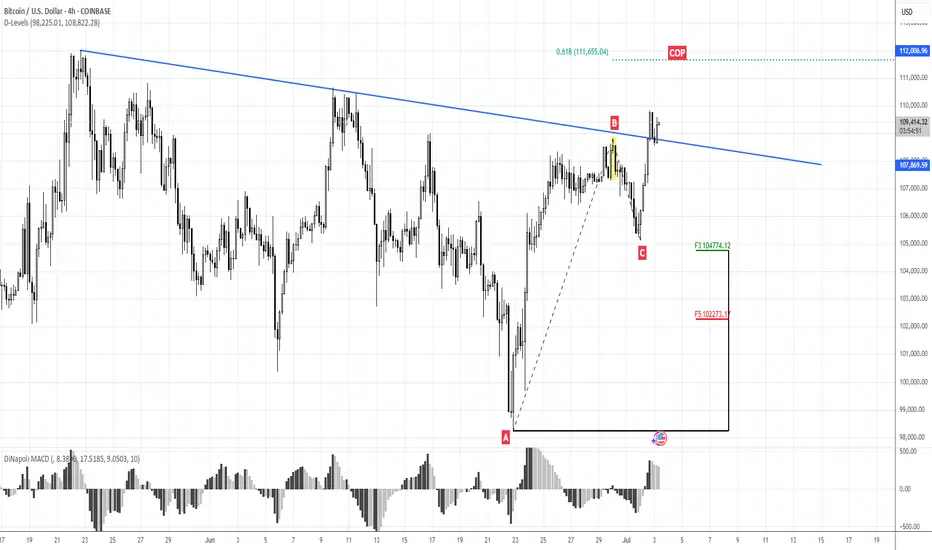
BTC — Weekend Pump Fades.. All Eyes on the Gartley Reversal ZoneBitcoin has been consolidating in a tight range between $110K and $105K over the past two weeks. This weekend’s attempted breakout stalled out quickly! BTC was rejected at the Point of Control (POC) of the previous range and came close to the 0.786 retracement of the recent drop.
🧠 Reminder: Weekend pumps are notorious for being unreliable, especially without strong volume.
Now, the charts point toward something much more structured — a potential Gartley harmonic pattern forming, with multiple levels of confluence suggesting the next key decision zone is just around the corner.
🧩 Gartley Completion Zone: $106,290–$106,400
This price zone is loaded with confluence:
✅ 0.786 Fib retracement of the XA leg sits at $106,290
✅ 1.0 trend-based Fib extension of the BC leg is at $106,370
✅ Anchored VWAP from all-time high aligns precisely at $106,370
✅ VAL (Value Area Low) sits at the same level
✅ Imbalance (Fair Value Gap) from earlier price inefficiency lies in this exact region
All of this stacks up into a high-probability reaction zone.
🎓 Educational Insight: How to Trade a Gartley Harmonic
The Gartley pattern is one of the most powerful harmonic setups — a structured form of retracement and extension that captures exhaustion before reversals. Here's how it works:
🔹 XA: Impulse leg
🔹 AB: Retracement of 61.8% of XA
🔹 BC: Retraces 38.2%–88.6% of AB
🔹 CD: Extends to 78.6% retracement of XA and aligns with a 1.0–1.272 Fib extension of BC
🟢 Point D is the entry zone — your reversal opportunity.
📉 Stop-loss sits just below invalidation (Point X).
💰 Targets usually lie at 0.382 and 0.618 of the CD leg.
🔎 Why It Works: It traps late traders and captures price exhaustion at natural Fibonacci ratios. Combined with other tools — like VWAP, liquidity zones, and order flow — it becomes a high-conviction strategy. These patterns are most effective on higher timeframes like 4H or daily.
_________________________________
💬 If you found this helpful, drop a like and comment!
Want breakdowns of other charts? Leave your requests below.
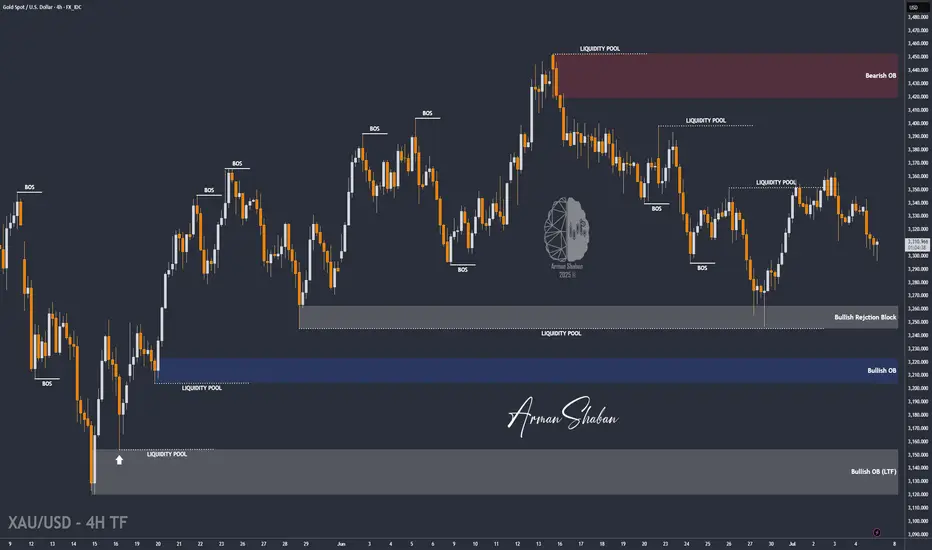
XAU/USD : Get Ready for Another Fall ! (READ THE CAPTION)By analyzing the gold chart on the 4-hour timeframe, we can see that, as expected from our previous analysis, when the price was trading around $3327, it climbed to the supply zone at $3345. After reaching this key level, strong selling pressure emerged, leading to a sharp drop in gold today down to $3296.
This move played out exactly as anticipated, and now, if the price stabilizes below $3330, we could expect further downside pressure on gold.
The Main Analysis :
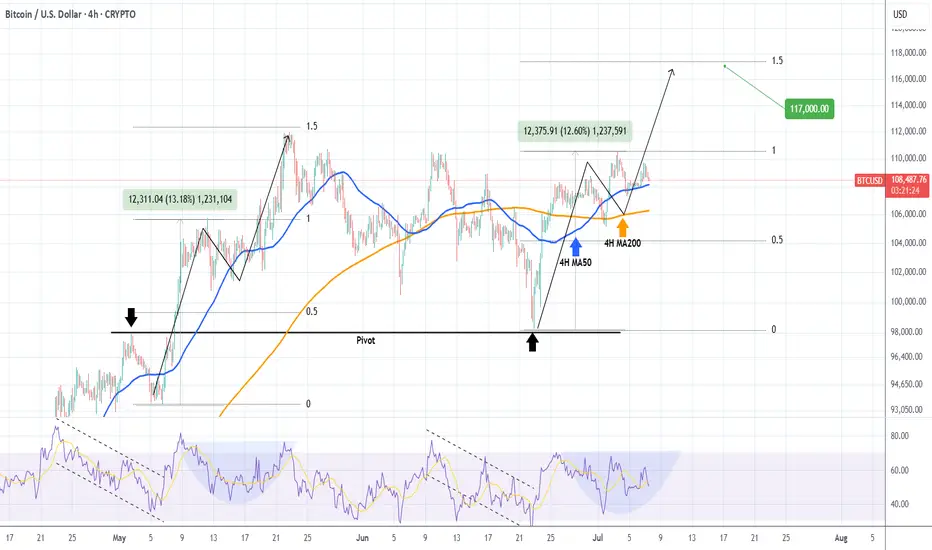
BITCOIN Short-term Target = $117kBitcoin (BTCUSD) is coming off a 4H Golden Cross, attempting to hold the 4H MA50 (blue trend-line) as its short-term Support. The early hours of the E.U. session today show that this might be a difficult task, however comparison with May's Bullish Leg, gives positive signs.
Almost the entire month of May sequence has been an uptrend, which looks very similar to today's. Almost identical rises from their bottoms (+13.60% against +12.60%) until the first top, with similar 4H RSI fractals also, we can expect the current uptrend to make a second top soon near the 1.5 Fibonacci extension at $117000.
Are you expecting such an outcome in the coming days? Feel free to let us know in the comments section below!
-------------------------------------------------------------------------------
** Please LIKE 👍, FOLLOW ✅, SHARE 🙌 and COMMENT ✍ if you enjoy this idea! Also share your ideas and charts in the comments section below! This is best way to keep it relevant, support us, keep the content here free and allow the idea to reach as many people as possible. **
-------------------------------------------------------------------------------
💸💸💸💸💸💸
👇 👇 👇 👇 👇 👇
BITCOIN CRASH INCOMING!!! (Brace Yourself Now???) I am breaking down MARKETSCOM:BITCOIN and the potential completion of the 4th wave on an leading diagonal which might work as an early warning of a crash towards $93k!
Wait for the confirmations, and play the market with a proper trading strategy that you have backtested enough to be able to say that you will be long-term profitable. That means make sure your trading system is good enough that you always have an edge and a great enough money management system to make sure that you are giving your edge enough space to play out in the long run and be robust against losing streaks!

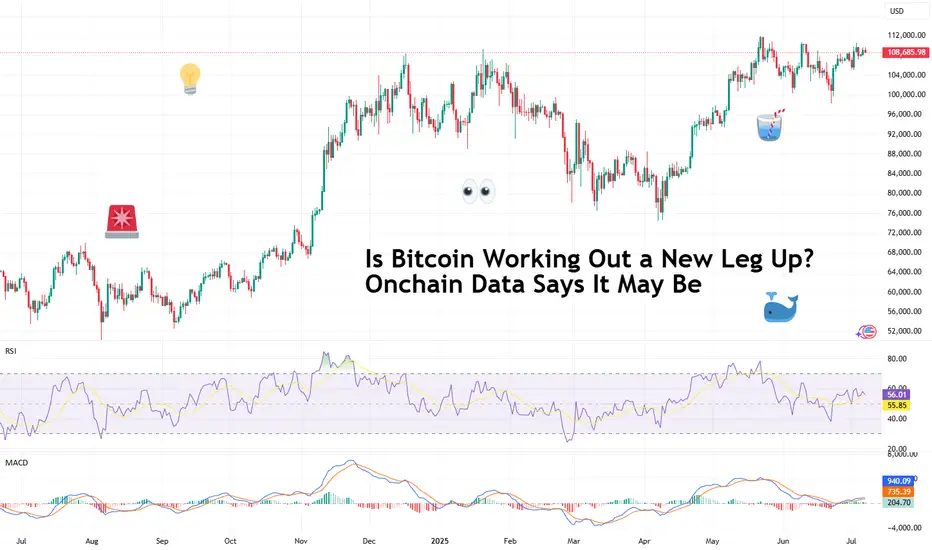
Is Bitcoin Working Out a New Leg Up? Onchain Data Says It May BeDiamond hands are waving goodbye and institutions are loading up — it’s why Bitcoin may be struggling to break out of its current consolidation range. How long can this accumulation phase continue?
And yes — we look at the trades of the decade — two transactions where each one moved a cool billie from a $7.8K investment in 2011.
Some people cling to their Bitcoin BITSTAMP:BTCUSD stash like it’s their last protein bar before a marathon. Others, apparently, wake up one day and decide to dump their coins and browse the market for islands.
Welcome to the silent shift that’s redefining the big players in the Bitcoin market, worth about $2.2 trillion as per data from our Crypto Coins Heatmap .
Old-school whales — the very early adopters and miners holding the OG wallets — are quietly selling, while institutional heavyweights sweep in to buy every dip (part of the reason why lately every breakout never breaks out).
Over the past year, these OG whales have shed about half a million Bitcoin — worth north of $50 billion — according to data from 10x Research. And guess who’s gobbling it all up? ETFs, corporate treasuries, and family offices that didn’t want anything to do with crypto five years ago.
Is it bullish? Is it bearish? Is it just Bitcoin being Bitcoin? Let’s pull up the charts, squint at the data, and see what the world’s most famous digital coin might be plotting next.
📈 A Record High — And Now What?
So here’s the setup. Bitcoin has been strutting under its record high of $111,000 for months now. You’d think the hype machine — from Trump’s pro-crypto administration, to corporate balance sheets going full Michael Saylor (looking at you, GameStop NYSE:GME ) — would send BTC blasting past the Moon and landing on Mars.
Instead? It’s just... chilling. Volatility’s drying up like the last drop of liquidity in a summer Friday session. And the reason is surprisingly simple: the massive handover happening between big, anonymous early adopters and the suit-and-tie institutional crowd.
😌 From Wild Ride to Easy Cruising?
You could argue this is exactly what Bitcoin needs: maturity, respectability, less drama. But don’t tell that to the day traders who want 20% swings before breakfast. As these whales get out and institutions get in, analysts say the upside could be capped at a chill 10% to 20% a year.
Good news for your retirement portfolio, maybe not so great for that “Lambo by Labor Day” dream.
Institutions now hold about 25% of all Bitcoin in circulation — and once these get in, they tend to sit tight for years.
🚀 The $1.1 Billion Time Capsule
Speaking of whales: ever wonder what happens when a Bitcoin wallet goes dark for 14 years? It pops back online to make your mind melt.
On April 3, 2011, a wallet labeled “1HqXB...gDwcK” moved 23,377 BTC to three addresses. At the time, Bitcoin was worth a mere 78 cents. Fast forward: two of those receiving wallets, each with 10,000 BTC, sat dormant for over a decade.
This month, both wallets moved their treasure troves — worth over $1.1 billion each — within 30 minutes of each other. Talk about a coordinated exit. What’s behind the move? Tax planning? A lost key finally found?
A savvy crypto thief who figured how to crack the earliest key generation method? We may never know. Also, OG guy, if you’re reading this — props for the all-at-once move without even a test transaction.
⛓️ What Onchain Data Says
Onchain data is like reading tea leaves for nerds with Bloomberg terminals. It says the supply is tightening — not because there’s less Bitcoin, but because fewer coins are actually available to trade.
When long-term holders move coins, that typically signals big-picture changes. Here’s the twist: the net effect has been… stability. Institutional demand, like Bitcoin exchange-traded funds , soaks up supply just as fast as whales drip it back in.
That’s why Bitcoin’s been stuck in this $100K–$110K limbo, ping-ponging while the accumulation phase is still going strong.
👀 So, Is a New Leg Up Coming?
This is where the optimists and realists start to bicker over the charts. On the one hand, the structural handover to institutions makes Bitcoin more credible, more regulated, and more boring.
But less volatility can mean steadier gains — especially if you believe that the world will always want an inflation hedge that no central bank can print into oblivion.
On the other hand, a sideways market can test your patience more than a typical drawdown. Some of the whales are gone, the suits have arrived, and the easy moonshots might not be so easy anymore.
🌱 The Trade-Offs of Growing Up
Bitcoin was born in the wild west of finance — an anonymous, volatile, meme-fueled phenomenon. Now, it’s drifting deep into the mainstream. That might limit the fireworks, but it also locks in its place as an asset class that’s not going away.
🌊 Closing Thoughts: The Next Billion-Dollar Move
Will we see another $7,800 investment turn into a cool $1 billion? Maybe not exactly like that. But the game isn’t over — it’s just evolving.
Keep your eyes on the whales, the ETFs, the Fed’s next move , and those onchain breadcrumbs.
Over to you , chart-watchers: does this calm consolidation make you bullish, bearish, or just plain bored? Share your thoughts in the comments!
111.65 against 105KMorning folks,
So we've got great entry with our H&S but it is early to relax. To avoid long explanations - BTC has to stay above 105K lows to keep current tendency valid. So, if you still plan to buy BTC here - you do not need to watch for too deep standing Fib levels.
If BTC will still drop below 105K, we could get extended downside action to 100K and maybe even deeper.
Nearest upside target with our current plan is 111.65K.
Bitcoin - Will Bitcoin record a new ATH?!Bitcoin is above the EMA50 and EMA200 on the four-hour timeframe and is in its medium-term ascending channel. Maintaining the specified support area will lead to the continuation of Bitcoin’s upward path and recording a new ATH. If it is corrected, we can look for Bitcoin buying positions from the specified demand zones.
It should be noted that there is a possibility of heavy fluctuations and shadows due to the movement of whales in the market and compliance with capital management in the cryptocurrency market will be more important. If the downward trend continues, we can buy within the demand area.
In recent days, Bitcoin has been stabilizing in a price range of around $107,000, with the market simultaneously witnessing a combination of short-term volatility and massive accumulation by institutional investors. A close examination of Bitcoin’s fundamental parameters shows that the market has entered a different phase than in the past; one that is no longer driven solely by momentary excitement, and that structured capital flows and on-chain data have formed its main axis. At the forefront of this trend are Bitcoin spot investment funds (Bitcoin ETFs), which reached their highest level of capital inflows in June. Total net inflows of these funds reached more than $4.5 billion last month, and on some days even approached more than $1 billion. Funds such as BlackRock’s IBIT and Fidelity’s FBTC now have billions of dollars in assets under management, a clear sign of increasing institutional participation in the Bitcoin market. These institutional investors are accumulating Bitcoin not with a short-term view, but with a long-term view and through legal means, which has reduced selling pressure and increased market stability.
On the other hand, the data from Anchin clearly shows that the market is in a steady accumulation trend. The amount of old Bitcoins held for more than 8 years experienced a significant growth of 5% in the second quarter of 2025. This statistic shows that long-term investors are not only reluctant to sell, but are still accumulating their assets. Also, the MVRV ratio, which indicates the relative profit or loss of the market, has decreased from 2.29 to 2.20, indicating mild and controlled profit taking by some investors, rather than widespread selling pressure or general panic. This rational behavior is a sign of market maturity and investors’ intelligence in managing short-term profits.
On-chain activity data also shows a similar trend. The average daily active addresses have reached around 1.02 million, indicating a decrease in market inflammation while maintaining overall dynamism. Other indicators such as Liveliness and Whale Accumulation also confirm that the amount of old transaction traffic has decreased and whales are mainly accumulating, not supplying. This trend is very valuable, especially in a market that has been far from explosive growth. From a macro perspective, the Bitcoin market is clearly in a consolidation and accumulation phase, but this consolidation is based on much stronger foundations than in previous periods. Institutional capital inflows via ETFs have reached over $50 billion, providing a strong foundation for continued growth. Also, some very old wallets that have been inactive for nearly 14 years have recently woken up and moved around $2 billion worth of Bitcoin. Although this could be a sign of potential supply, the market has not yet seen a significant negative reaction to it in the current market conditions and the market remains cautious.
Analysts believe that Bitcoin is in the third phase of its bullish cycle after the halving, which could bring gains of more than 120%. Some forecasts suggest a price range of $200,000-250,000 by the end of this year; however, the realization of such levels is subject to stable macroeconomic data, ETF performance and the absence of severe geopolitical shocks.
Finally, it can be said that the Bitcoin market has now reached a maturity where even periods of consolidation tend to strengthen its fundamentals rather than weaken the market. High-powered institutional investors are entering, whales continue to accumulate instead of selling, and long-term investors also see a bright outlook for the coming months. In this phase, price levels of $125,000 to $140,000 are likely by the end of the summer if the current trend continues, while in the event of severe economic or political pressures, key support for Bitcoin will be in the $95,000 to $100,000 range. Overall, Bitcoin is moving slowly but steadily towards higher targets, with stronger support than at any time in its history.
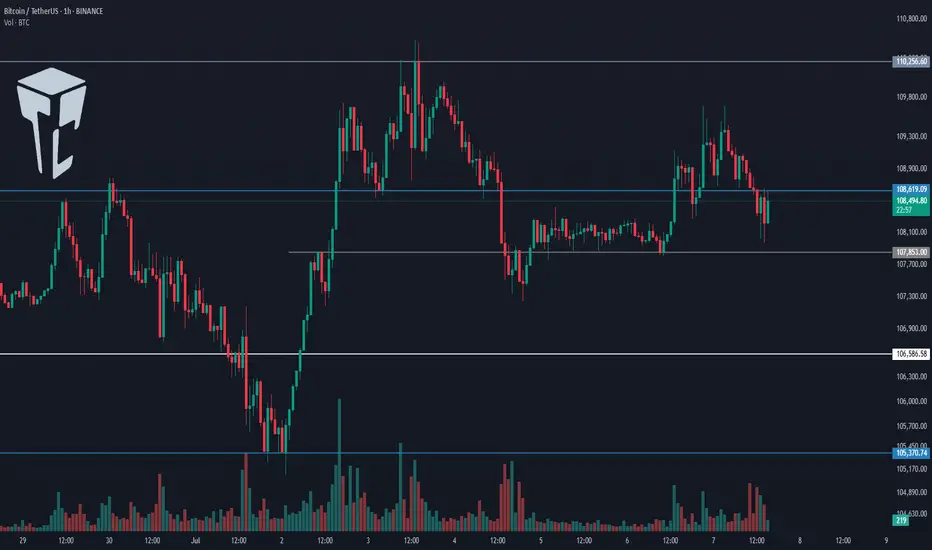
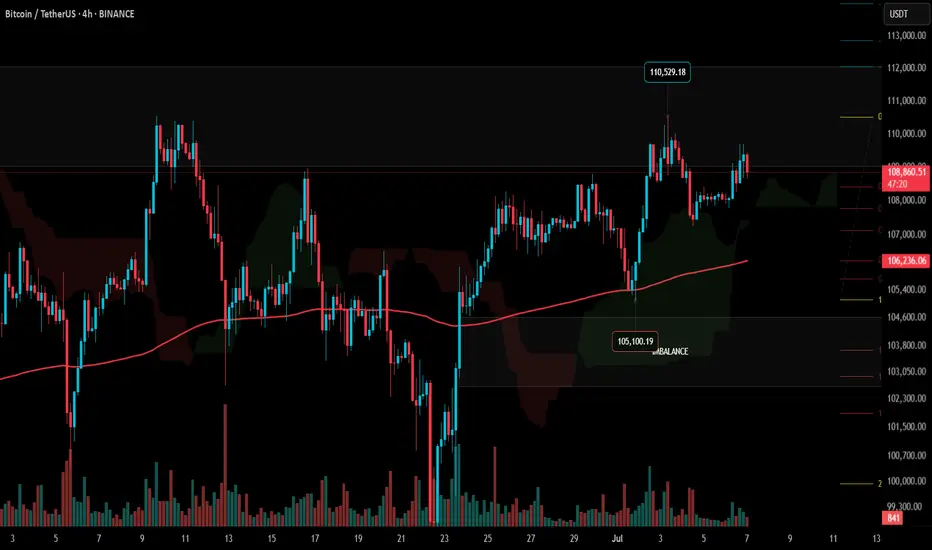
#BTC Update #4 – July 7, 2025🟠 #BTC Update #4 – July 7, 2025
Bitcoin has been trading inside a supply zone , and its last impulsive move happened right into that area. While it tried to push higher again, I now see signs of rejection.
If this rejection holds, the first level I’m watching is $107,850 . Below that, there's a key support around $106,350 . Should this level break, we could see a deeper drop toward $102,650 , where an imbalance zone remains untested.
At the moment, short setups look more reasonable than longs but from a risk/reward perspective, I don’t see enough edge to take action yet. So for now, I’m not entering any position and will simply watch BTC’s next move .
Bitcoin H4 | Rising into a swing-high resistanceBitcoin (BTC/USD) is rising towards a swing-high resistance and could potentially reverse off this level to drop lower.
Sell entry is at 111,747.48 which is a swing-high resistance that aligns with a confluence of Fibonacci levels i.e. the 78.6% projection and the 127.2% extension.
Stop loss is at 113,000.00 which is a level that sits above a confluence of Fibonacci levels i.e. the 100% projection and the 161.8% extension.
Take profit is at 108,698.22 which is an overlap support.
High Risk Investment Warning
Trading Forex/CFDs on margin carries a high level of risk and may not be suitable for all investors. Leverage can work against you.
Stratos Markets Limited (tradu.com ):
CFDs are complex instruments and come with a high risk of losing money rapidly due to leverage. 63% of retail investor accounts lose money when trading CFDs with this provider. You should consider whether you understand how CFDs work and whether you can afford to take the high risk of losing your money.
Stratos Europe Ltd (tradu.com ):
CFDs are complex instruments and come with a high risk of losing money rapidly due to leverage. 63% of retail investor accounts lose money when trading CFDs with this provider. You should consider whether you understand how CFDs work and whether you can afford to take the high risk of losing your money.
Stratos Global LLC (tradu.com ):
Losses can exceed deposits.
Please be advised that the information presented on TradingView is provided to Tradu (‘Company’, ‘we’) by a third-party provider (‘TFA Global Pte Ltd’). Please be reminded that you are solely responsible for the trading decisions on your account. There is a very high degree of risk involved in trading. Any information and/or content is intended entirely for research, educational and informational purposes only and does not constitute investment or consultation advice or investment strategy. The information is not tailored to the investment needs of any specific person and therefore does not involve a consideration of any of the investment objectives, financial situation or needs of any viewer that may receive it. Kindly also note that past performance is not a reliable indicator of future results. Actual results may differ materially from those anticipated in forward-looking or past performance statements. We assume no liability as to the accuracy or completeness of any of the information and/or content provided herein and the Company cannot be held responsible for any omission, mistake nor for any loss or damage including without limitation to any loss of profit which may arise from reliance on any information supplied by TFA Global Pte Ltd.
The speaker(s) is neither an employee, agent nor representative of Tradu and is therefore acting independently. The opinions given are their own, constitute general market commentary, and do not constitute the opinion or advice of Tradu or any form of personal or investment advice. Tradu neither endorses nor guarantees offerings of third-party speakers, nor is Tradu responsible for the content, veracity or opinions of third-party speakers, presenters or participants.

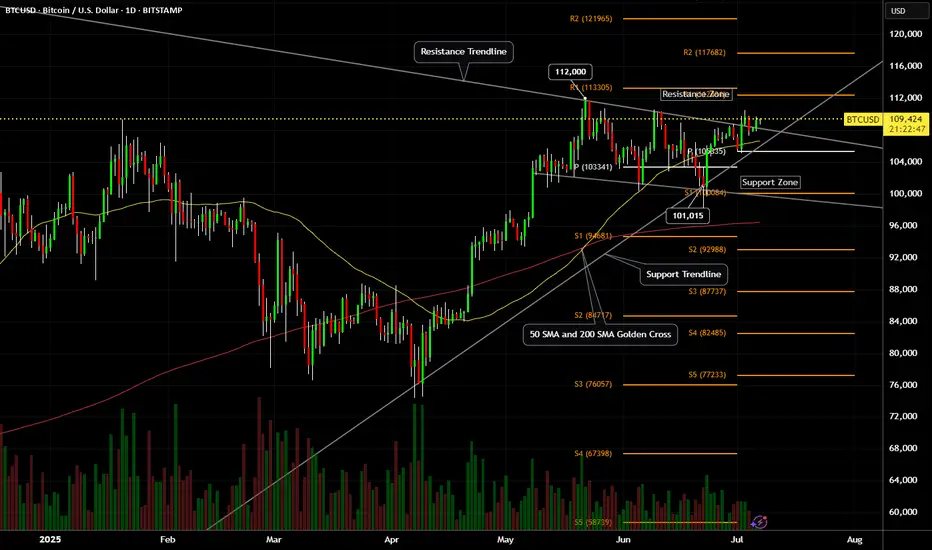
Bitcoin (BTCUSD) - Daily Price Uptrend, Resistance Breakout TestBitcoin (BTCUSD) has been in a recent Daily price Uptrend, rallying up from the $100,000 price support level.
A SMA Golden Cross printed on May 21st, 2025.
Bitcoin price is attempting a resistance zone test and has yet to breakout and hold above the $111,000 to $112,000 price zone.
Resistance levels: $110,000 , $112,000 , $117,000 , $121,000.
Support levels: $108,000 , $107,000 , $105,000 , $104,000 , $100,000.
Recent crypto industry, government legislation news, and institutional crypto purchases have helped to keep Bitcoin price above $100,000 support.
Stock market correlation volatility could also affect the crypto market and prices for the next 30 to 45 days.
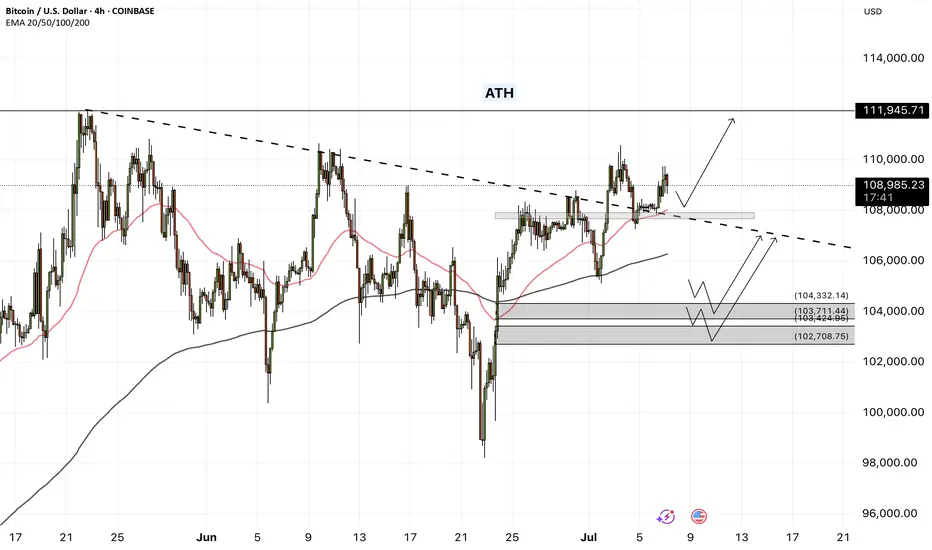
Bitcoin BTC Trade Plan: Watching for Breakout or Pullback Entry📊 Currently watching BTC (Bitcoin) as price action remains bullish overall, but we're approaching a key decision point 🎯
💹 Price is pushing higher, but with some signs of exhaustion after the recent rally ⚠️ — and with the weekend approaching, we could either see a continuation higher or a healthy pullback
I’m keeping an eye on two potential trade scenarios:
1️⃣ A break and clean retest of the recent high, which could offer a continuation long if momentum follows through 🚀
2️⃣ A retracement into equilibrium — a deeper pullback toward fair value 📉 — which could also present a high-probability long setup if confirmed with structure and reaction 📈
Either way, I’m letting the market reveal its hand and waiting for one of these setups to play out before committing 💡
💬 Not financial advice — always assess your own risk and confirm with your own analysis.

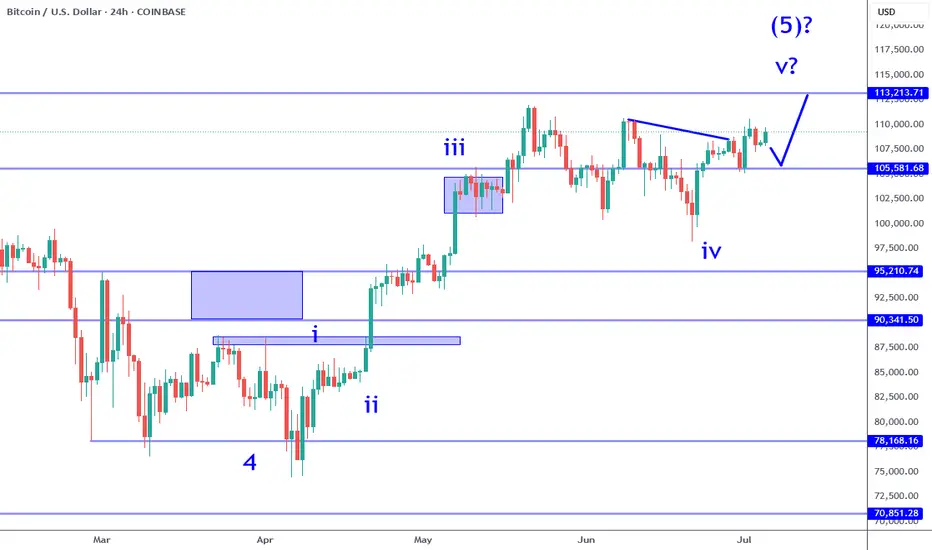
Bitcoin: Breakout To 113K Refuses To Pull Back.Bitcoin is poised to test the 113K resistance over the coming week. It has broken the upper trend line resistance and simply refuses to retrace in any meaningful way. With a continuously weakening dollar and other economic inflationary pressures, it will take a surprise negative catalyst to turn this around at least to the point of testing a high probability trend support on this time frame. Here is the way to play this environment:
Buying this breakout for time horizons longer than a swing trade requires a big risk tolerance. While this leg is likely to be the Wave 5 of 5 that I have been writing for some time and can see Bitcoin test some major new highs, investing here still puts you at the mercy of the market. The nearest support is around the 103 to 105K area at minimum and just not worth the risk in my opinion at current levels for INVESTING.
Swing trades are a great way to participate in the breakout continuation. Risk can best be defined by the current candle low or previous candle low. Profit objective now is 113K or 120K area. The Trade Scanner Pro actually called a long and offered numerous opportunities to enter over a week and a half ago. I have been reviewing this regularly on my live stream forecast every Monday at 3 PM ET. It helps immensely to have levels and risk defined for these type of situations in advance so that you know how to adjust your size.
Otherwise the optimal way to go about this is trade the smaller time frames. I will always suggest this near highs and breakouts on larger time frames. The reason is simple: risk can be tightly controlled. This requires some kind of rules or guidelines to judge the market, along with a way to confirm. Using the Trade Scanner Pro for example, the analysis component is easy: trend is bullish on all small time frames. This means you wait for a trade suggestion on the time frame that you regularly trade (1 min or 5 min f or example).
No matter what type of trend following system or rules you use, by aligning with the bigger picture and confirming a setup in some way is what puts the probabilities on your side. The smaller the time frame you operate, the more precise your risk management can be.
Thank you for considering my analysis and perspective.
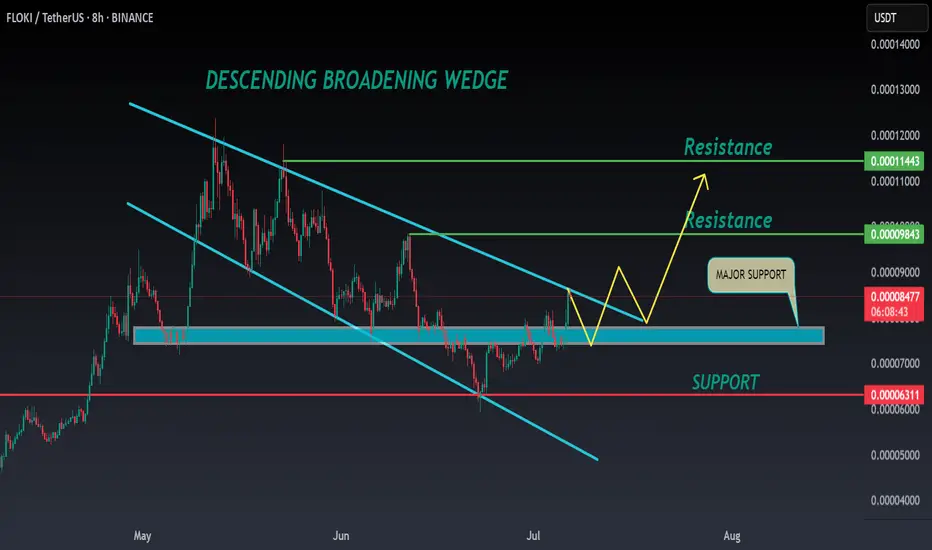
FLOKI ANALYSIS🔮 #FLOKI Analysis 🚀🚀
💲💲 #FLOKI was trading in a Descending Broadening Wedge Pattern, and trying to breakout the pattern. Also there is a instant support zone and after the breakout of resistance zone we will see a bullish move. 📈📈
💸Current Price -- $0.00008540
📈Target Price -- $0.00009840
⁉️ What to do?
- We have marked crucial levels in the chart . We can trade according to the chart and make some profits. 🚀💸
#FLOKI #Cryptocurrency #Breakout #DYOR
TradeCityPro | Bitcoin Daily Analysis #120👋 Welcome to TradeCity Pro!
Let’s dive into the Bitcoin analysis and key crypto indices. As usual, in this analysis I want to review the futures triggers for the New York session.
⏳ 1-Hour Timeframe
In the 1-hour timeframe, as you can see, Bitcoin has finally broken out of the range it formed yesterday and is now moving upward.
✔️ If this upward move continues, we can open a long position in these zones by getting confirmation in the lower timeframes. The main long trigger is still activated after breaking 110256.
💥 The RSI oscillator entered the Overbuy zone in the previous candle. We need to see how the price reacts to this move and what impact this oscillator will have on the price.
⚡️ In my opinion, this RSI move won't have much impact. Although the price is moving upward, the main trend has not yet formed, so there's no real momentum in the market, and RSI is basically useless for now.
✨ If this upward move turns out to be fake, we can enter a short position with the 107853 trigger.
👑 BTC.D Analysis
Let’s look at Bitcoin Dominance. Yesterday, dominance had an upward move and broke its ascending trendline but failed to stabilize above 65.52, resulting in a fake breakout and a move downward.
☘️ The fake breakout trigger for the trendline was the 65.38 zone, which was activated, and now the price is heading downward. If this move continues, the next target will be 65.04.
📅 Total2 Analysis
Alongside Bitcoin’s upward move, this index also activated the 1.14 trigger and is moving up, now reaching 1.15.
💫 If the move continues, the next entry trigger is at 1.17, which is still quite far from the current price.
📅 USDT.D Analysis
Looking at Tether Dominance, the 4.82 trigger was activated, and dominance is now moving down, having reached 4.78.
📈 If it stabilizes below 4.78, we can confirm the continuation of the downtrend in dominance, which could push it down to 4.72.
❌ Disclaimer ❌
Trading futures is highly risky and dangerous. If you're not an expert, these triggers may not be suitable for you. You should first learn risk and capital management. You can also use the educational content from this channel.
Finally, these triggers reflect my personal opinions on price action, and the market may move completely against this analysis. So, do your own research before opening any position.
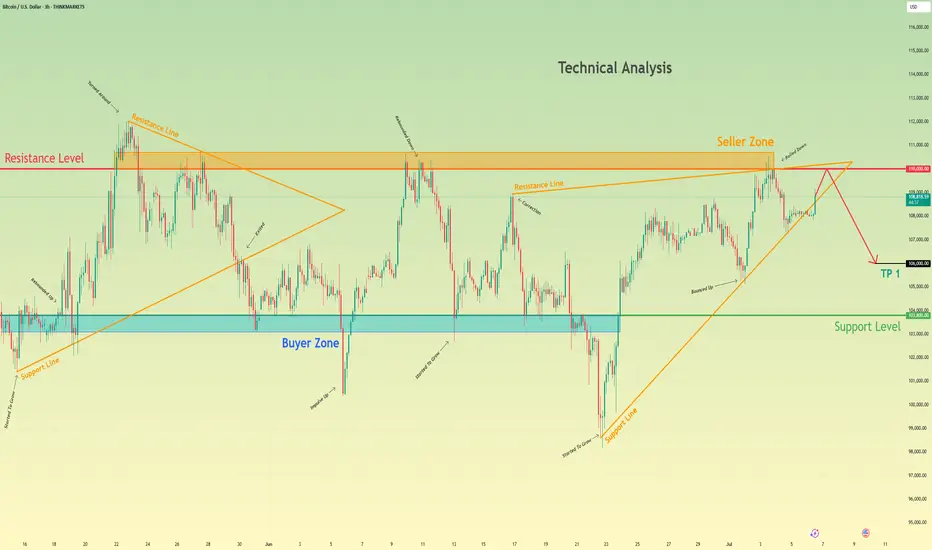
Bitcoin can rebound from resistance level and start to declineHello traders, I want share with you my opinion about Bitcoin. Recently, the price broke above a local resistance and quickly approached the key resistance level at 110000, which also aligns with the upper boundary of the seller zone (110000 - 110700 points). This area has already proven its strength multiple times, causing sharp rejections in the past. Moreover, the price has tested it again recently and failed to break through. In addition, we can see a triangle structure, which fits the logic of a pennant pattern after a bullish wave. However, the latest move upward has already lost momentum near the apex, and the price is now trading just under the upper edge of this formation. That makes this zone technically overloaded and vulnerable to a downside reversal. Based on this, I expect Bitcoin to test the resistance level one more time and then roll back down toward TP 1 at 106000 points, a zone near previous liquidity accumulation and a local consolidation range. If selling pressure increases, the price might aim for the buyer zone (103800 - 103100). Given the current rejection at resistance, the structure of the triangle, and the reaction inside the seller zone, I remain bearish and expect further decline toward the support. Please share this idea with your friends and click Boost 🚀
Disclaimer: As part of ThinkMarkets’ Influencer Program, I am sponsored to share and publish their charts in my analysis.