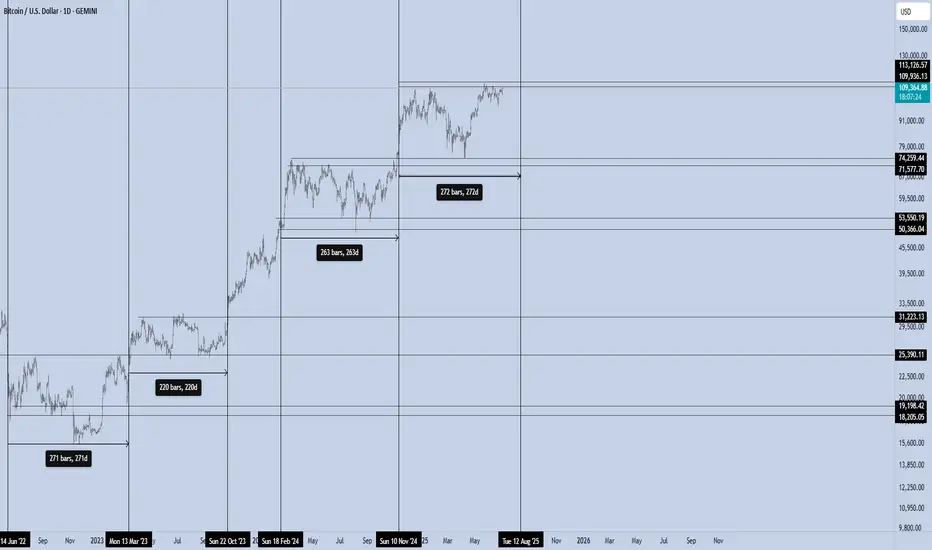
Bitcoin – The 270/100 CycleBitcoin isn’t just trading. It’s pulsing — in cycles that reward those who understand timing as much as price.
Over the last two years, BTC has shown a repeating pattern with surgical precision:
Range Phase:
Each macro consolidation lasts ~220 to 270 days, where price builds structure, absorbs supply, and prepares for its next expansion. This is the quiet phase — the zone where conviction is tested, and weak hands exit.
Impulse Phase:
What follows is a ~100-day vertical leg, where BTC surges between +50% to +80%, targeting the next macro resistance. We’ve seen this repeatedly:
Accumulate → Expand → Re-accumulate → Expand.
Bitcoin (Cryptocurrency)
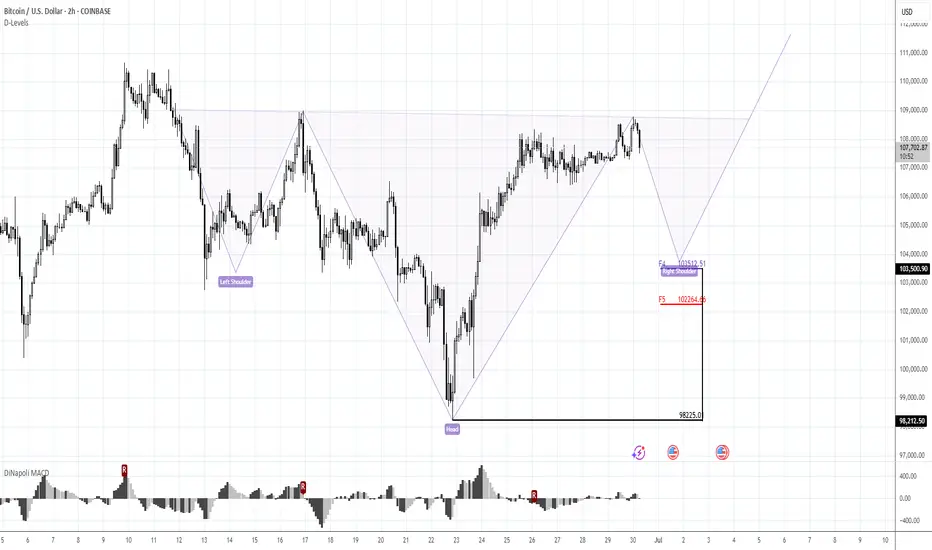
Wait for something more reliableMorning folks,
Since our last update action was anemic. Nothing has changed seriously. BTC was able to show just minor upside action. Based on current performance, I do not want to take long position right here and prefer to wait for something more reliable. Because BTC action stands rather different from the one that we expected to see.
For example it might be H&S pattern on 1H chart. Thus, an area around 103K seems the one that we will keep an eye on.
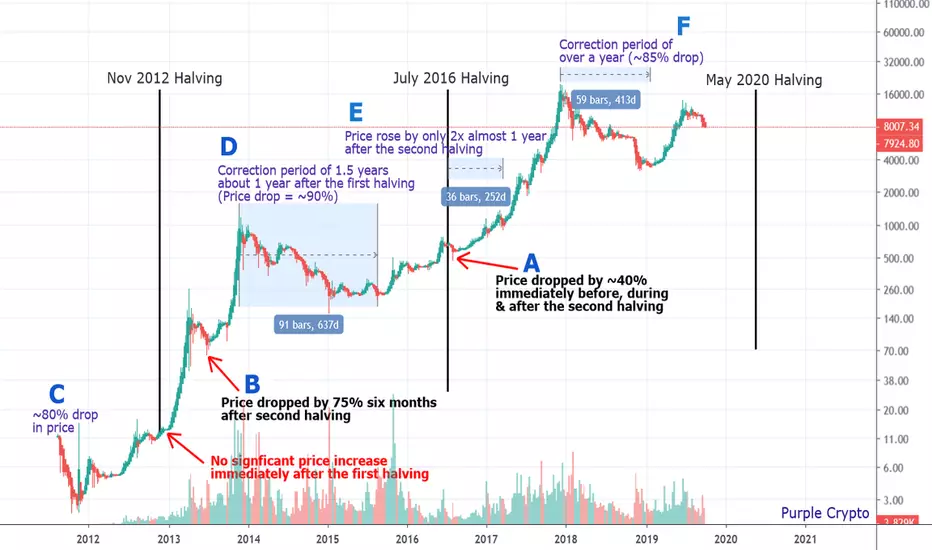
Bitcoin Halving DemystifiedI was recently asked of my opinion on how I could possibly come up with a Papa Bear Projection Chart where the correction period takes over a year long - one that takes us well into next year, and into and over the next Bitcoin halving date of May 2020. I figured it would be easier to simply print a chart for reference.
A picture speaks a thousand words. Here's a history of Bitcoin halvings - all two of them.
A. The first and the only point pertinent to the question that was asked of me is point A - the second BTC halving which occurred in July 2016 where the price of Bitcoin dropped ~40% immediately BEFORE, DURING and AFTER it.
Need I say more? The rest of this post is for educational purposes.
B. Here, the price dropped by 75% six months after the first halving (that should have said first on the chart).
C. A drop in price of approximately 80% in its early days (11.85 to 2.22) and one year before the first halving.
D. A correction period of over 1.5 years where the price dropped by about 90% between the two halvings (1163 to 152).
E. The price rose by 100% one year after the second halving. As an analogy, in today's terms, it would rise from 3000 to 6000 or 8000 to 16000 one year after the next halving (I'm not saying this is what will happen).
F. A correction period of over a year where the price dropped by ~85% (~20000 to ~3000).
Bitcoin has had more elongated correction periods and FAR MORE drops in price than it has had halvings. A third correction period of over a year or another drop in price is neither an abnormality nor a deviation from the "norm".
I guess the only reason I can think of as to why people think my projection seems so absolutely absurd is because they be dreamin' of owning Maseratis and Mansions and they be wantin' it now.
Do I think halvings have anything to do with the price of Bitcoin (all one of the two halvings which had no significant correlation, where the price did not increase immediately after the halving and only increased months later in line with the trend it was in prior to the halving)? None whatsoever.
Do I expect the price of Bitcoin to increase in the future? Yes, but only after it corrects.
What is clear from this chart is that BTC, just like any other stock or crypto, goes through cycles.
I can't predict when the corrections will end but I can forecast where it will likely finish based on its cycle and technical analysis, and that is what I am most concerned with at Purple Crypto Premium.
Adios amigos.
What goes up must come down.
My Secret Papa Bear Chart
It Played Out Like a Beautiful Melody
Are We Ready for the Crash?
Are We There Yet?
What If It Goes Down? Future Projection
___________________________
There's only one person you need to follow when it comes to crypto.
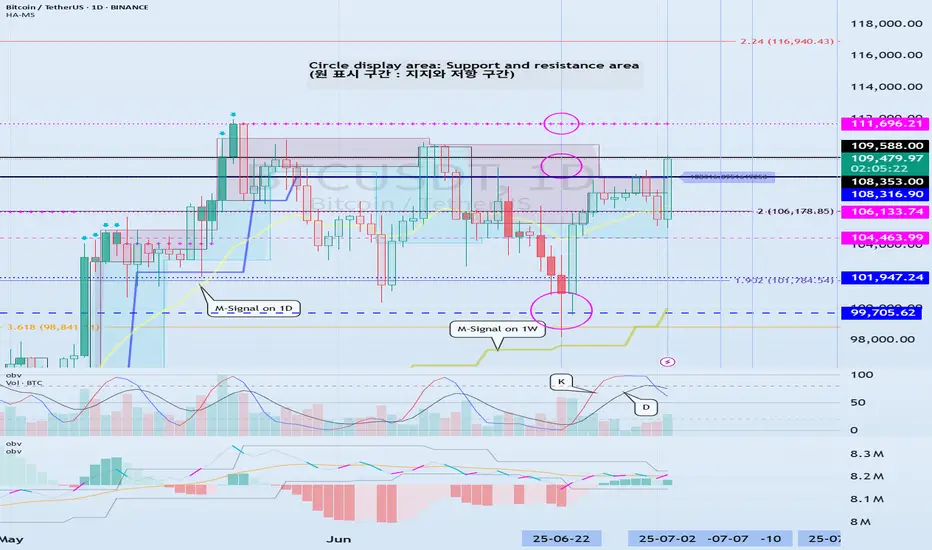
Check support at 108316.90-111696.21
Hello, traders.
If you "Follow", you can always get new information quickly.
Have a nice day today.
-------------------------------------
(BTCUSDT 1D chart)
Among the many trend lines, the one marked 1W is the important one.
Therefore, we need to look at whether it can rise above the 1W trend line or rise along the trend line.
If not, and it falls below 108316.90, it may lead to further decline, so we need to think about a countermeasure for this.
This volatility period is expected to continue until July 3, but it is expected to last until July 11, so caution is required when trading.
-
Indicators that indicate high points are DOM(60), HA-High, and StochRSI 80.
HA-High and StochRSI 80 are formed around 108316.90, and DOM(60) is formed at 111696.21.
Therefore, the 108316.90-111696.21 section is a high point boundary section, and if it is supported and rises in this section, it is highly likely that a stepwise uptrend will begin.
The conditions for a stepwise uptrend to begin are:
- The K of the StochRSI indicator must show an upward trend below 80,
- The PVT-MACD oscillator indicator must show an upward trend above the 0 point,
- The OBV of the Low Line ~ High Line channel must show an upward trend. If possible, it is better for the Low Line ~ High Line channel to form an upward channel.
When the above conditions are met, I think that if it is supported and rises in the 108316.90-111696.21 section, it is highly likely that a stepwise uptrend will continue.
If the above conditions are not met, it is likely that it will show a downward trend again while pretending to rise.
-
Thank you for reading to the end.
I wish you successful trading.
--------------------------------------------------
- This is an explanation of the big picture.
(3-year bull market, 1-year bear market pattern)
I will explain more details when the bear market starts.
------------------------------------------------------
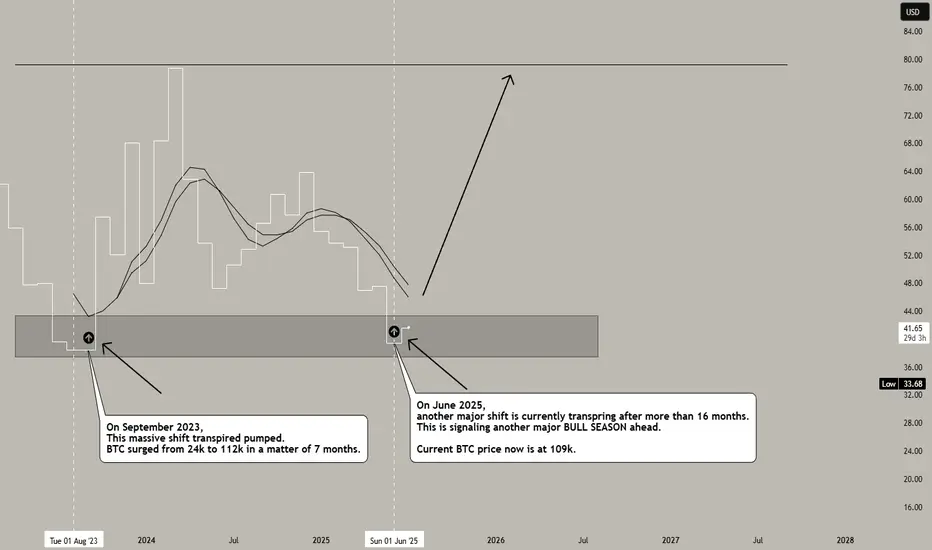
BVIV major BULL season ahead, BTC (from 106k) and ALTS ↑↑↑BVIV volatility index is a major confluence that 99% don't look at. Proof of this is there are only 3 posts about it, and one of them is mine lol. This is the 4th one. So you know its special.
This btc index is a major predictor of the market. When this shifts majorly, the whole market gets magnetized by it in massive scale.
Based on the current long term metrics. BVIV is hinting of another monster shift. It took 16 months for this signal to resurfaced. Last one was from September 2023, where BTC surge from 24k to 112k in 7 months. And as of this writing, June 2025 another big shift is transpiring after 16 months of long wait -- conveying another major ascend ahead in the next coming months.
Ideal seeding season is now -- you cant miss out because this change in structure doesnt come often. When this shows up, YOU SHOW UP. :)
Expect some weighty rise on the next few seasons. Market will be very very generous.
Spotted at 106k btc / 2400 eth.
Targets: Sky is the limit.
TAYOR.
Trade safely.
Not financial advice.
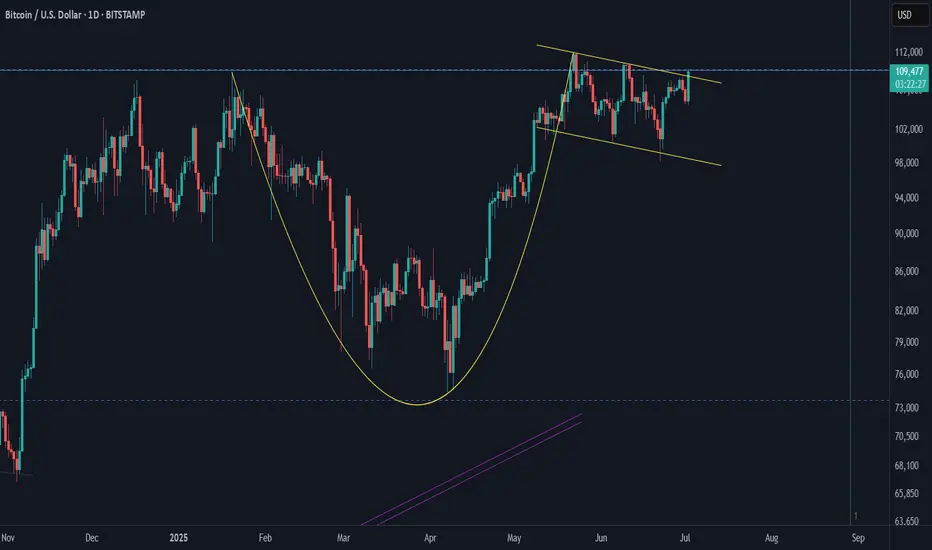
Bitcoin Upward Waves vol 2Continuing from the previous Bitcoin analysis:
Bitcoin is trying to break the Handle upward. If successful, that means the Cup and Handle pattern is confirmed. Next, have to wait for Bitcoin to go up and finish the pattern. How far can Bitcoin rise? Let's see what happens.
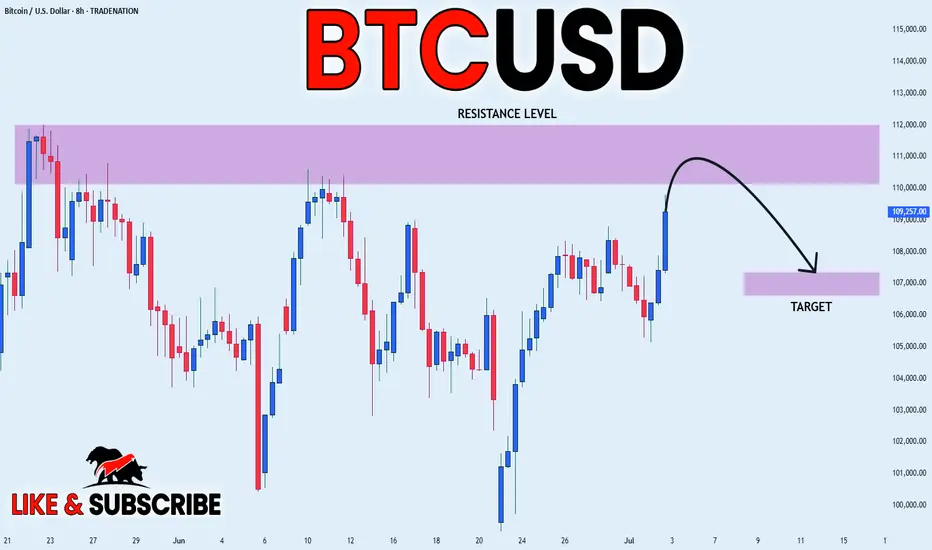
BITCOIN STRONG RESISTANCE AHEAD|SHORT|
✅BITCOIN is going up now
But a strong resistance level is ahead at 112,000$
Which is also an All-Time-High
Thus I am expecting a pullback
And a move down towards the target of 107,300$
SHORT🔥
✅Like and subscribe to never miss a new idea!✅
Disclosure: I am part of Trade Nation's Influencer program and receive a monthly fee for using their TradingView charts in my analysis.
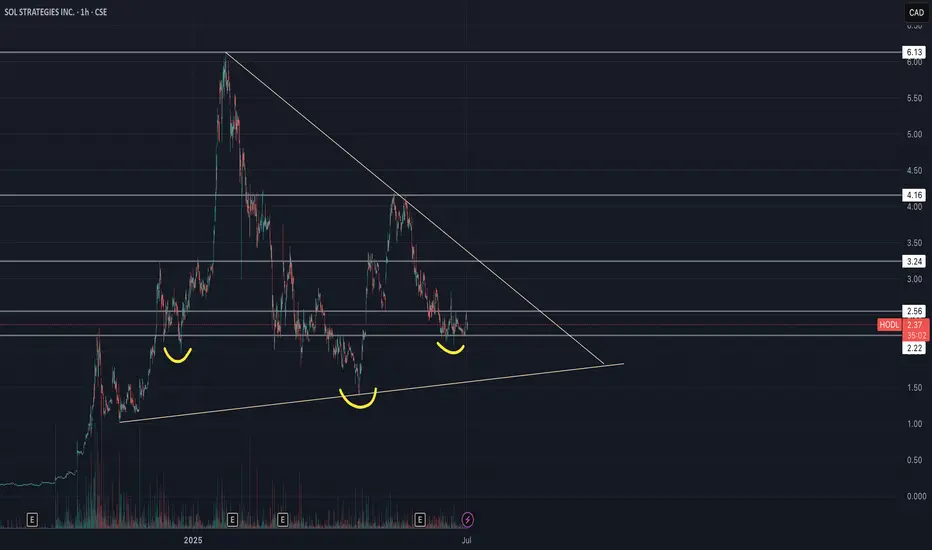
Sol Strategies Inc (HODL) - Inverse H&S🚀 SOL Strategies (HODL) – Public Market Gateway to Solana Yield
SOL Strategies (CSE: HODL) is a publicly traded company laser-focused on the Solana ecosystem. With nearly 395,000 SOL held (most of it staked) and over 3.7 million SOL delegated to their validators, they generate consistent income through staking rewards and validator commissions.
Their business model is simple:
📌 Accumulate SOL → Stake it → Run institutional-grade validators → Earn yield
📌 Expand through partnerships (3iQ, Neptune, BitGo, Pudgy Penguins)
📌 Hold strategic Solana ecosystem tokens like JTO and jitoSOL
📌 Operate with SOC 2-certified infrastructure and pursue a Nasdaq listing
SOL Strategies is not just holding crypto – they are building core infrastructure for Solana, giving equity investors direct exposure to staking economics in one of the fastest-growing blockchain networks.
📊 For traders: HODL stock offers a pure-play vehicle for Solana exposure, with an income-generating twist.
⚠️ Always do your own investment research and make your own decisions before investing.
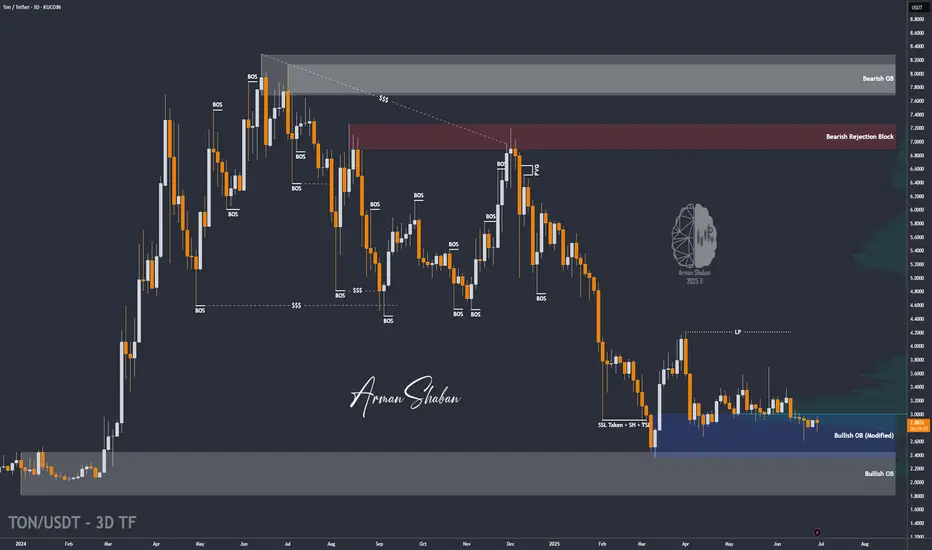
TON/USDT : Are you Bullish or Bearish? Let's Talk!By analyzing the #Toncoin chart on the 3-day timeframe, we observe that the price is still within the demand zone between $2.40 and $3.00.
If the price manages to break above the $3.10 level and hold within the next 7 days, we can expect further growth from this cryptocurrency.
The expected returns are approximately 20% in the short term, 40% to 55% in the mid-term, and up to 110% in the long term.
Please support me with your likes and comments to motivate me to share more analysis with you and share your opinion about the possible trend of this chart with me !
Best Regards , Arman Shaban
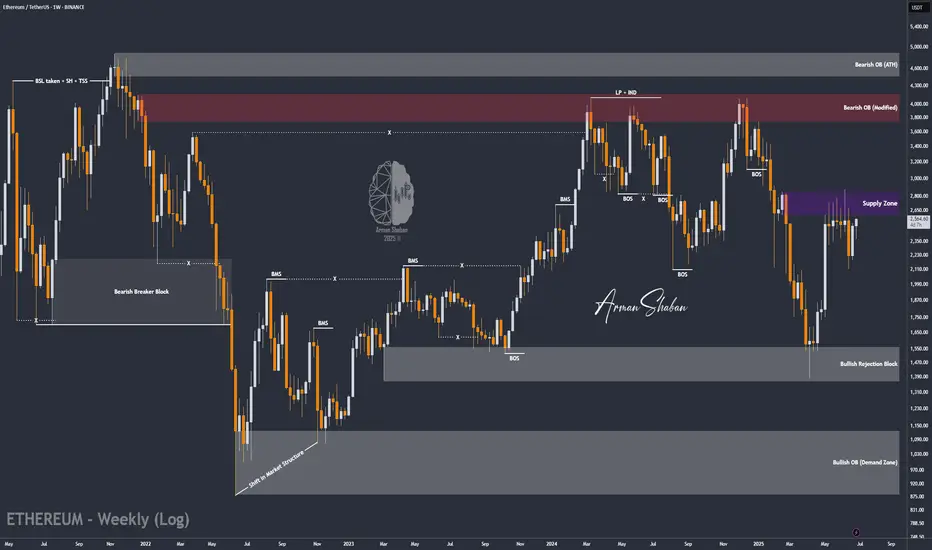
ETH/USDT : Gearing Up for a Major Breakout? (READ)By analyzing the Ethereum chart on the weekly timeframe, we can see that the price has started rising just as expected and is now approaching the first target. For now, ETH faces major resistance in the $2,600–$2,900 zone.
If price breaks above this key area, I expect a strong bullish move from Ethereum!
Based on the main analysis, the short-term targets are $2,700 and $2,890, while the mid-term targets are $3,100 and $4,100.
Please support me with your likes and comments to motivate me to share more analysis with you and share your opinion about the possible trend of this chart with me !
Best Regards , Arman Shaban
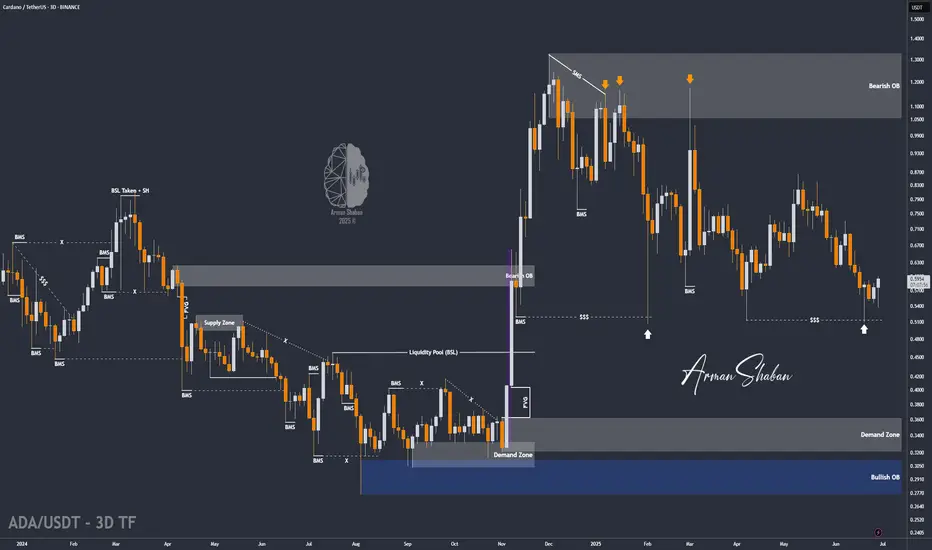
ADA/USDT : Get Ready for another Bullrun (READ THE CAPTION)By analyzing the #Cardano chart on the 3-day timeframe, we can see that the price is currently trading around $0.59. After sweeping the liquidity below $0.51, our bullish outlook for the next upward wave has strengthened significantly.
I'm now expecting a strong move from ADA, with short-term targets at $0.61 and $0.76, and longer-term targets at $0.93, $1.05, and $1.33!
Please support me with your likes and comments to motivate me to share more analysis with you and share your opinion about the possible trend of this chart with me !
Best Regards , Arman Shaban
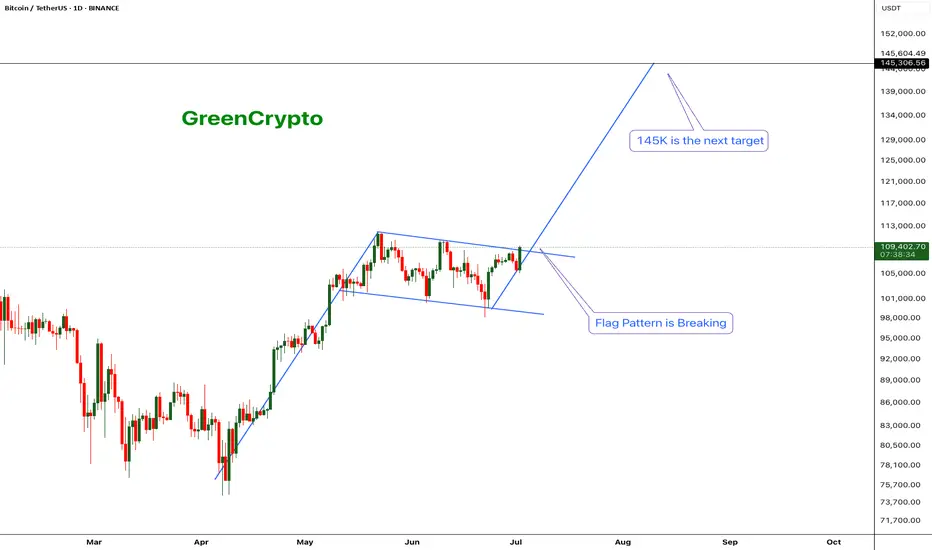
Bitcoin - Flag pattern is brokenBitcoin had been consolidating within a flag pattern for the past three months. That pattern has now officially broken to the upside, with the price surging to $109K — a strong bullish signal fueled by encouraging news around institutional adoption.
Based on both the technical flag breakout and ongoing fundamental momentum, the next target for Bitcoin is $145K. Any move beyond that would be considered a bonus in this current bull cycle.
Stay tuned for more updates.
Cheers,
GreenCrypto
BTC Weekly Analysis : Rise or Fall ? Let's SeeBy analyzing the #Bitcoin chart on the weekly timeframe, we can see that last week’s candle closed at $108,350, and BTC is currently trading around $107,500. If the price manages to hold above $105,700, we could expect further upside momentum. The next potential bullish targets are $111,700, $124,000, and $131,800.
So far, this analysis has yielded over 9% return, and we’ll be sharing more updates soon from lower timeframes!
🎥 If you enjoyed this video analysis and found it helpful, please show your support with a LIKE and COMMENT below!
These video-style breakdowns take time and effort, and I’ll only continue them with your support 🙌
Your engagement is my biggest motivation to keep going 💛
Thanks for being part of the journey!

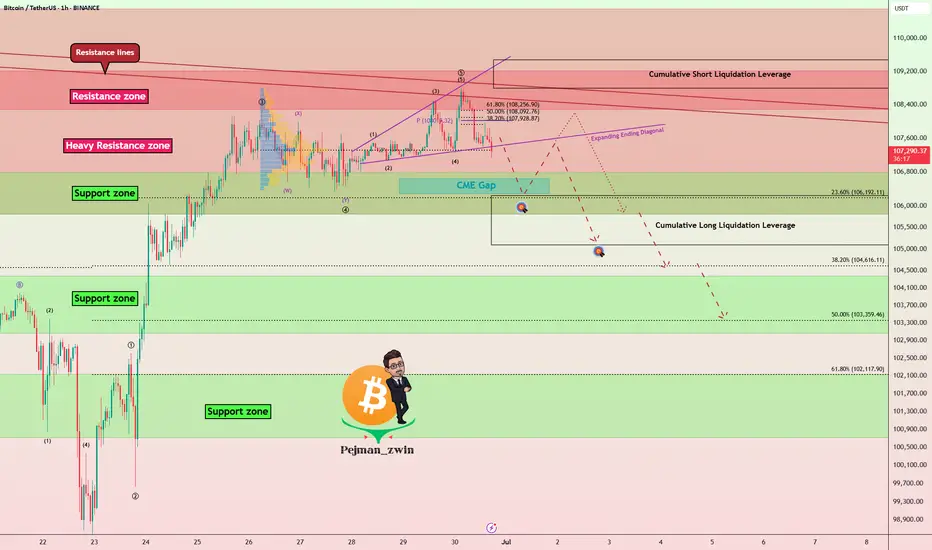
Bitcoin Breakdown? Support Zone & CME Gap in FocusBitcoin ( BINANCE:BTCUSDT ), as anticipated in my previous analysis , attacked the Resistance lines and then resumed its decline. In previous analysis, both Long and Short positions could have been profitable .
Bitcoin is approaching a Support zone($106,800-$105,820) and the CME gap($106,645-$106,295) .
From an Elliott Wave theory perspective , it appears that Bitcoin has finally completed a five-wave impulsive move with the help of an Expanding Ending Diagonal .
I expect Bitcoin to attack the Support zone($106,800-$105,820) after breaking the lower line of the Expanding Ending Diagonal .
Note: To break through the Support zone($106,800-$105,820), Bitcoin may potentially use either a Head and Shoulders pattern or a Bearish Quasimodo formation.
Note: If Bitcoin breaks the Resistance lines, we can expect more pumps.
Cumulative Long Liquidation Leverage: $106,249-$105,094
Cumulative Short Liquidation Leverage: $109,483-$108,790
Please respect each other's ideas and express them politely if you agree or disagree.
Bitcoin Analyze (BTCUSDT), 1-hour time frame.
Be sure to follow the updated ideas.
Do not forget to put a Stop loss for your positions (For every position you want to open).
Please follow your strategy and updates; this is just my Idea, and I will gladly see your ideas in this post.
Please do not forget the ✅' like '✅ button 🙏😊 & Share it with your friends; thanks, and Trade safe.
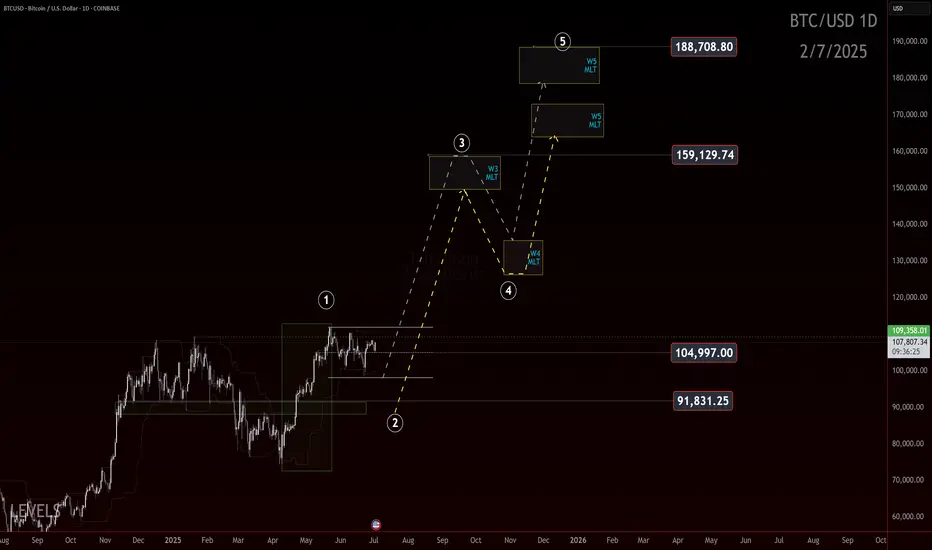
Bitcoin: 170k–180k?If you find this information inspiring/helpful, please consider a boost and follow! Any questions or comments, please leave a comment!
Bitcoin: 170k to 180k?
Let’s talk bias.
We’ve seen a powerful move off the 75k low, and it’s hitting some markers of a potential wave 1 impulse. If that structure holds and price doesn’t come back to wipe out the lows in a wave 2 retracement, then this is what we’d be looking at.
The idea? This is a conservative roadmap built off Elliott Wave Fibonacci projections and it targets the 170k to 180k zone.
Now, let’s be clear. This is a conservative projection. We’re not talking hopium fueled 250k moon targets here. We have no proof of that yet. We're anchoring the wave count and saying: if this is a 1, we’re due a 2, and then a 3 takes us to the upper levels.
But there’s a catch. Always is.
If price starts to fade back through the 91.8k area in a deep aggressive retrace, this roadmap gets less likely. Breaking the 75k pivot means the impulse structure failed or was misread, and we shift the count.
Until then, the 170k–180k level is a possible destination based on this roadmap.
Trade Safe!
Trade Clarity!
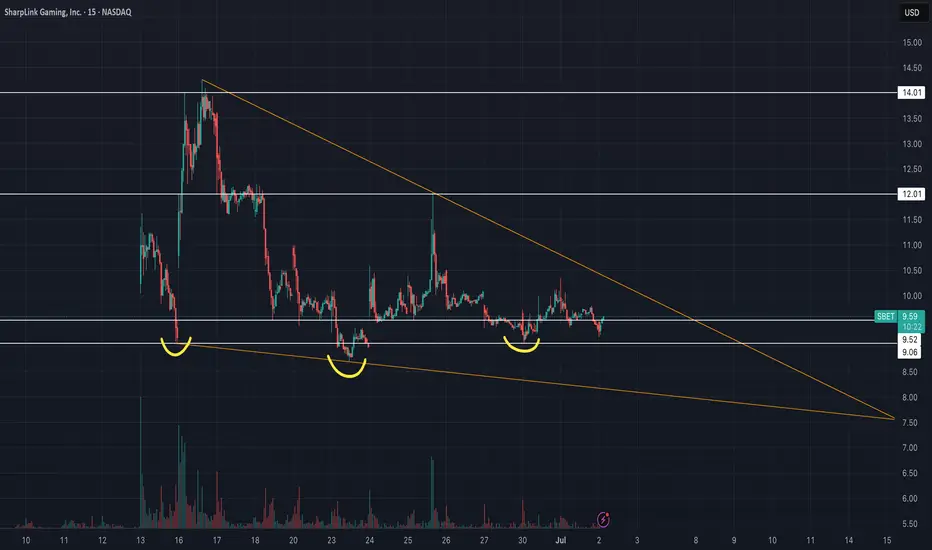
SharpLink Gaming Inc (SBET) - Falling Wedge & Inverse H&S🚀 SharpLink Gaming ( NASDAQ:SBET ) – Ethereum, Joe Lubin & a Bullish Setup
SharpLink Gaming has undergone a bold transformation: the company is now the largest public holder of Ethereum (ETH), with ~198,000 ETH acquired since June 2025. Over 95% of it is staked, already earning 200+ ETH in rewards – turning ETH into a yield-bearing treasury asset.
Driving this shift is Joe Lubin, co-founder of Ethereum and CEO of ConsenSys, who recently became Chairman of SharpLink. Under his leadership, SBET is betting big on Ethereum as “digital capital”, aiming to merge iGaming and Web3.
📊 Technical Setup:
SBET is forming a falling wedge and an inverse head and shoulders – both classic bullish reversal patterns. After a post-announcement retracement, the chart suggests growing potential for a breakout as fundamentals strengthen.
🧠 My thesis: This is MicroStrategy playbook 2.0 – but with ETH instead of BTC. SharpLink gives equity exposure to Ethereum + staking yield + visionary leadership.
🔔 Worth watching closely.
⚠️ Always do your own investment research and make your own decisions before investing.
BITCOIN FLASHING EARLY BEARISH SIGNALS!!! (Don’t get trapped) I am explaining why Bitcoin might start crashing towards $93k. If we get enough confirmations, amazing RR short opportunities might be great money-making machines !!!

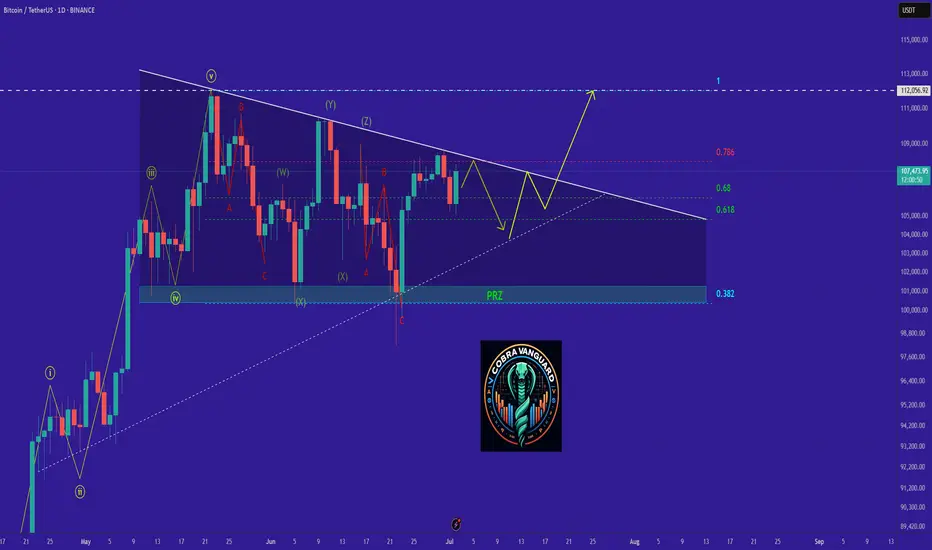
BTC's Situation, A Comprehensive Analysis !!!The situation has become quite strange. Bitcoin is forming deceptive patterns, and altcoins continue their downward trend. Currently, Bitcoin is positioned within two triangles—one symmetrical and the other descending. Now that Bitcoin has reached the top of the triangle and appears ready to break upward, it might actually be hiding yet another trap within the price action.
This market has shown disregard for technical patterns, and every time the price approaches historically significant levels, it reveals its true intentions and disappoints us. This cycle tends to repeat.
In my opinion, we’re likely to see one more drop in Bitcoin’s price. After that, instead of continuing the expected downtrend from the pattern, the price could break the descending formation and experience a strong upward move.
Stay Awesome , CobraVanguard.
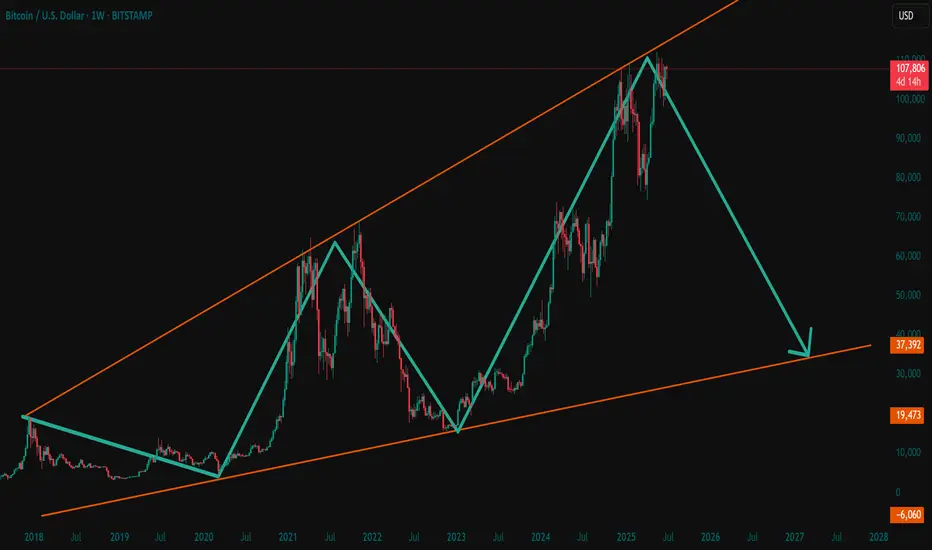
Bitcoin Faces Impending Drop to Mid-30,000sAs of July 02, 2025, Bitcoin’s price chart, crafted by "RoadToAMillionClub" on TradingView, paints a concerning picture. Currently hovering at $107,831, the cryptocurrency appears to be teetering at the edge of its upper channel, signaling potential trouble ahead. The recent 0.51% dip may be just the beginning of a more significant decline.
The long-term upward trend, marked by a supportive orange line since 2018, has been a beacon for bulls. However, the green trend line projecting a drop toward the mid-30,000s range, around $37,932, suggests a looming correction. This level, a historical support zone, could become the next battleground as selling pressure mounts.
Market indicators point to overextension, with the price hitting a 4-day and 14-day high of $107,831 before the recent pullback. The speculative fervor that drove Bitcoin to these heights seems to be waning, increasing the likelihood of a bearish turn. Investors should brace for volatility, as the cryptocurrency may struggle to maintain its current altitude, potentially sliding toward the mid-30,000s in the coming months.
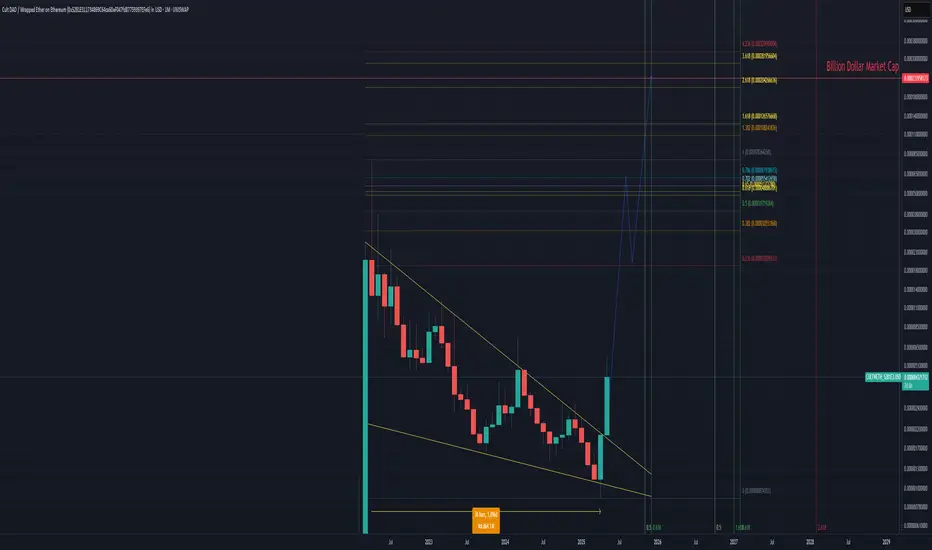
CULT DAO ON ITS WAY TO A BILLION DOLLAR MARKET CAPIf you want an in-depth look at everything CULT DAO, check out the TA below:
This is just a technical update.
A massive breakout occurred as expected. I’ve been highlighting the divergence forming in the MACD for months — it’s all detailed in the TA above.
Over the last 1,096 days, CULT DAO has formed a giant descending wedge — both in price structure and on the MACD. The path was clear.
Onwards and upwards.
A billion-dollar market cap is very possible by Q4 2025.
Breakthrough tech.
Mainnet launch around the corner.
Rocket ship loading.
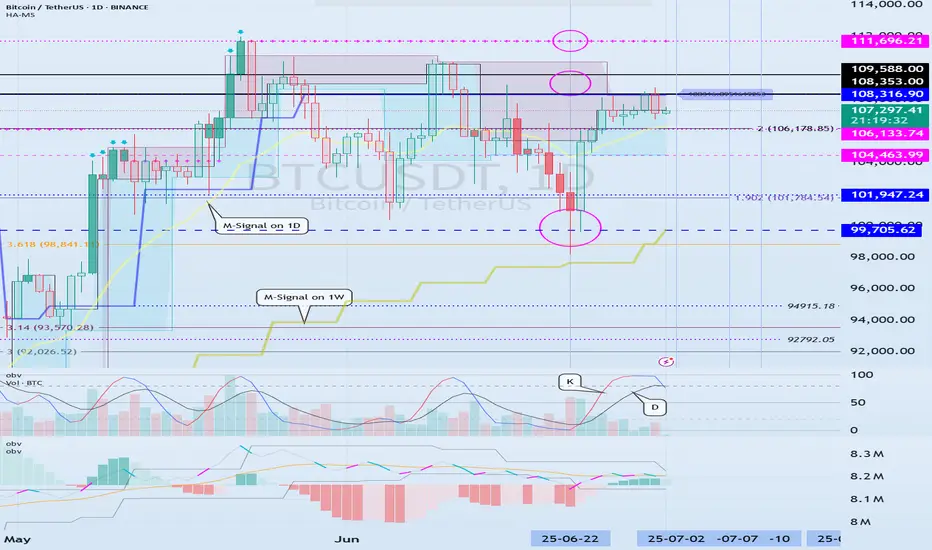
Check if price can hold above M-Signal indicator on 1D chart
Hello, traders.
If you "Follow", you can always get new information quickly.
Have a nice day today.
-------------------------------------
I failed to register a modified indicator of StochRSI indicator on TradingView alone, so I added it to the existing OBV by readCrypto indicator.
From the top of the indicator setting window to the bottom
1. OBV indicator of Low Line ~ High Line channel
2. PVT-MACD oscillator indicator
3. StochRSI indicator
They are registered in the order above.
Since the values used are all different, you should activate and use one indicator.
Please check the chart above.
------------------------------------------
(BTCUSDT 1D chart)
It is showing a downward trend as it failed to rise above the HA-High indicator (108316.90) on the 1D chart.
It is currently checking whether there is support near 107340.58, which is the StochRSI 50 indicator point.
If it fails to receive support and falls, it is expected to fall to around 104463.99.
The 104463.99 point is the DOM (60) indicator point of the 1W chart, which corresponds to the end of the high point on the 1W chart.
Since the StochRSI 20 indicator point is formed near the 104463.99 point, its importance can be considered high.
-
Since the M-Signal indicator of the 1D chart is passing near 106133.74, there is a possibility of volatility when touching this area.
Since the volatility period begins around July 2 (July 1-3), it is necessary to keep an eye on the current movement.
-
However, the key is to buy near the HA-Low indicator and sell near the HA-High indicator, so the current movement may be natural.
This volatility period is expected to last until around July 10 (July 9-11), so be careful when trading to avoid being fooled by fakes.
----------------------------------------
- The StochRSI indicator is showing signs of transitioning to a state where K < D.
- The PVT-MACD oscillator indicator is showing signs of decline.
- The OBV indicator of the Low Line ~ High Line channel is showing signs of decline in the High Line.
Therefore, if you look at the indicators, they are showing signs of decline overall.
However, if the OBV rises above the High Line, the price will show signs of rise.
Therefore, we need to observe the movements of the indicators while checking whether there is support at the StochRSI 50 indicator point.
Basically, the time to make a purchase is when it shows support near the DOM (-60) ~ HA-Low indicator.
If you want to make a purchase outside of that, you should not forget that a short and quick response is required.
The indicators that tell you the high point are HA-High, DOM(60) indicators.
In addition, there are StochRSI 80 and StochRSI 20 indicators that require quick response.
-
Thank you for reading to the end.
I wish you successful trading.
--------------------------------------------------
- Here is an explanation of the big picture.
(3-year bull market, 1-year bear market pattern)
I will explain the details again when the bear market starts.
------------------------------------------------------
Bitcoin summer of fun...If we are in a continuation pattern, and Bitcoin breaks the neckline soon.
We could be on the cusp of a very interesting and strong few months of price action.
Continuation upward sloping #inverseheadandshoudlers

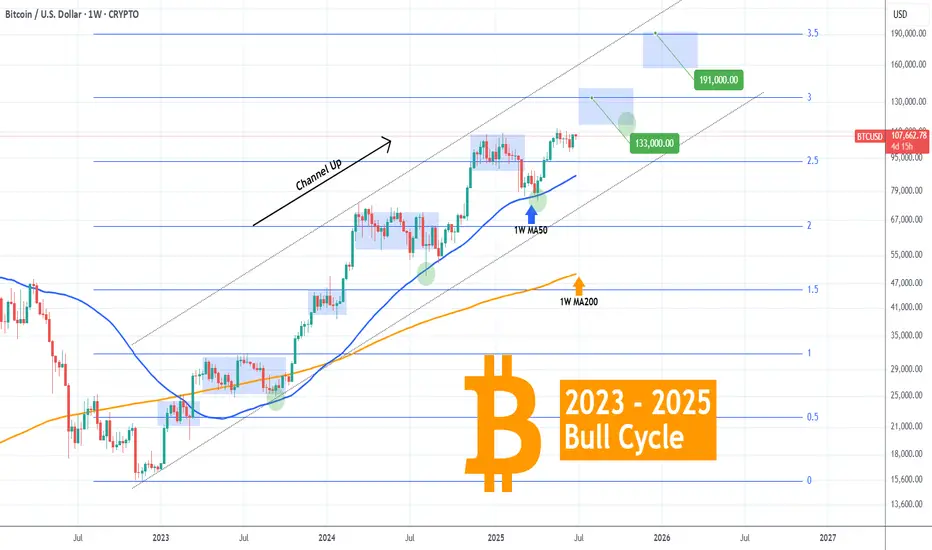
BITCOIN Bull Cycle's next two probable stops..Bitcoin (BTCUSD) has been trading within a 2.5-year Channel Up throughout the entirety of its 2023 - 2025 Bull Cycle, showcasing incredible consistency. This is perhaps BTC's most stable Bull Cycle and that can help us estimate to some degree its next two key levels, before its tops.
As you can see, every major Higher High of this pattern has been either on or marginally above a +0.5 Fibonacci interval:
Fib 0.5 was the February 2023 High and Accumulation Phase.
Fib 1.0 the April - September 2023 Accumulation.
Fib 1.5 December 2023 - January 2024.
Fib 2.0 March - September 2024.
Fib 2.5 December 2024 - February 2025.
Right now the market seems to be attempting a break-out above a Bull Flag, following the massive April 07 2025 rebound on the 1W MA50 (blue trend-line), a level that has been the most optimal buy entry in the past 2 years.
The next stop based on this model is the 3.0 Fibonacci extension level at 133000, where there are high probabilities for the market to consolidate (accumulation phase) in preparation for perhaps the final stop and Cycle peak on the 3.5 Fib ext around 191000. As we've discussed on previous analyses, a final Target between those two around $150000 may be more fitting, carrying less risk into the final months of the Bull Cycle.
So what do you think? Do you believe that's the blueprint to follow until the end of the year/ Cycle? Feel free to let us know in the comments section below!
-------------------------------------------------------------------------------
** Please LIKE 👍, FOLLOW ✅, SHARE 🙌 and COMMENT ✍ if you enjoy this idea! Also share your ideas and charts in the comments section below! This is best way to keep it relevant, support us, keep the content here free and allow the idea to reach as many people as possible. **
-------------------------------------------------------------------------------
💸💸💸💸💸💸
👇 👇 👇 👇 👇 👇