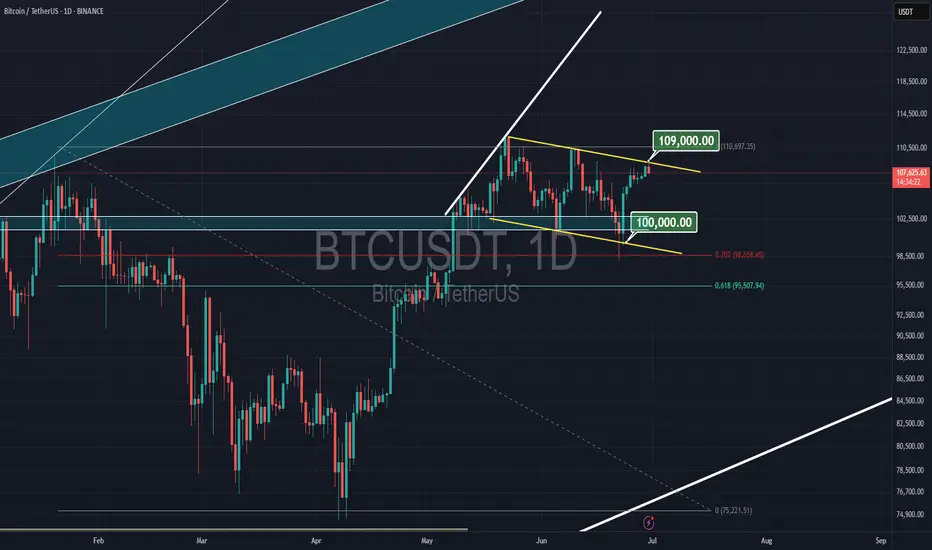
Strategy H2 2025. BTC Airless Plot Near $100'000 Choking PointOver the past 6 months, Bitcoin (BTC) has demonstrated a very mixed up/down performance, marked by significant price fluctuations, appreciation and volatility.
From late December 2024 to June 2025, BTC's price rose from approximately $92,000 to around $108,000, representing a gain of about 17.26% over this period.
On the other hand. the price fluctuated between last price in 2024 $92,000 and BTC' low near $74,491 achieved in early April 2025, posting the similar, nearly 20 percent year-to-date decline.
Bitcoin's price trajectory during this time was influenced by several factors. Early in 2025, BTC reached a new all-time high near $109,000 but faced a pullback triggered by profit-taking and macroeconomic uncertainties, dropping nearly 30% to about $74,000 by April. This decline was short-lived, as Bitcoin quickly rebounded by roughly 24%, climbing back to mid-$90,000 levels and eventually surpassing $100,000 again by June, signaling wide range fluctuations are getting for longer.
The technical setup suggests that Bitcoin is poised for further swings around $100'000 choking point.
In summary, Bitcoin’s performance over the last six months has been characterized by sharp correction, mixed technical buy and sell signals, with no any solid fundamental support from institutional investors.
These factors collectively indicate a mixed outlook for BTC, with further price fluctuations in wide range, as a mid-term pricе action perspective for H2 2025 and for longer.
Similar like a year ago 52-week SMA could be considered as major support level.
--
Best wishes,
@PandorraResearch Team 😎
Bitcoin (Cryptocurrency)
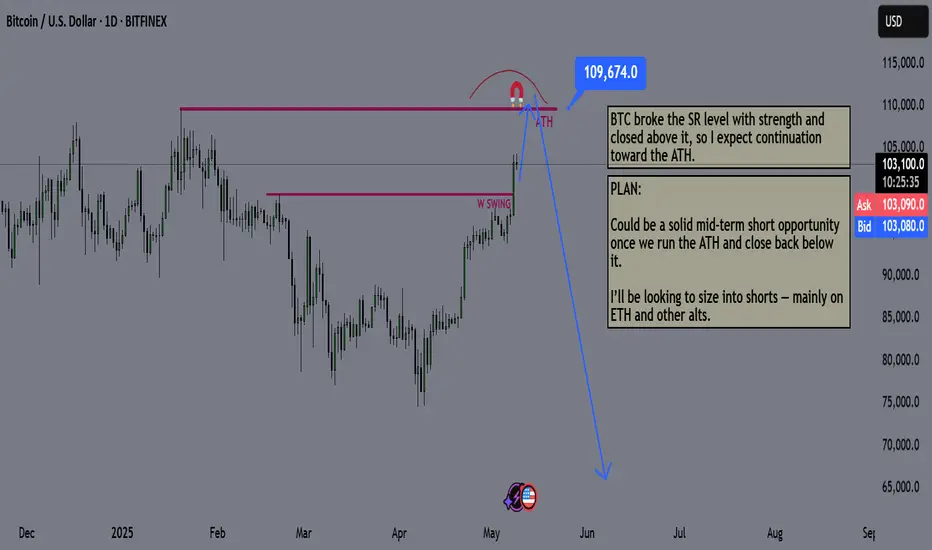
Bitcoin Mid Term Game Plan - BTC PLANBitcoin just broke a key resistance level with strength.
I expect a new all-time high soon, likely the summer top.
Summer markets are usually weak for risk assets and strong for gold. Seasonality matters, keep that in mind.
I expect risk markets to sell off until mid-July to early August. I’ll start buying once we break structure again.
The plan:
Wait for BTC to hit $110K
Look for a reversal from that level
Start aggressively shorting alts, beginning with ETH and memecoins
Hold shorts until late July / early August
Close positions and shift back to buying
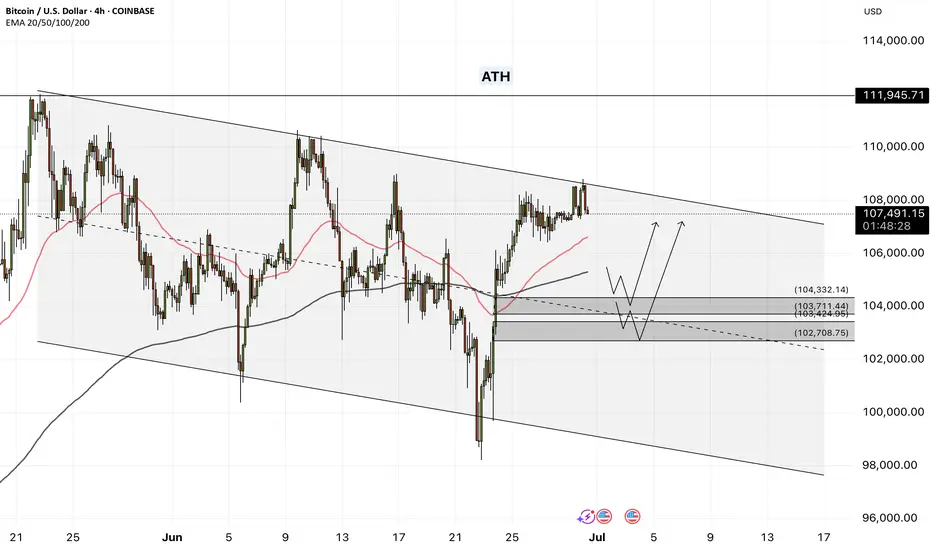
Bitcoin - Will Bitcoin Hit a New ATH?!Bitcoin is trading above the 50- and 200-EMAs on the four-hour time frame and is within its short-term descending channel. Bitcoin can be bought from the demand zone indicated. A break of the channel ceiling would pave the way for Bitcoin to rise to a new ATH.
It should be noted that there is a possibility of heavy fluctuations and shadows due to the movement of whales in the market and compliance with capital management in the cryptocurrency market will be more important. If the downward trend continues, we can buy within the demand range.
In recent days, Bitcoin has been trading in a range of around $107,000, and the market is going through a consolidation phase with complex but deeply fundamental characteristics. What matters at this point is not just the current price, but the precise mix of capital flows, the behavior of major players, on-chain data, and macroeconomic ratios that shape Bitcoin’s short- and medium-term trajectory. Overall, although Bitcoin’s rapid growth after the halving has stopped, internal market signals point to a continuation of the upward trajectory in a more stable framework.
The first important component is the significant influx of institutional capital into the market via ETFs. In the past week, according to CoinShares, more than $1.24 billion in new capital entered crypto products, with Bitcoin accounting for more than $1.1 billion. This marks the 10th consecutive week of capital inflows into the market, bringing the total inflows for 2025 to over $15 billion. Prominent ETFs such as BlackRock’s IBIT and Fidelity’s FBTC are attracting hundreds of Bitcoins per day, indicating steady institutional demand that has weathered the momentary volatility and is more focused on long-term asset building.
Alongside this capital inflow, the Onchain data also paints a mixed but highly interpretable picture. While the average active address rate has declined slightly and the MVRV (market value to realized value) has fallen from 2.29 to 2.20, these changes are more indicative of profit-taking by investors than selling pressure! In fact, rather than fear of a correction or crash, the market is witnessing a “gentle shift of ownership” between short-term and long-term holders. UTXO data also shows a roughly 5% increase in Bitcoin held for over 8 years, a strong sign of long-term accumulation and a decrease in the willingness to sell at current prices!
This can be seen as a period of supply and demand equilibrium; a period in which large investors have entered, but on the other hand, some older players are taking reasonable profits. This has led to a kind of price consolidation, which in June showed itself with only 2% growth—the weakest monthly growth since July last year. However, CoinDesk and Glassnode analysts rightly emphasize that this consolidation is not a sign of market weakness, but rather evidence of the maturity of Bitcoin’s price behavior. The price is reacting to data rather than becoming emotional.
From a macroeconomic perspective, Bitcoin remains highly sensitive to the Federal Reserve’s monetary policy, the value of the dollar, and interest rates. While the market is still waiting for interest rate cuts in the second half of the year, Bitcoin will remain in a quasi-expectant state until then, reacting to macro data, short-term and reactive. However, given that most ETFs follow long-term accumulation models, any stabilization in interest rates or easing geopolitical pressures could trigger a new wave of upside. Common analyst scenarios predict a range of $120,000-$130,000 for Bitcoin by the end of the summer if current conditions are maintained and capital inflows continue. In summary, Bitcoin is now at a stage where the dynamic combination of institutional accumulation, supply and demand balance, and on-chain data has transformed it from a purely risky asset into a strategic investment vehicle. The market has moved beyond the emotional phase and entered a phase of stability and maturity. This is a promising sign for long-term investors, provided that risk management is maintained and sensitivity to macro events is maintained. Bitcoin is preparing for the next stage of its rally—but unlike in the past, this time it is standing on the shoulders of fundamentals that are much stronger than at any time in the asset’s history.
ETFs with the most volume traded on Friday
Total: $501M
BlackRock: $153M
Fidelity: $165M
Grayscale: $0M
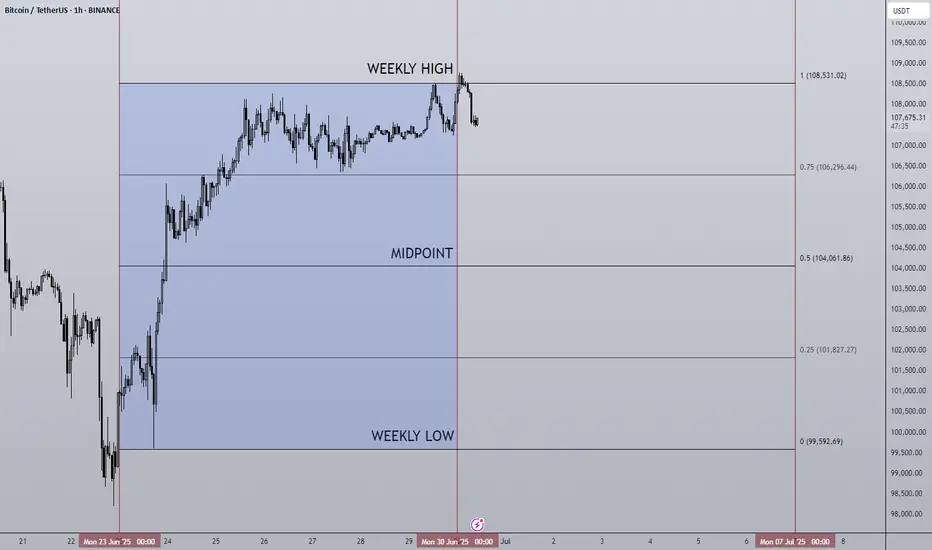
30/06/25 Weekly OutlookLast weeks high: $108,531.02
Last weeks low: $99,592.69
Midpoint: $104,061.86
Overall a positive week for BTC in isolation as price moves steadily all week reclaiming the losses made in the week from the 16th-23rd June. This comes after a $2.2B BTC ETF weekly inflow, the 3rd consecutive week of net inflows.
Having now hit the key S/R level of $108,500 it will be interesting to see where BTC goes from here. Jumping up above the level will require a lot from the bulls as ATH is within touching distance and so buying into major resistance is a tough ask. We also have Geo-political uncertainties to add to the situation, one bad tweet is all it takes sometimes to do a lot of damage.
On the other hand the SNP500 hits new ATH in the same conditions and so BTC is more than capable of doing the same.
So far in the first hours of this weeks trading we do have a SFP of the weekly high setup, not ideal for the bulls in any way and so from here the a retest of the range quarters, midpoint being the key area would make sense, invalidation would be a clean break above weekly high with acceptance and strong volume on the move to break the rangebound/choppy environment.
There is also the "window dressing" element to the months &quarter end today. History shows a de-risking going into these events and more money flowing back into risk-on assets in the days following monthly/ quarterly end. For that reason a bullish move (if there were to be one) would come later in the week IMO.
Good luck this week everybody!
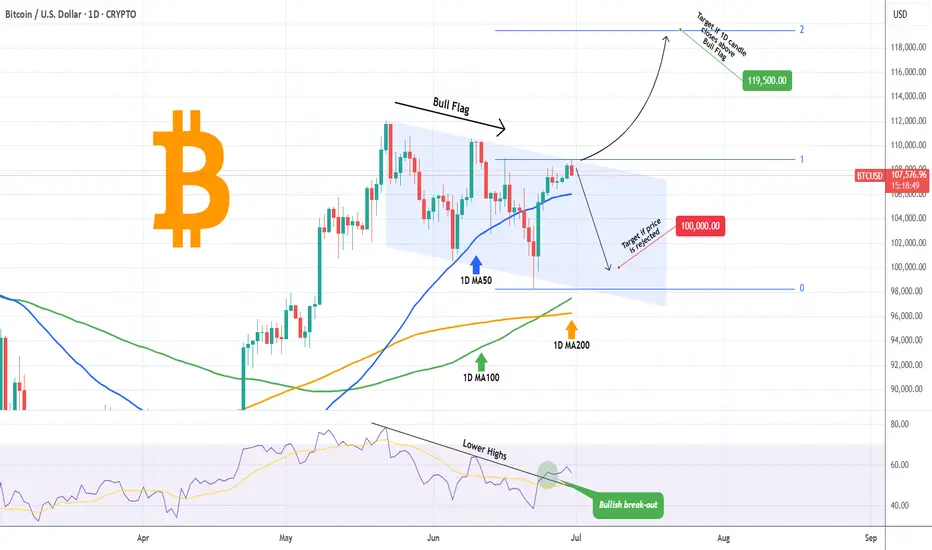
BITCOIN Rejected (so far) where it absolutely SHOULDN'T!!Bitcoin (BTCUSD) hit today the top of the Channel Down pattern, which as we've discussed numerous times, is most likely on the long-term a Bull Flag technically. Still, this early test has so far turned into a rejection.
Early on to tell as the price remains above even the 1D MA50 (blue trend-line) but if it breaks above the closes a 1D candle above the top of the pattern, we expect it to immediately target the 2.0 Fibonacci extension level at 119500. We have analyzed of course why on the long-term the Target is at least $150k, but this is a shorter term analysis. Notice also how the 1D RSI has already broken above its Lower Highs trend-line.
As long as the price remains rejected within the Channel Down, it is possible to look for support on the 100000 level again, where this time it may make contact with the 1D MA100 (green trend-line) in an attempt to 'attract' the last batch of buyers.
Which scenario do you think will prevail? Feel free to let us know in the comments section below!
-------------------------------------------------------------------------------
** Please LIKE 👍, FOLLOW ✅, SHARE 🙌 and COMMENT ✍ if you enjoy this idea! Also share your ideas and charts in the comments section below! This is best way to keep it relevant, support us, keep the content here free and allow the idea to reach as many people as possible. **
-------------------------------------------------------------------------------
💸💸💸💸💸💸
👇 👇 👇 👇 👇 👇
BTC/USD Technical Analysis – Weekly Elliott Wave StructureIn this video, we analyze the weekly chart of Bitcoin ( BYBIT:BTCUSDT ) using Elliott Wave theory.
The current structure suggests the beginning of a new bullish impulse (waves 0, 1, and 2) following a clearly completed and technically correct corrective phase.
We explore potential impulsive scenarios starting from wave 2, using Fibonacci extensions to project possible targets and identifying key support zones and invalidation levels.
This analysis aims to provide a macro perspective based on price action, helpful for traders and investors following BTC from a medium- to long-term technical view.
🛑 Disclaimer: This content is for educational and informational purposes only. It does not constitute investment advice. Each user is responsible for their own trading decisions.

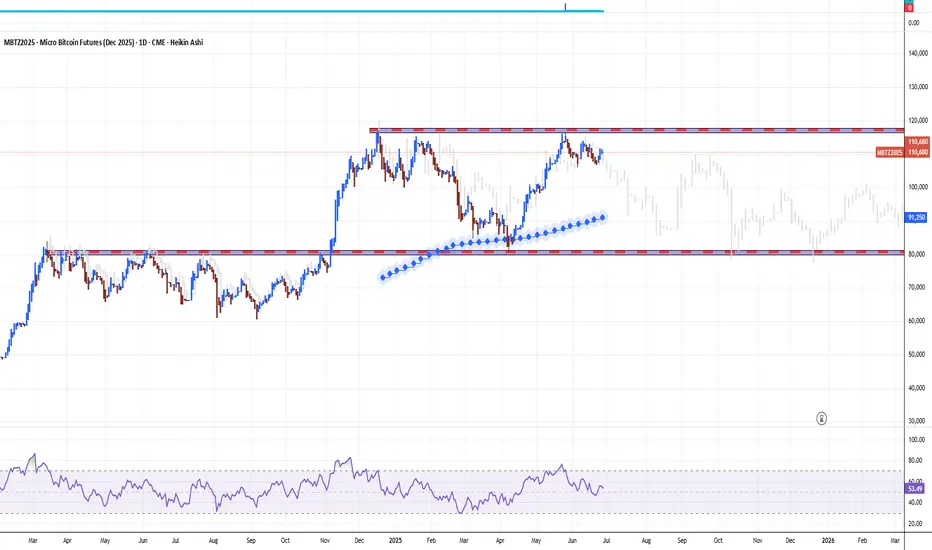
$BTC Bullish Engulfing Weekly CloseCRYPTOCAP:BTC closes the Week with a Big Bullish Engulfing candle back within the POI.
Should retest ATH soon.
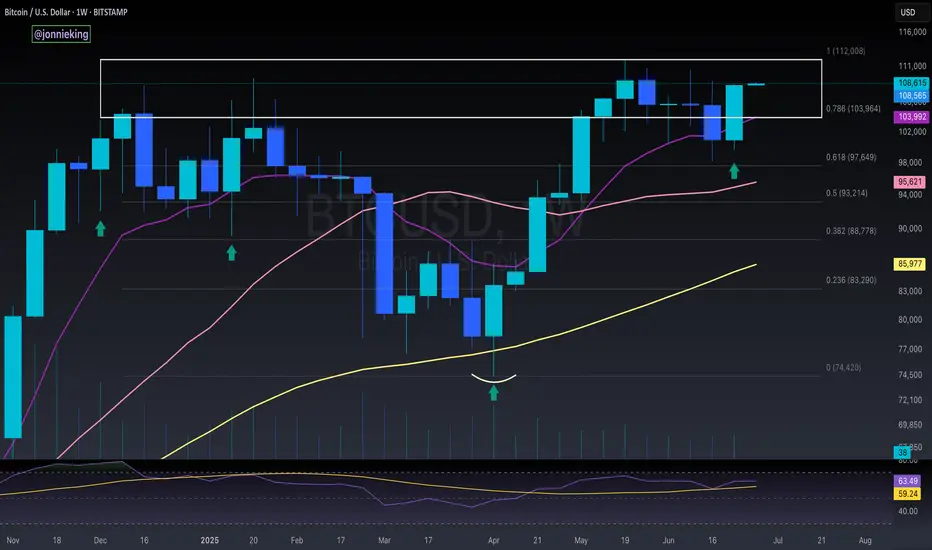
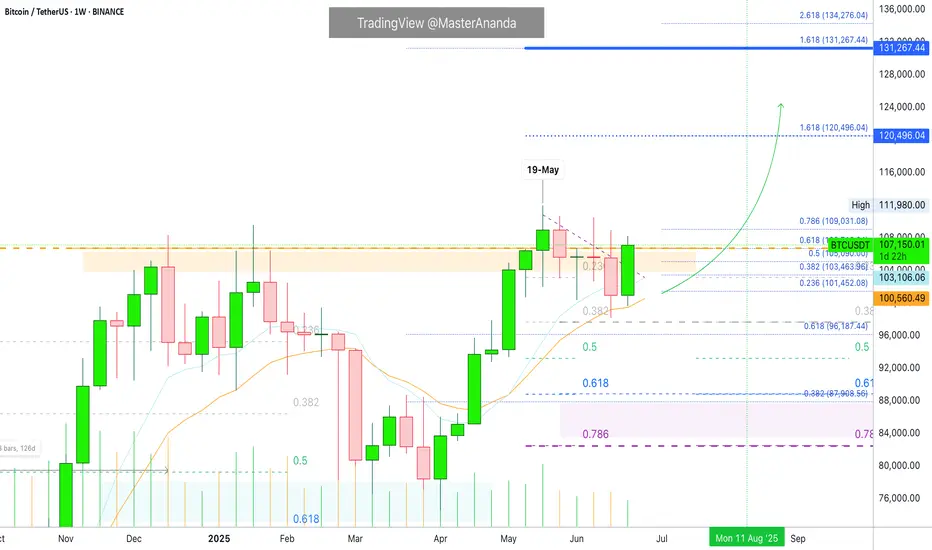
Bitcoin Weekly & $120,000This weekly Bitcoin chart says it all... Please, allow me to reveal to you what the future holds!
Good evening my fellow Cryptocurrency trader, what a wonderful day.
Only one week ever produced a higher close than the current price. Only once, 19-May, Bitcoin managed to close above $107,000... What happens if Bitcoin closes above $107,000? New all-time high confirmed.
Two days remain for the week to close and we—the bulls—only need to maintain a price of $107,000 or higher to send such a strong bullish signal that everybody will come out and start buying.
The next target on this timeframe is $120,000.
Bitcoin is using EMA13 as support. This level was tested and holds, the same for EMA8. When Bitcoin moved above these levels in April, it produced an advance from $83,000 to $112,000, more than 33%. The price now is $107,000 but instead of recovering from below EMA8/13, BTCUSDT is trading above; this means that the bullish bias is fully confirmed.
The weekly timeframe looks great. We can expect higher prices soon, with growth happening for an extended period of time. Bitcoin is very strong now and this is only the start.
I will continue to share proof that shows the entire Cryptocurrency market going up.
Thank you for reading.
Leave a comment with your questions.
Thanks a lot for your support.
Namaste.
Analyzing the new month, new week, new day
Hello, traders.
If you "follow", you can always get the latest information quickly.
Have a nice day today.
-------------------------------------
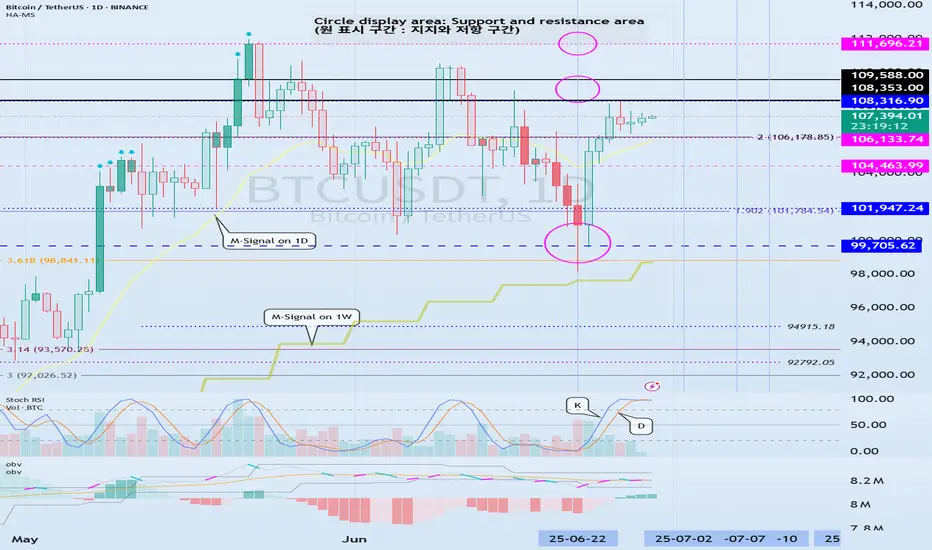
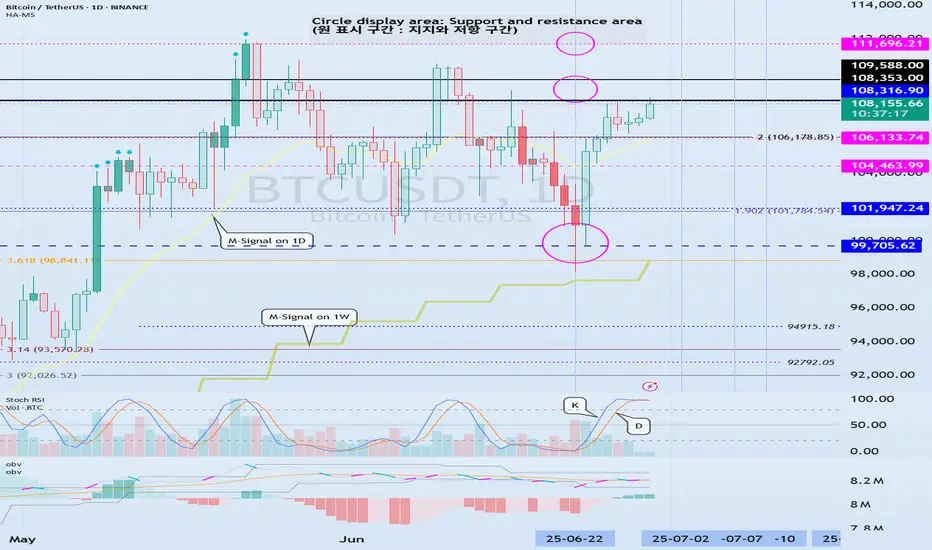
(BTCUSDT 1M chart)
A new month begins in one day.
The key is whether it can hold the price by rising above 109588.0.
If not, there is a possibility that it will fall below the 94172.00 StochRSI 50 indicator point that the arrow is pointing to.
We need to see if it can rise with support near the Fibonacci ratio of 1.618 (89050.0).
Since the current low-point trend line is not complete, it is not surprising that it can show a downward trend at any time.
However, if it rises above 109588.0 and maintains the price, it is expected that there will be an attempt to rise near the Fibonacci ratio of 2.618 (133889.92).
I think it is likely to be the last target of the target bull market in 2025.
-
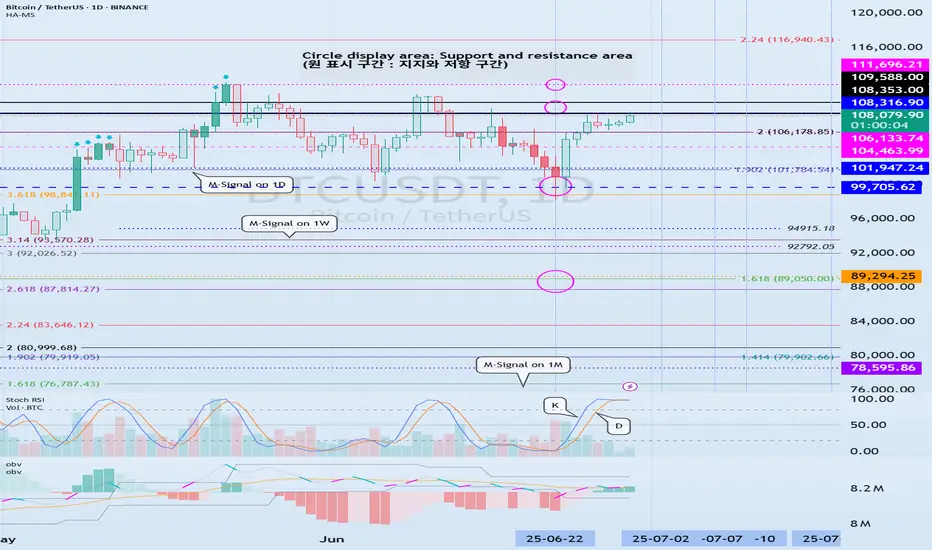
(1W chart)
It is a period of volatility around the week including June 23.
That is, from June 16 to July 6 is the volatility period.
The key is whether it can rise to the right Fibonacci ratio 2.24 (116940.43) during this volatility period.
Even if it fails to rise, if the price maintains above 104463.99, it is expected to show an upward trend around the next volatility period.
The next volatility period on the 1W chart is expected to be around the week of August 18.
-
When it falls below 104463.99, we need to check whether the HA-High indicator is newly generated.
If not, it is important to check whether there is support around the current HA-High indicator point of 99705.62.
Since the M-Signal indicator on the 1W chart is passing around 99705.62, its importance can be said to be high.
If it falls below the M-Signal indicator of the 1W chart, it is expected to determine the trend again when it meets the M-Signal indicator of the 1M chart.
-
(1D chart)
The key is whether it can maintain the price by rising above the HA-High indicator point of 108316.90 on the 1D chart.
If it fails to rise,
1st: 104463.99
2nd: 99705.62
You should check for support near the 1st and 2nd above.
If it falls below the M-Signal indicator of the 1W chart,
1st: 89294.25
2nd: M-Signal of the 1M chart
There is a possibility that it will fall near the 1st and 2nd above.
-----------------------------------------
(1W chart)
The chart above is a trend line chart drawn on the 1W chart.
It looks complicated, but what's important to look at is the correlation between the high-point trend line and the low-point trend line.
That is, even if the price rises above 109.588.0, if it doesn't rise above the high-point trend line, it is likely to fall near the low-point trend line.
Fortunately, since it is forming an upward channel, it is expected that the price will eventually rise even if it falls.
-
(1D chart)
Unlike the trend line on the 1W chart, the high-point trend line on the 1D chart forms a downward trend line.
Accordingly, the period around July 7, when the low-point trend line and the high-point trend line intersect, can be considered an important period of volatility.
However, the volatility period starts around July 2nd and is expected to end around July 10th.
----------------------------------------------
As shown above, many lines were drawn to analyze the chart.
I have roughly explained which of the lines drawn in this way should be prioritized.
Since chart analysis is for creating a trading strategy, the support and resistance points drawn on the 1M, 1W, and 1D charts are ultimately the most important.
Therefore, it is most important to check how the support and resistance points were created and find the reason for them.
Other analyses are only additional elements.
As I always say, chart analysis that does not show support and resistance points is only an analysis chart that can be used for trading.
You cannot trade with such analysis charts.
Also, if support and resistance points are shown, you should check the basis for setting the support and resistance points.
In order to serve as a support and resistance point, there must be a basis.
When you cannot confirm the basis for the support and resistance point, it is important to ask questions and find out the basis.
Fibonacci ratios are not suitable for actual trading.
However, when the ATH or ATL is updated, it is valuable enough for analysis.
Other than that, there must be support and resistance points drawn on the 1M, 1W, and 1D charts.
-
Thank you for reading to the end.
I hope you have a successful trade.
--------------------------------------------------
- This is an explanation of the big picture.
(3-year bull market, 1-year bear market pattern)
I will explain more details when the bear market starts.
------------------------------------------------------
Bitcoin: Bearish Signal Watch 107,400 To Confirm.Bitcoin bearish pin bar developing, which is a bearish sign at least for the short term. IF this candle closes and low is compromised, (107,400?) A sell signal will be in effect (see arrow). This will also confirm a failed break out (see trend line) of a multi month consolidation. The signal in question is an ideal setup for swing traders or day traders looking for aggressive shorts, while the broader trend is completely intact. A reasonable price objective for such a move is the 103K area which is basically the mid point of the consolidation and near the 102 to 100K support. While the market can potentially break lower than that, there is NO way to forecast such an event. Market confirms first, then expectations can be adjusted effectively.
The wave count has been adjusted on this chart. The current consolidation is likely the sub wave 4 of the broader 5 which means implies the trend is still bullish since the sub wave 5 of 5 is not in play yet. Maybe after this next retrace? The next bullish setup (around 103K?) may present a high probability swing trade opportunity on the long side possible over the next week or two.
Keep in mind, it is not a good idea to get married to any opinions. I don't care how bullish the fundamentals are, all it takes is an unexpected catalyst and this market retraces hard. A week ago we were flirting with 98K, today 108K. Levels and price action are a much more accurate gauge of where the market is likely to go on the short term, and more importantly offer greater insight into the potential reward and RISK.
I adjust my outlook constantly because I know that the MARKET is ALWAYS right. It offers guidance if you know how to listen and be flexible. "Outlook" can be categorized by time which helps to keep expectations inline with market intent. For example, reward and risk expectations for a swing trade (4H time frame) will be smaller compared to a position entered for investment (weekly time frame). Keeping these expectations separate will help you control risk in a much more optimal way compared to having a swing trade turn into an investment.
Thank you for considering my analysis and perspective.

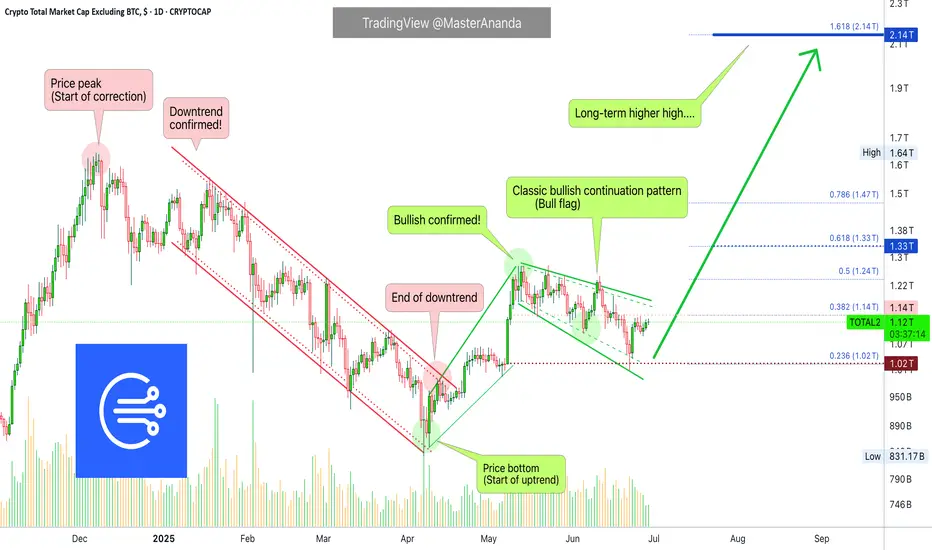
What is Needed for BTC-Altcoins Bull Market —Crypto is Going Up!Some people are under the impression that Bitcoin needs to go down for the altcoins to go up. No, no, no, no, no... This is a big mistake. Bitcoin needs to continue growing for the altcoins to explode. Let me explain.
Bitcoin has been trading very high forever now and the altcoins grow when Bitcoin is very strong. The current situation with Bitcoin is good for the altcoins but the altcoins need a major force, a strong impulse and maximum support for a bull run and this only happens when Bitcoin goes up.
If Bitcoin retraces from resistance this is bad for the altcoins. Whatever gains tend to be removed right away. If Bitcoin moves forward and hits a new all-time high, this is incredibly beneficial for the altcoins and the altcoins continue growing for the long haul.
Instead of Bitcoin going down or falling behind for the altcoins to grow, Bitcoin needs to continue strong. A stronger Bitcoin is good for the altcoins. The more Bitcoin grows, the more pressure the altcoins market feels to follow.
As long as Bitcoin trades above $100,000, the altcoins can do great. If Bitcoin falters, the altcoins suffer but this is only short-term.
Regardless of what happens in the short-term, Cryptocurrency is set to grow. We will experience the best yet since 2021. This bull market will extend beyond 2025 and it will go into 2026 and who knows, maybe even beyond.
100% certainty, you can bet your house on it; Crypto is going up.
Namaste.
#202526 - priceactiontds - weekly update - bitcoinGood Day and I hope you are well.
#btcusd - bitcoin
comment: Neutral since bears fumbled it again. Range is clear, don’t have much else to say about this. Bulls want 113k+ and bears need a strong daily close below 100k for more downside.
current market cycle: trading range
key levels: 100k - 115k
bull case: Bulls are still hopeful, that’s why we are still above 110k but the next touch could break it and I doubt many will hold long or scale into new ones there. Best bulls can get right now is to go sideways for longer and stay above 100k. I mean… Staying above 100k is as bullish as it get’s if you be honest. Same as last week since nothing has changed for the bulls. Trading range since mid May.
Invalidation is a strong daily close below 100k
bear case: Bears fumbled it again. Strong daily close below 100k or we won’t go lower. Right now odds favor the bears to go down from 107k to 100k but need more selling pressure.
Invalidation is above 110k
short term: As neutral as can be.
medium-long term - Update from 2025-06-29: Strong daily close below 100k will be the confirmation for more downside. First target below 100k is 97k the breakout retest and after that is the 50% retracement around 93k. I have no bullish for the next weeks/months. Once the gap to 97k closes we are likely in a bear trend again and I expect to hit at least 85k over the summer.
Example of how to draw a trend line using the StochRSI indicator
Hello, traders.
If you "Follow", you can always get new information quickly.
Have a nice day today.
-------------------------------------
We use the StochRSI indicator to draw a trend line.
We draw a trend line by connecting the peaks of the StochRSI indicator, i.e. the K line, when they are created in the overbought area or when they are created in the overbought area.
That is, when the K line of the StochRSI indicator forms a peak in the overbought area, the trend line is drawn by connecting the Open values of the falling candles.
If the candle corresponding to the peak of the StochRSI indicator is a rising candle, move to the right and use the Open value of the first falling candle.
When drawing the first trend line, draw it from the latest candle.
Since the third trend line indicates a new trend, do not draw anything after the third trend line.
The currently drawn trend line corresponds to the high-point trend line.
-
Therefore, you should also draw the low-point trend line.
The low-point trend line is drawn by connecting the K line of the StochRSI indicator when the top is formed in the oversold zone.
The low-point trend line uses the low value of the candle when the K line of the StochRSI indicator forms the top in the oversold zone.
That is, it doesn't matter whether the candle is a bearish candle or a bullish candle.
The drawing method is the same as when drawing the high-point trend line, drawing from the latest candle.
The top of the best K line of the StochRSI indicator was not formed within the oversold zone.
(The top is indicated by the section marked with a circle.)
Since the trend line was not formed, the principle is not to draw it.
If you want to draw it and see it, it is better to display it differently from the existing trend line so that it is intuitively different from the existing trend line.
-
The chart below is a chart that displays the trend line drawn separately above as a whole.
It is also good to distinguish which trend line it is by changing the color of the high-point trend line and the low-point trend line.
The chart below is a chart that distinguishes the high-point trend line in blue (#5b9cf6) and the low-point trend line in light green (#00ff00).
The low-point trend line is a line drawn when the trend has changed, so it does not have much meaning, but it still provides good information for calculating the volatility period.
-
To calculate the volatility period, support and resistance points drawn on the 1M, 1W, and 1D charts are required.
However, since I am currently explaining how to draw a trend line, it is only drawn on the 1M chart.
-
I use the indicators used in my chart to indicate support and resistance points.
That is, I use the DOM(60), DOM(-60), HA-Low, HA-High, and OBV indicators to indicate support and resistance points.
Since the DOM(-60) and HA-Low indicators are not displayed on the 1M chart, I have shown the 1W chart as an example.
The indicators displayed up to the current candle correspond to the main support and resistance points.
Although it is not displayed up to the current candle, the point where the horizontal line is long is drawn as the sub-support and resistance point.
It is recommended to mark them separately to distinguish the main support and resistance point and the sub-support and resistance point.
The trend line drawn in this way and the support and resistance points are correlated on the 1D chart and the volatility period is calculated.
(For example, it was drawn on the 1M chart.)
The sections marked as circles are the points that serve as the basis for calculating the volatility period.
That is,
- The point where multiple trend lines intersect
- The point where the trend line and the support and resistance points intersect
Select the point that satisfies the above cases at the same time to display the volatility period.
When the point of calculating the volatility period is ambiguous, move to the left and select the first candle.
This is because it is meaningless to display it after the volatility period has passed.
If possible, the more points that are satisfied at the same time, the stronger the volatility period.
If the K-line peak of the StochRSI indicator is formed outside the overbought or oversold zone, it is better to exclude it when calculating the volatility period.
-
The chart below is a chart drawn on a 1D chart by summarizing the above contents.
The reason why there are so many lines is because of this reason.
For those who are not familiar with my charts, I have been simplifying the charts as much as possible these days.
However, when explaining, I have shown all the indicators to help you understand the explanation.
-
Thank you for reading to the end.
I hope you have a successful trade.
--------------------------------------------------
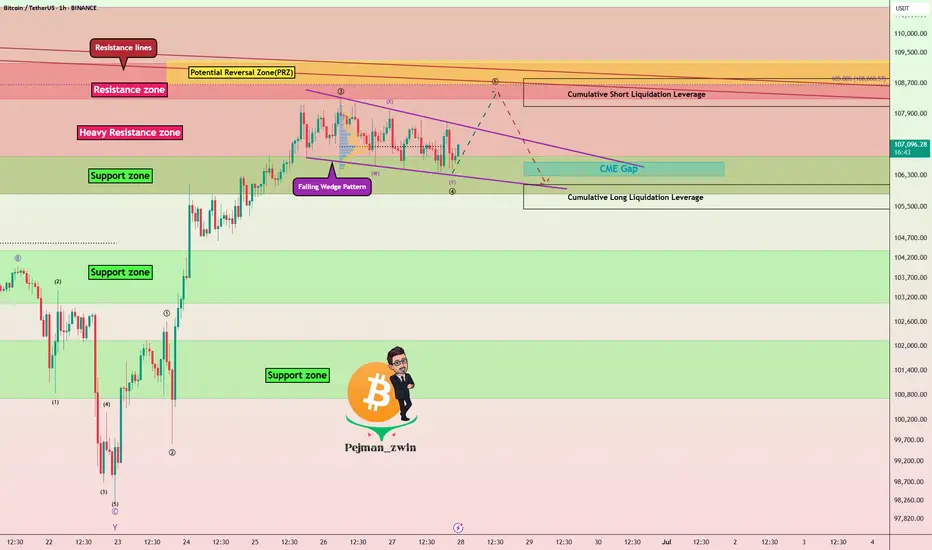
Bitcoin Approaches PRZ – Will the Falling Wedge Break ?Bitcoin ( BINANCE:BTCUSDT ) failed to break through the Support zone($106,800-$105,820) after attacking it five times , and started to rise again.
Bitcoin is currently moving near the Resistance zone($109,220-$108,280) , Cumulative Short Liquidation Leverage($108,800-$108,085) , Potential Reversal Zone(PRZ) , and Resistance lines .
From a Classical Technical Analysis perspective , Bitcoin's movements over the past two days seem to have formed a Falling Wedge Pattern .
From an Elliott Wave theory perspective , Bitcoin appears to have completed the main wave 4 within the Falling Wedge Pattern. The structure of the main wave 4 was a Double Three Correction(WXY) .
I expect Bitcoin to attack the Resistance lines after breaking the upper line of the Falling Wedge Pattern . If Bitcoin fails to break the Resistance lines before the global markets close , we can expect Bitcoin to fall again. Because entering Saturday and Sunday , the trading volume is generally low , and I think Bitcoin needs a lot of volume to break the resistances .
Do you agree with me?
CME Gap: $106,645-$106,295
Cumulative Long Liquidation Leverage: $106,055-$105,430
Note: If Bitcoin manages to break the Support zone($106,800-$105,820), we should expect further declines.
Please respect each other's ideas and express them politely if you agree or disagree.
Bitcoin Analyze (BTCUSDT), 1-hour time frame.
Be sure to follow the updated ideas.
Do not forget to put a Stop loss for your positions (For every position you want to open).
Please follow your strategy and updates; this is just my Idea, and I will gladly see your ideas in this post.
Please do not forget the ✅' like '✅ button 🙏😊 & Share it with your friends; thanks, and Trade safe.
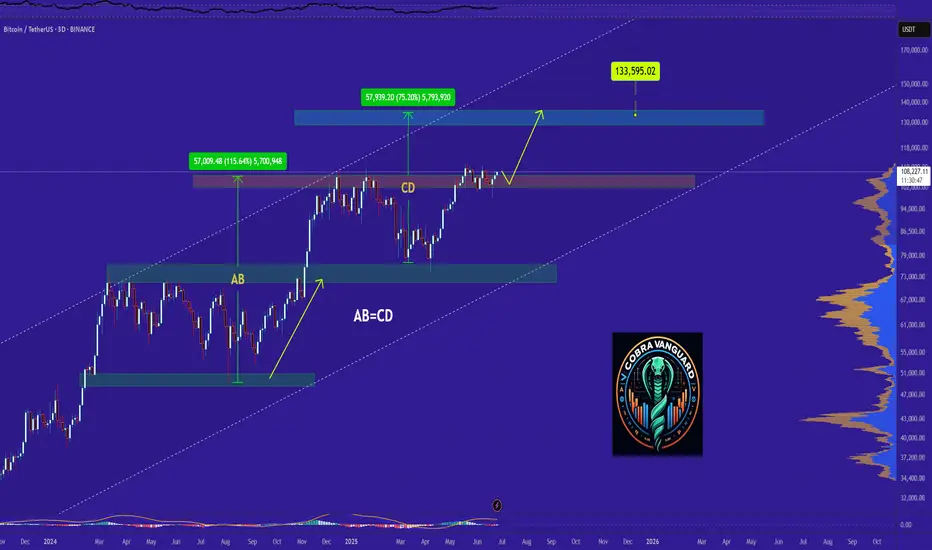
Do you think I'm joking ???Chart is speaking itself...AB=CD.
previous analysis
Give me some energy !!
✨We spend hours finding potential opportunities and writing useful ideas, we would be happy if you support us.
Best regards CobraVanguard.💚
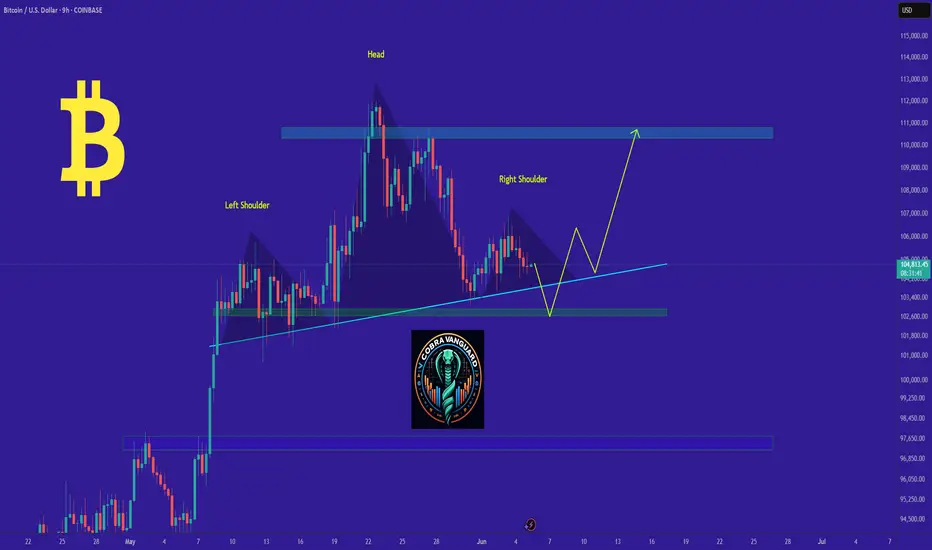
This is a deception or maybe a technique !!!I think this head and shoulders pattern is trying to deceive us and is fake. I expect the price to drop to the support line and then rise to $109k. WAIT FOR IT....
Give me some energy !!
The Crypto Market Game: How to Win Against Fear and Manipulation
Did you really think profiting from the current bull run (a comprehensive upward market) would be easy? Don't be naive. Do you think they’ll let you buy low, hold, and sell high without any struggle? If it were that simple, everyone would be rich. But the truth is: 90% of you will lose. Why? Because the crypto market is not designed for everyone to win.
They will shake you. They will make you doubt everything. They will create panic, causing you to sell at the worst possible moment. Do you know what happens next? The best players in this game buy when there’s fear, not sell—because your panic gives them cheap assets.
This is how the game works: strong hands feed off weak hands. They exaggerate every dip, every correction, every sell-off. They make it look like the end of the world so you abandon everything. And when the market rises again, you’re left sitting there asking, “What just happened?”
This is not an accident. It’s a system. The market rewards patience and punishes weak emotions. The big players already know your thoughts. They know exactly when and how to stir fear, forcing you to give up. When you panic, they profit. They don’t just play the market—they play you. That’s why most people never succeed: they fall into the same traps over and over again.
People don’t realize that dips, FUD (fear, uncertainty, doubt), and panic are all part of the plan. But the winners? They block out the noise. They know that fear is temporary, but smart decisions last forever.
We’ve seen this play out hundreds of times. They pump the market after you sell. They take your assets, hold them, and sell them back to you at the top—leaving you with nothing, wondering how it happened.
Don’t play their game. Play your own.
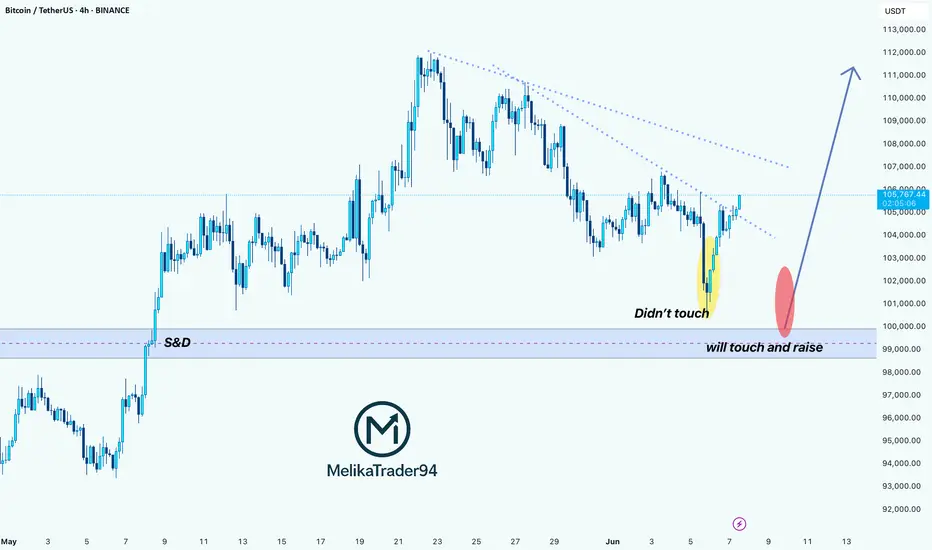
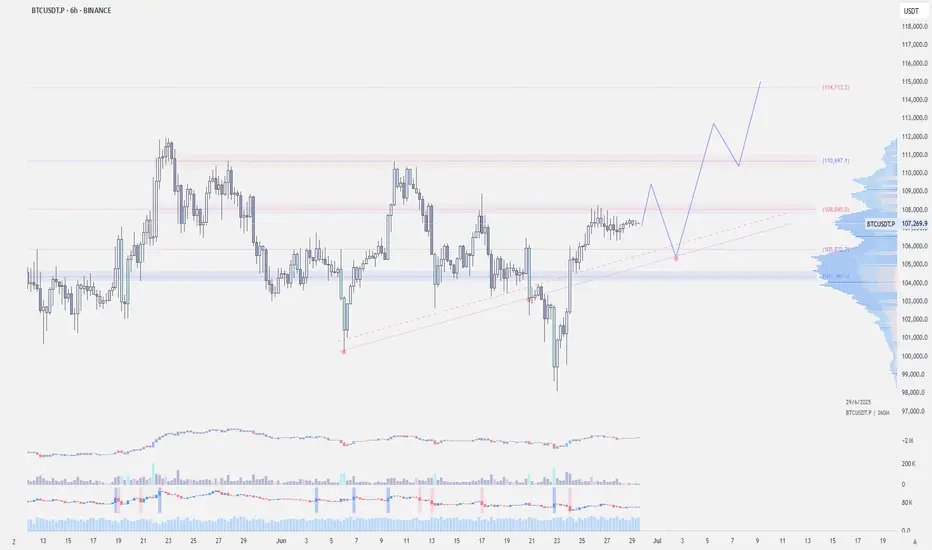
BTC Is Replaying a Bullish Fractal >>> Are You Watching?Hello guys!
I see a deja vu here! Let’s look at the historical daily chart (Jan–May 2025):
What happened?
Initial Drop (Yellow Oval): Bitcoin approached a key S&D zone but didn't touch it, triggering a short-lived bounce before dropping again.
Second Drop (Red Ovals): This time, price precisely touched the demand zone, triggering a clean bullish reversal.
What followed was a strong trend breakout, sustained higher lows, and an eventual surge past prior resistance levels.
Current 4H Chart Setup: A Mirror Image?
Yellow Highlight: Once again, we saw a bounce that didn't quite touch the key demand zone ($98K–$100K).
Red Zone Prediction: If this mirrors the historical move, the price is likely to return and touch this S&D area before launching a bullish leg.
Blue Path Projection: A sharp reversal is expected post-touch, aiming toward $111K–$113K as the next key resistance zone.
The descending trendline adds confluence
___________________
History Doesn’t Repeat, But It Often Rhymes
Based on this fractal analysis, Bitcoin is likely forming the same bullish base seen earlier in 2025. The setup hinges on one key event: a return to the $99K–$100K zone, where demand is likely to step in aggressively.
If the pattern repeats, the current market may offer one last high-reward long opportunity before a parabolic rally.
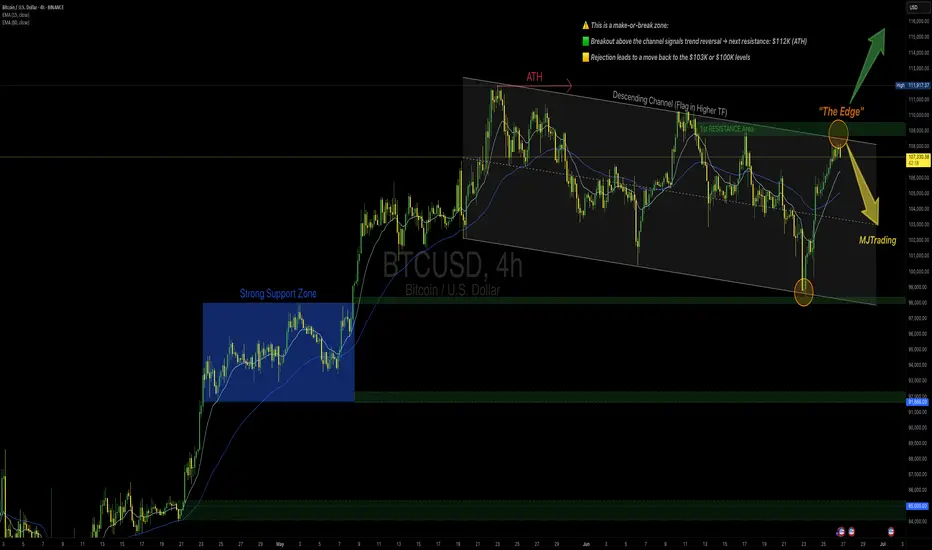
BTCUSD – Major Decision Point at The Edge📍 By: MJTrading |||
Bitcoin has rallied sharply from ~$98K and is now testing a critical confluence zone — the top of the descending channel and a strong supply area, known as "The Edge."
EMAs are turning up, supporting bullish momentum
⏳ What’s Next?
At this stage, two scenarios emerge:
⚠️ This is a make-or-break zone:
🟩 Breakout above the channel signals trend reversal → next resistance: $111K
🟨 Rejection leads to a move back to the $103K or $100K levels
This setup offers a high-RR opportunity for both breakout traders and mean reversion players.
🧠 Trade the reaction at the edge, not the prediction.
Thanks for your attention...
Share your thoughts...
—
#BTCUSD #Bitcoin #CryptoTrading #TheEdge #BreakoutOrBounce #CryptoSetup #DescendingChannel #SmartMoney #TechnicalAnalysis #PriceAction #SwingTrade #EMA #RiskReward #MJTrading #4hChart #TrendDecision #SupplyZone
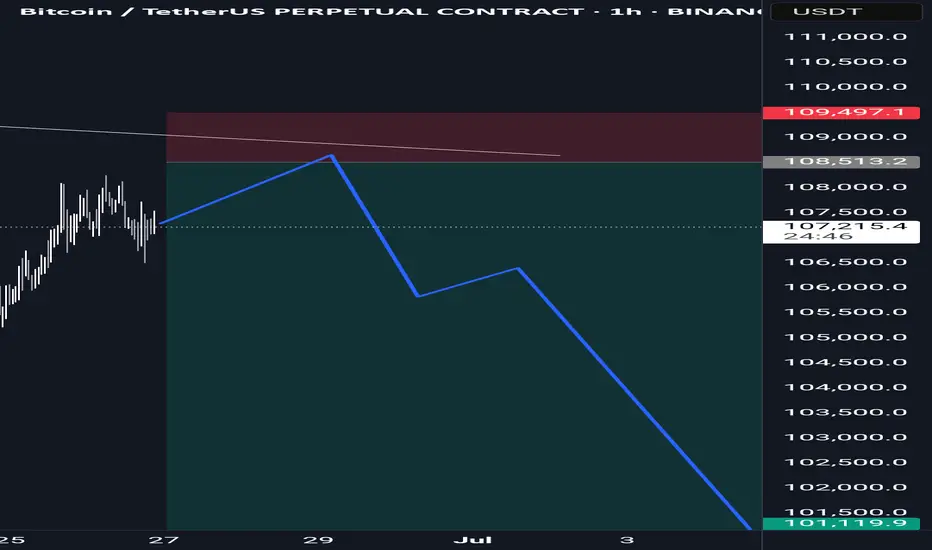
Bitcoin short position After my win streak from previous trades on btcusd I happy to give me to the people who followed me
Here's another great trade for you
Short Bitcoin with a limit order at 108,500
Take profit at 101k , stop loss at 109,500
A 7.5 to 1 risk reward ratio 🔥😉
You can never find anybody trade Bitcoin like me
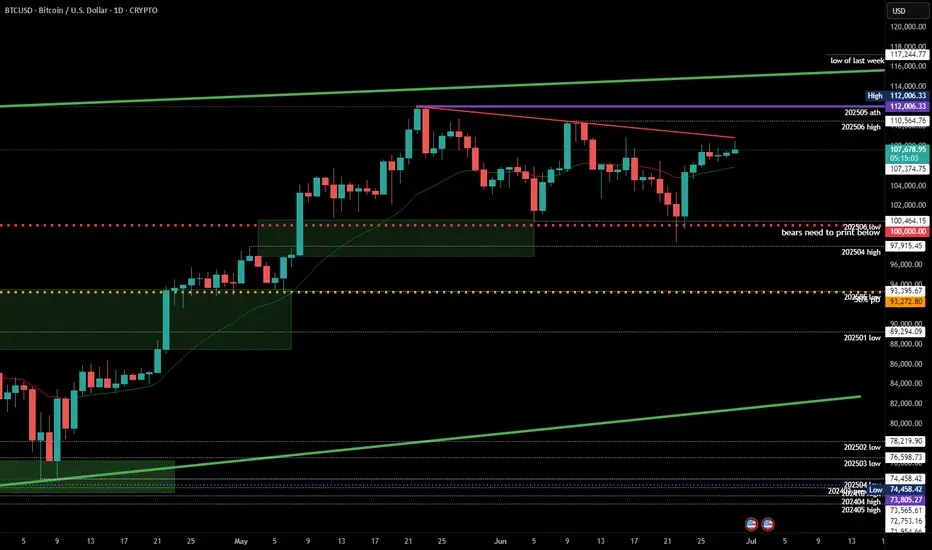
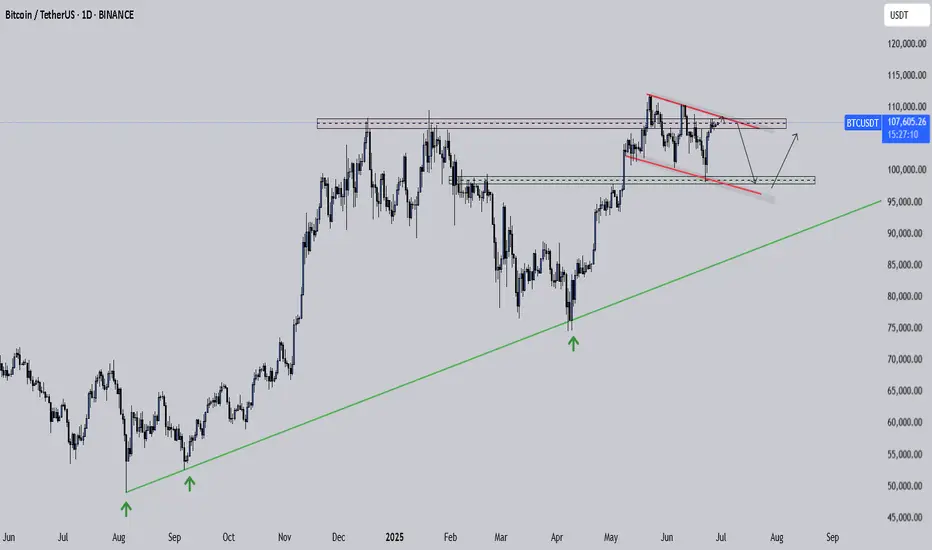
Bitcoin Pressing Up But This Compression Could Crack LowerBitcoin has been steadily climbing for months, respecting that long-term trendline since last year. Each dip into it brought a strong bounce, showing bulls are still in control of the bigger picture.
But right now price is pressing into a tight descending resistance line. We can see it making lower highs while struggling to break above that red trendline. At the same time, it’s sitting just above a key horizontal range, where buyers stepped in before.
This compression is risky . If BTC fails to push above the descending resistance and breaks back below the box, it could drop toward the next demand zone around the low 100K region .
As long as the major trendline from last year holds, the broader uptrend is intact . But losing this structure would open the door for a deeper correction.
This is the kind of spot where patience pays. Let the breakout or breakdown show its hand before jumping in heavy.
Bitcoin - Weekend OutlookCRYPTOCAP:BTC | 6h
Bitcoin is compressing below its all-time high, with 108k as the local resistance that must be reclaimed for a bullish continuation to retest the highs.
I expect the price to clear some poor highs around 108.8k–109.6k before taking out the bad lows around 106.3k-105.4k
As long as we hold above 104k , I believe we’re in a strong position and expect we will retest the highs.
However, losing the 103k support level would be concerning.
StochRSI indicator and support and resistance levels
Hello, traders.
If you "follow" me, you can always get the latest information quickly.
Have a nice day today.
-------------------------------------
The StochRSI indicator on the left chart is slightly different from the StochRSI indicator on the right.
The StochRSI indicator on the left chart is the StochRSI indicator provided by default in TradingView, and the StochRSI indicator on the right chart is an indicator with a modified formula.
The StochRSI indicator is a leading indicator that is reflected almost in real time.
Therefore, it reacts sensitively to price changes.
Although it is advantageous because it reacts sensitively, it also increases the possibility of being caught in a fake, so I thought that a slight delay(?) was necessary, and so I created the StochRSI indicator on the left chart.
If you look at the relationship between the K and D of the StochRSI indicators on the two charts, you can see that there is a big difference.
In the end, you can predict the movement by checking whether the movement of the K line has escaped the overbought or oversold section.
However, I think that you will receive information that can determine the sustainability of the trend depending on the positional relationship between K and D.
Therefore, it is important to distinguish the inflection points that occur in the StochRSI indicator.
This is because these inflection points provide important information for drawing trend lines.
Therefore, the StochRSI indicator on the left chart, which better expresses the inflection point, is being used to draw the trend line.
(Unfortunately, this indicator was not registered on TradingView because I did not explain it well.)
-
As a new candle was created, the StochRSI indicator on the left chart is showing an inflection point on the K line.
The StochRSI indicator on the right chart is showing a transition to a state where K < D.
We will have to check whether the inflection point was created only when today's candle closes, but I think that the fact that it is showing this pattern means that there is a high possibility of a change in the future trend.
Since the next volatility period is expected to start around July 2nd (July 1st-3rd), I think it has started to show meaningful movements.
-
It is true that you want to buy at the lowest price possible and sell at the highest price.
However, because of this greed, one mistake can lead to a loss that can overturn nine victories, so you should always be careful.
Therefore, if possible, it is better to check for support and respond.
In that sense, I think it is worth referring to the relationship between K and D of the StochRSI indicator on the left chart.
This is because the actual downtrend is likely to start when K < D.
-
In order to check for support, you definitely need support and resistance points drawn on the 1M, 1W, and 1D charts.
Ignoring this and checking for support at the drawn support and resistance points can result in not being able to apply the chart you drew to actual trading.
Therefore, you should draw support and resistance points first before starting a trade.
Otherwise, if you draw support and resistance points after starting a trade, you are more likely to set support and resistance points that reflect your subjective thoughts, so as I mentioned earlier, you are more likely to lose faith in the chart you drew.
If this phenomenon continues, it will eventually lead to leaving the investment market.
-
It is important to determine whether there is support by checking the correlation between the StochRSI indicator and other indicators at the support and resistance points drawn on the 1M, 1W, and 1D charts.
Even if the inflection point of the StochRSI indicator or other indicators occurs at a point other than the support and resistance points you drew, you should consider it as something that occurred beyond your ability to handle.
In other words, you should observe the price movement but not actually trade.
As I mentioned earlier, if you start to violate this, you will become less and less able to trust the chart you drew.
-
Accordingly, the basic trading strategy I suggest is to buy near the HA-Low indicator and sell near the HA-High indicator.
However, since the HA-Low and HA-High indicators are expressed as average values, they may move in the opposite direction to the basic trading strategy.
In other words, if the HA-Low indicator is resisted and falls, there is a possibility of a stepwise downward trend, and if the HA-High indicator is supported and rises, there is a possibility of a stepwise upward trend.
Therefore, the basic trading strategy mentioned above can be considered a trading strategy in the box section.
In the case of deviating from this box section, it is highly likely to occur before and after the volatility period indicated by the relationship between the trend line using the StochRSI indicator mentioned above and the support and resistance points drawn on the 1M, 1W, and 1D charts.
Therefore, special care is required when conducting new transactions during the volatility period.
This is because there is a high possibility of being caught in a fake when trading during the volatility period.
-
The DOM(60) and DOM(-60) indicators are good indicators to look at together with the HA-Low and HA-High indicators.
The DOM indicator is an indicator that comprehensively evaluates the DMI, OBV, and MOMENTUM indicators.
Therefore, the DOM(60) indicator is likely to be at the end of the high point range, and the DOM(060) indicator is likely to be at the end of the low point range.
In the explanation of the HA-Low and HA-High indicators,
- I said that if the HA-Low indicator receives resistance and falls, there is a possibility that a stepwise downtrend will begin,
- and if the HA-High indicator receives support and rises, there is a possibility that a stepwise uptrend will begin.
In order for an actual stepwise downtrend to begin, the price must fall below DOM(-60), and in order for a stepwise uptrend to begin, it must rise above DOM(60).
In other words, the DOM(-60) ~ HA-Low section and the HA-High ~ DOM(60) section can be seen as support and resistance sections.
-
If these correlations start to appear, I think you will be able to create a trading strategy that fits your investment style without being swayed by price volatility and proceed with trading.
The reason for analyzing charts is to trade.
Therefore, the shorter the time for chart analysis, the better, and you should increase the start of creating a trading strategy.
-
Thank you for reading to the end.
I hope you have a successful trade.
--------------------------------------------------